Ad-hoc analysis allows for quick data exploration. This document provides beginners with an example to experience ad-hoc analysis.
Edition supported: Professional Edition.
Prerequisite: Suppose you have created an ad-hoc analysis page. If no such page is created, create one first.
Through this document, you will learn the following:
Quickly Identifying Data Differences Through Calculation
Managing Analysis Processes Through Multiple Sheets
Narrowing Down Analysis Objects Through Pre-processing
Performing a Typical Sample Analysis of Data Differences
Viewing Ad-Hoc Analysis Results
The example scenario in this document is described as follows:
Scenario: A sales director at a company noticed a significant decline in business data recently and needs to explore the reasons for the changes.
Data: Extract a detailed data table from the system containing fields such as date, dimension, and metrics for analysis.
Data Connection and Field Operations
After creating an analysis page, you need to connect data and set the analysis dimension and metric.
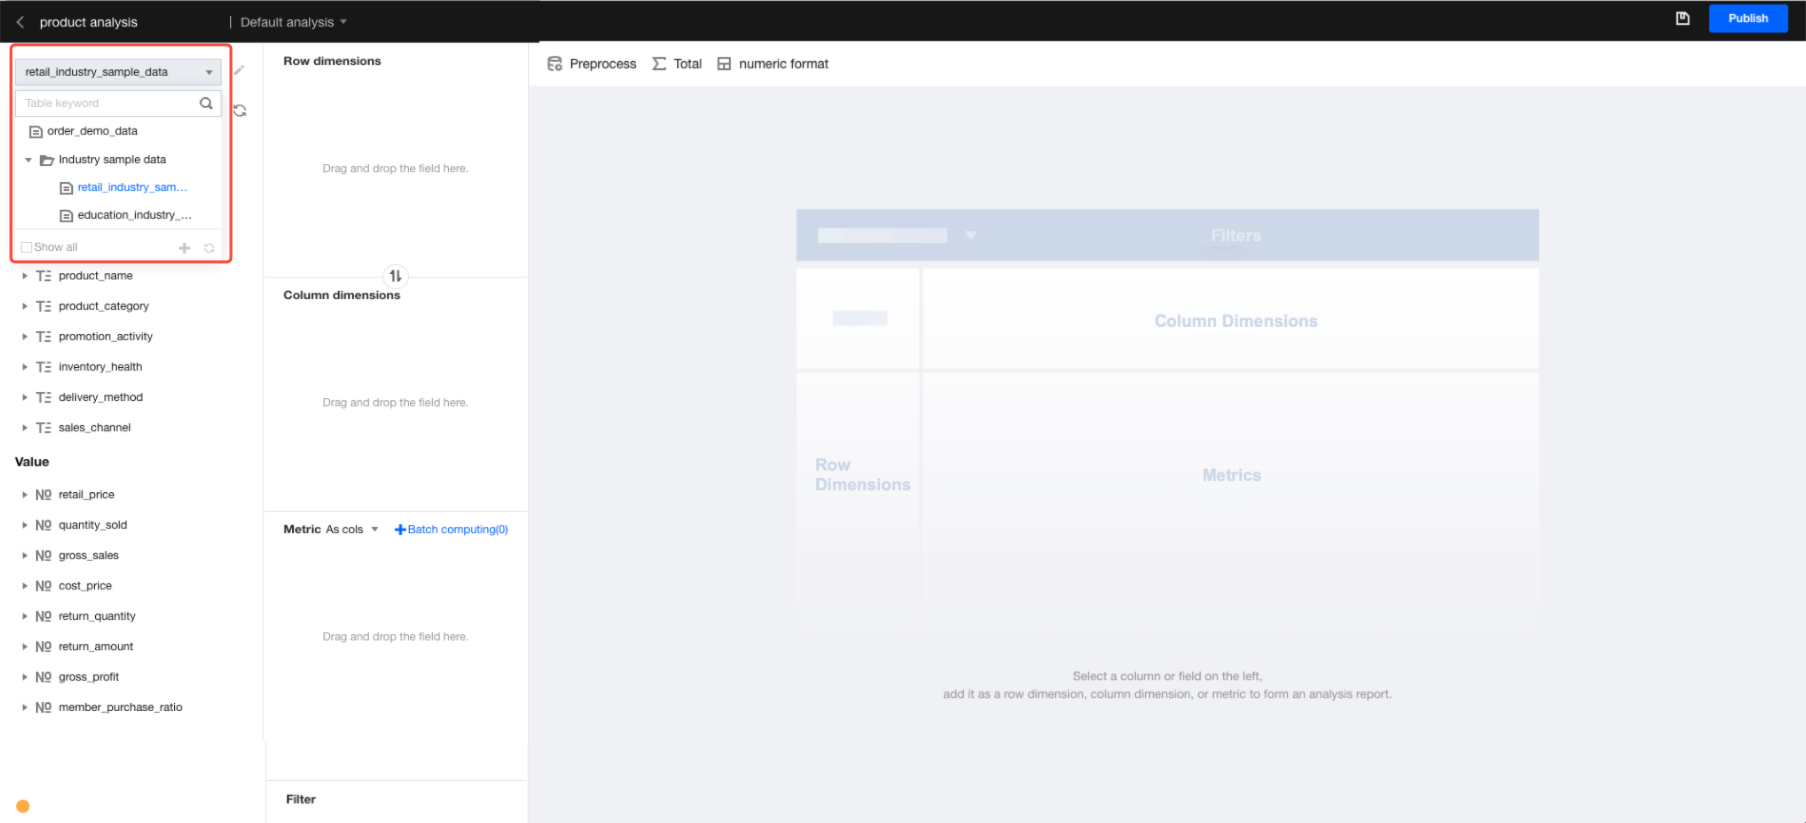
1. Connect to a data table: Select a data table.
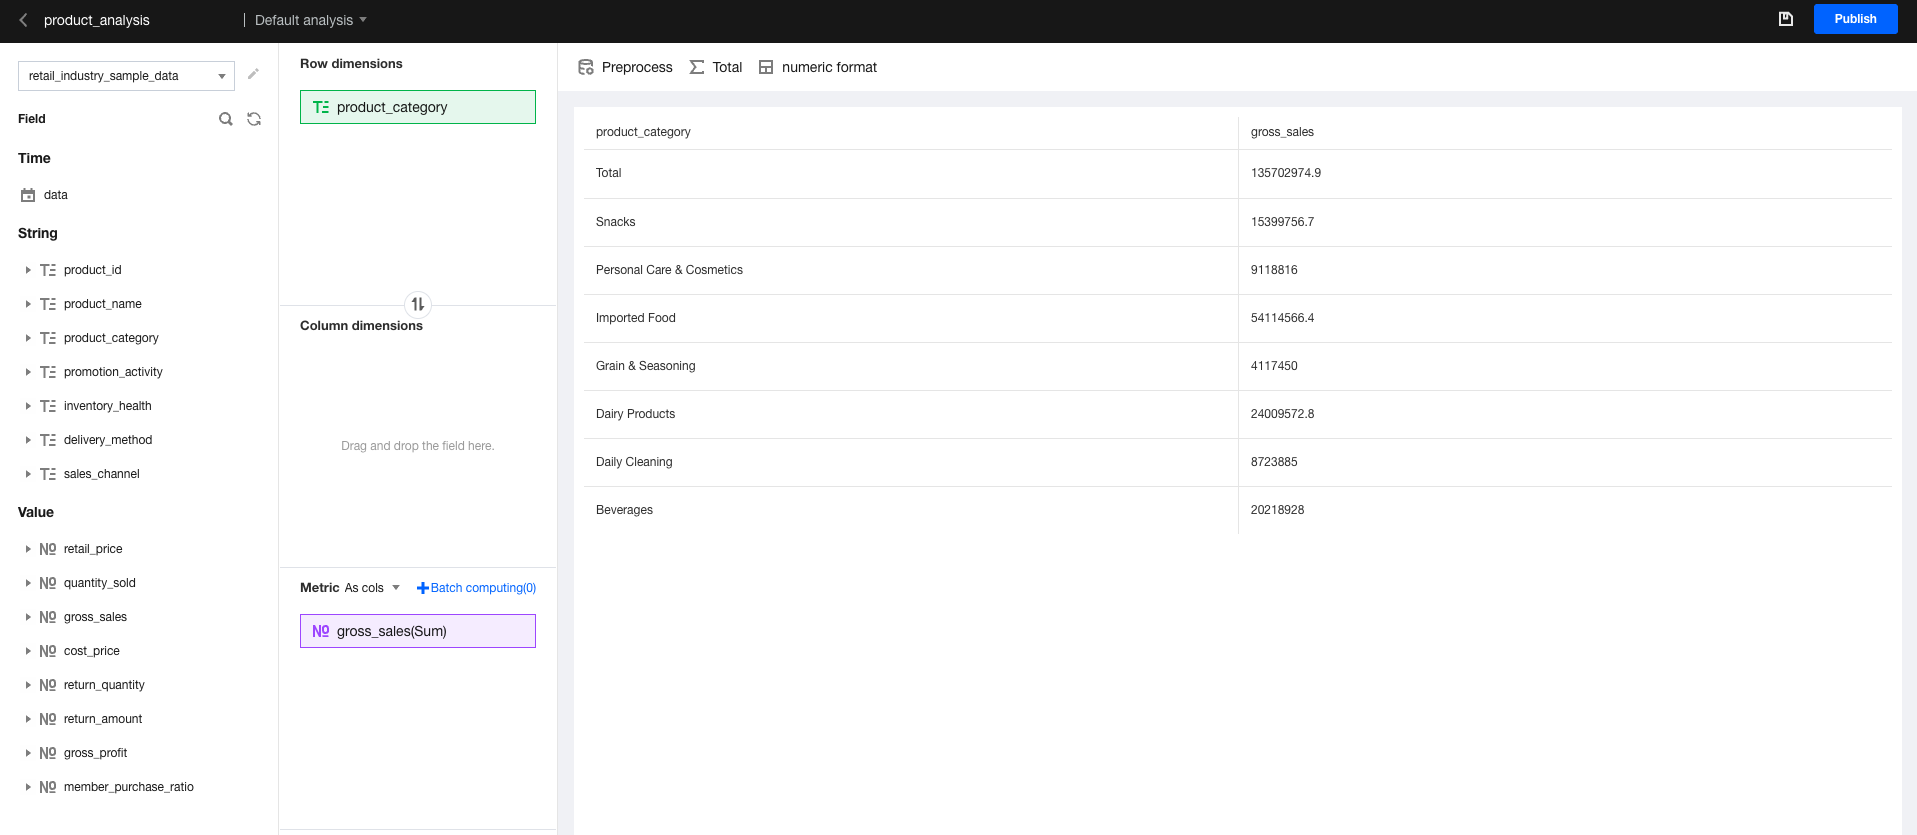
2. Drag and drop fields for analysis:
In this scenario, you need to assess to what dimensions and values the data transformation may relate and drag in dimensions as the row dimension and drag in values as metrics.
Quickly Identifying Data Differences Through Calculation
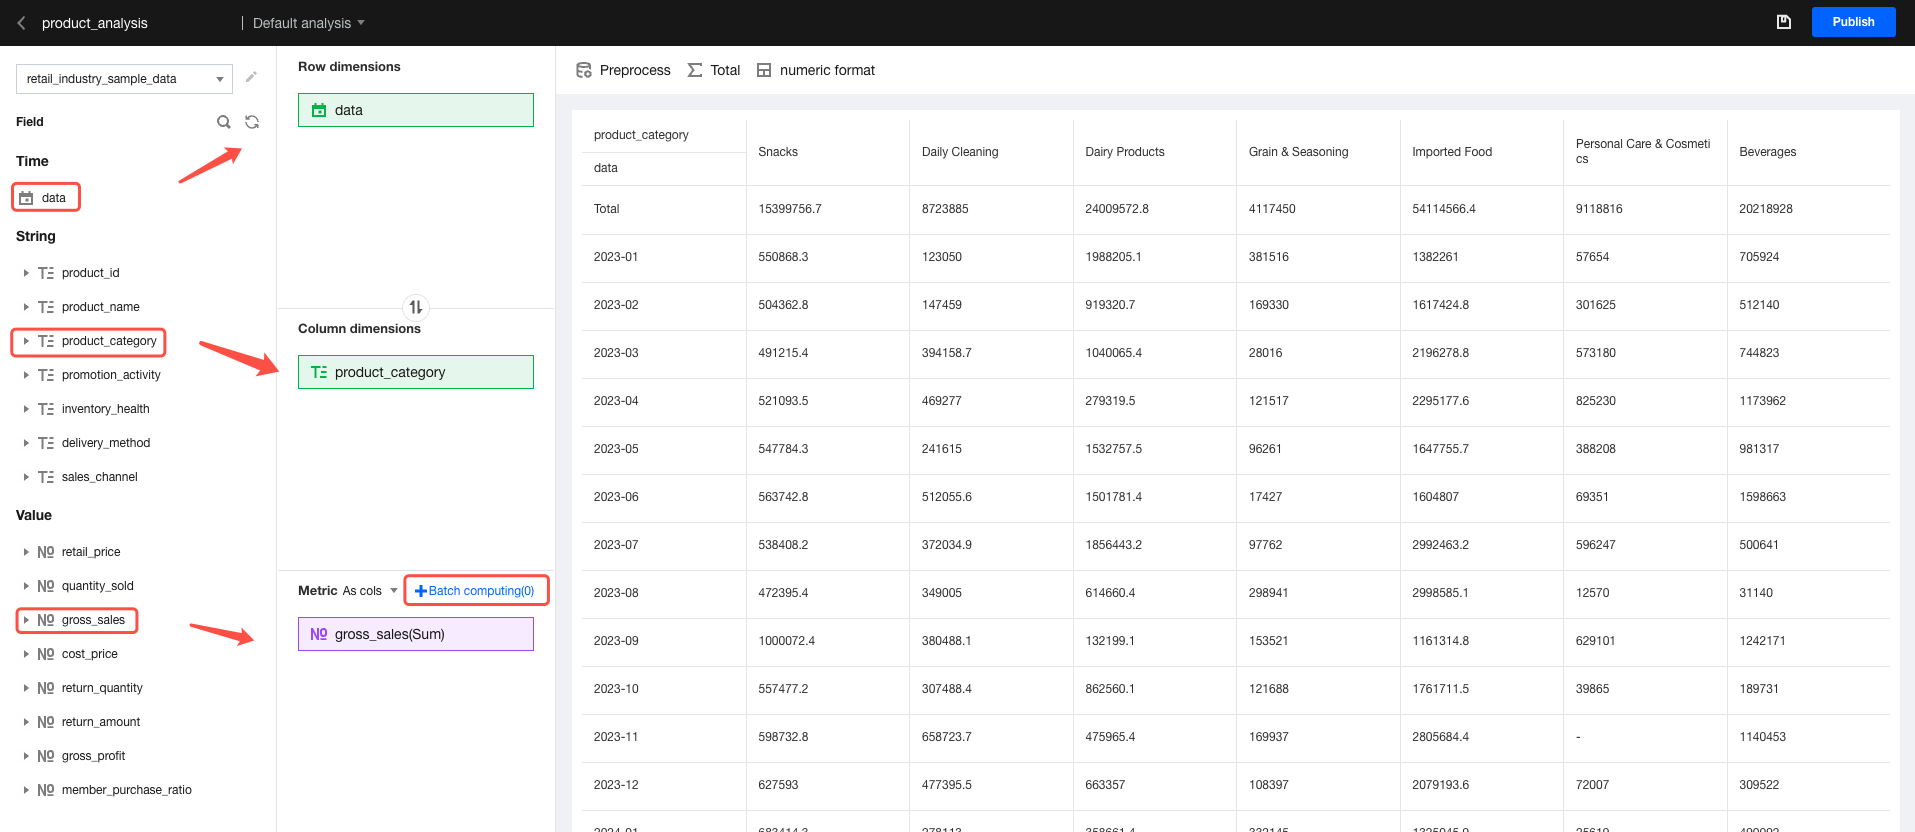
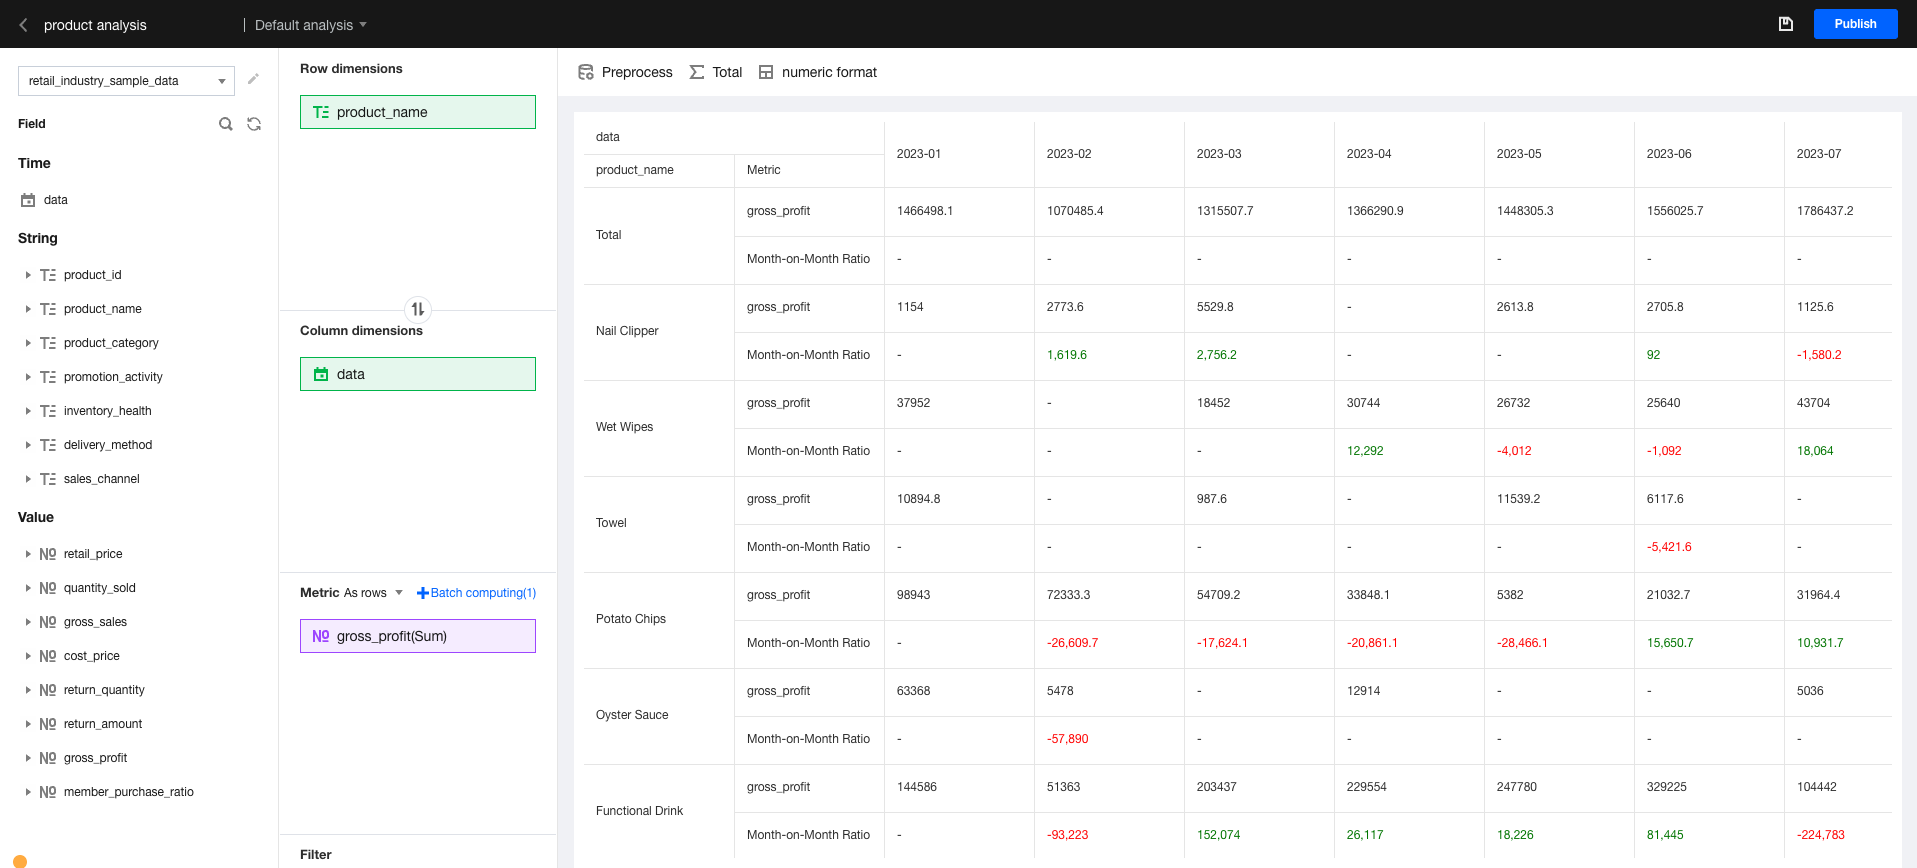
Drag the time dimension field, set "sequential comparison" through Batch Compute, and view which dimensional period-over-previous period values have changed.
For convenience, move specific dimensions from the row dimension to the column dimension.
Add the "Time" field to the row dimension and aggregate the "Time" dimension to "By month". This makes it easy to view data changes by month.
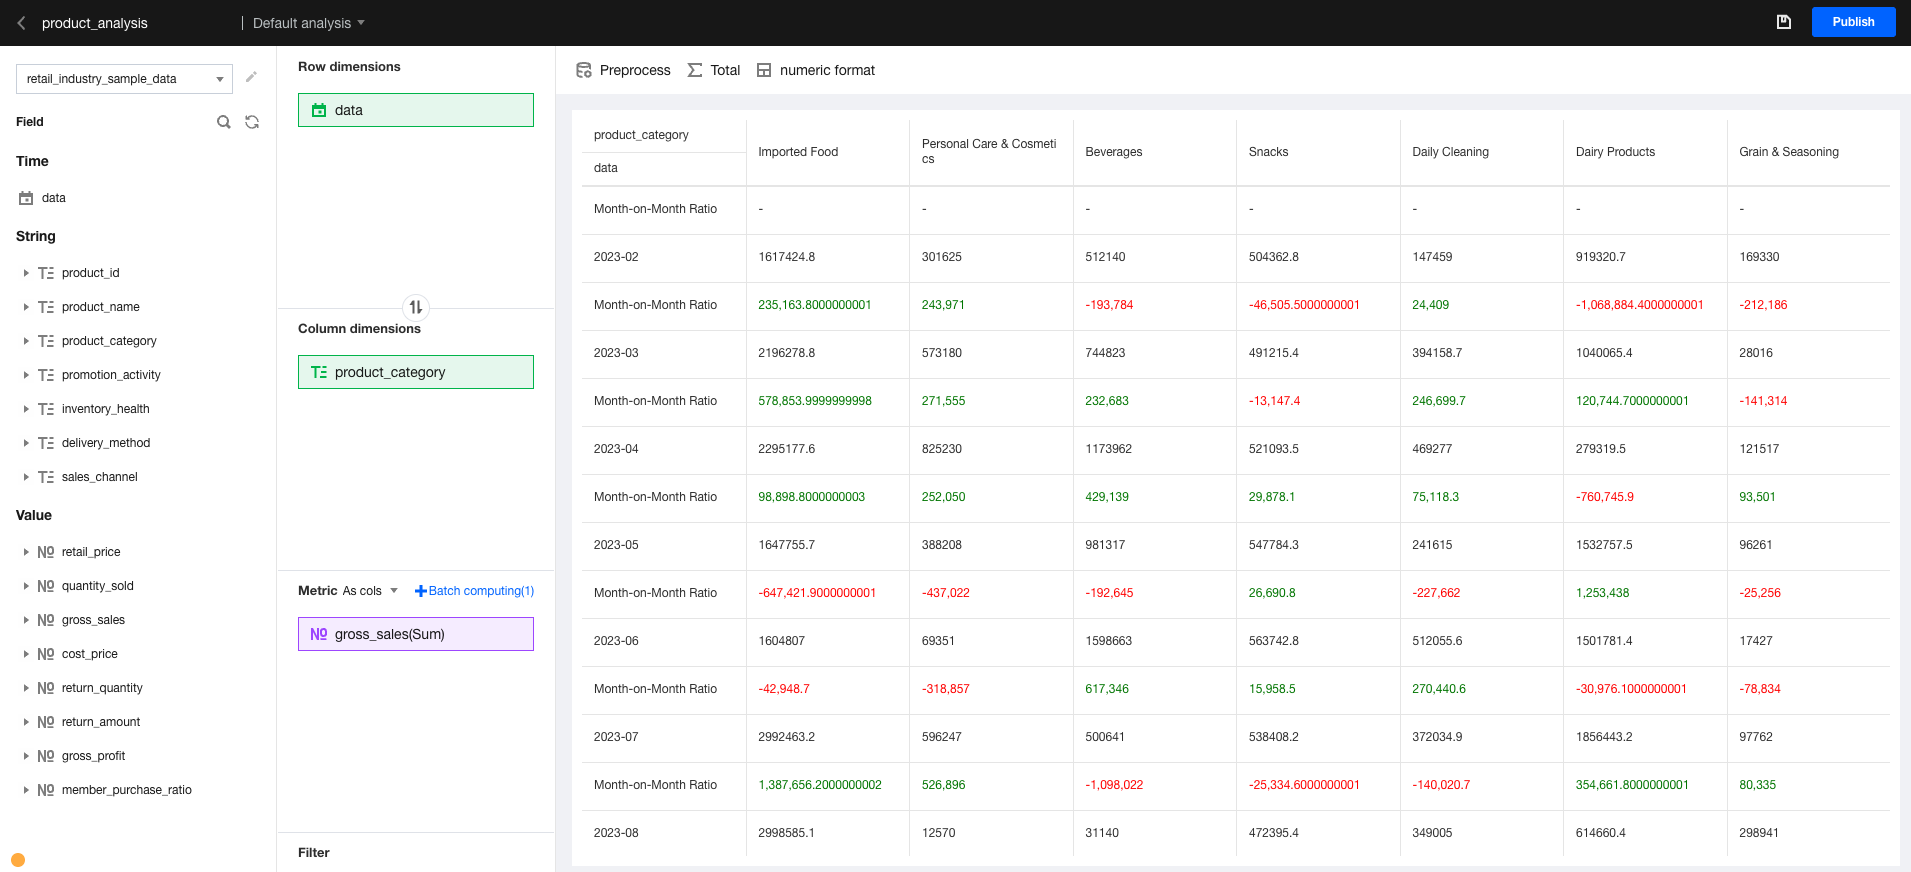
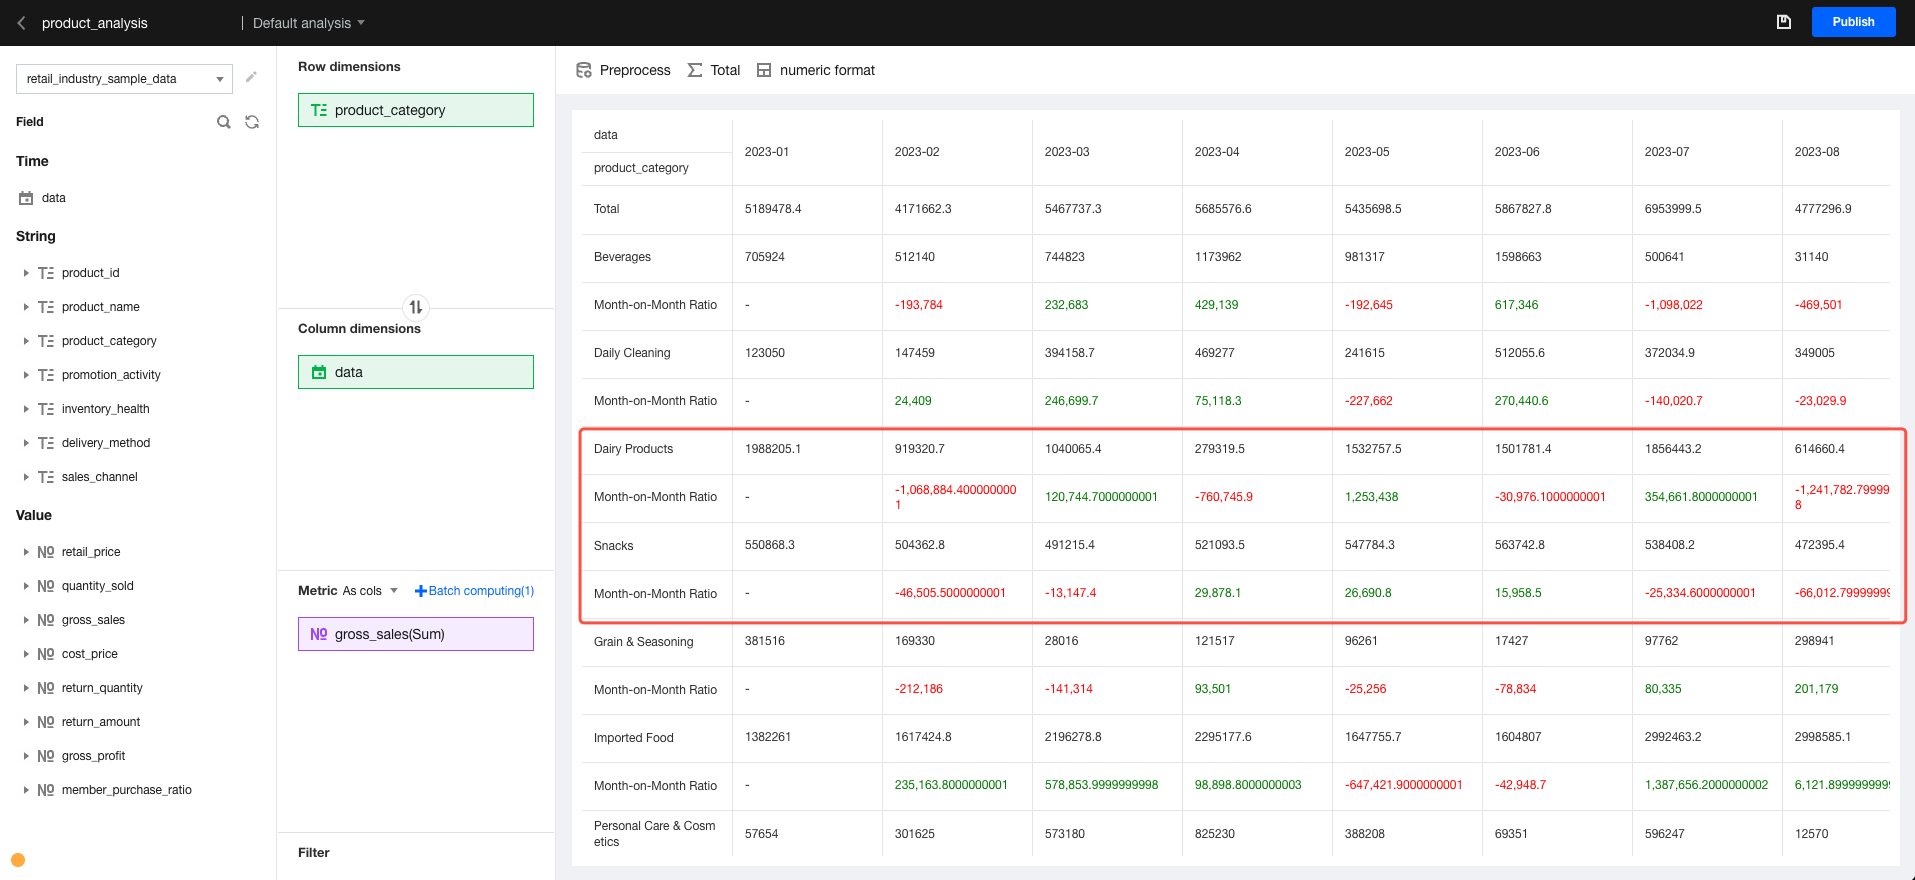
Batch calculations: Set the month-over-month comparison and highlight negative values in red. This makes it easy to identify abnormal data.
In the figure, we found differences in metrics across different months and dimensions.
Managing Analysis Processes Through Multiple Sheets
We want to reserve the original analysis model and add an analysis process.
Easily switch between analysis processes through multiple sheets.
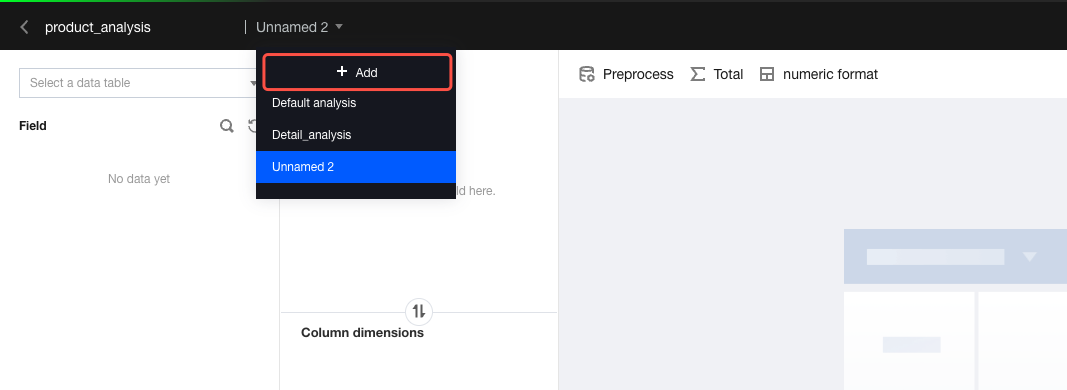
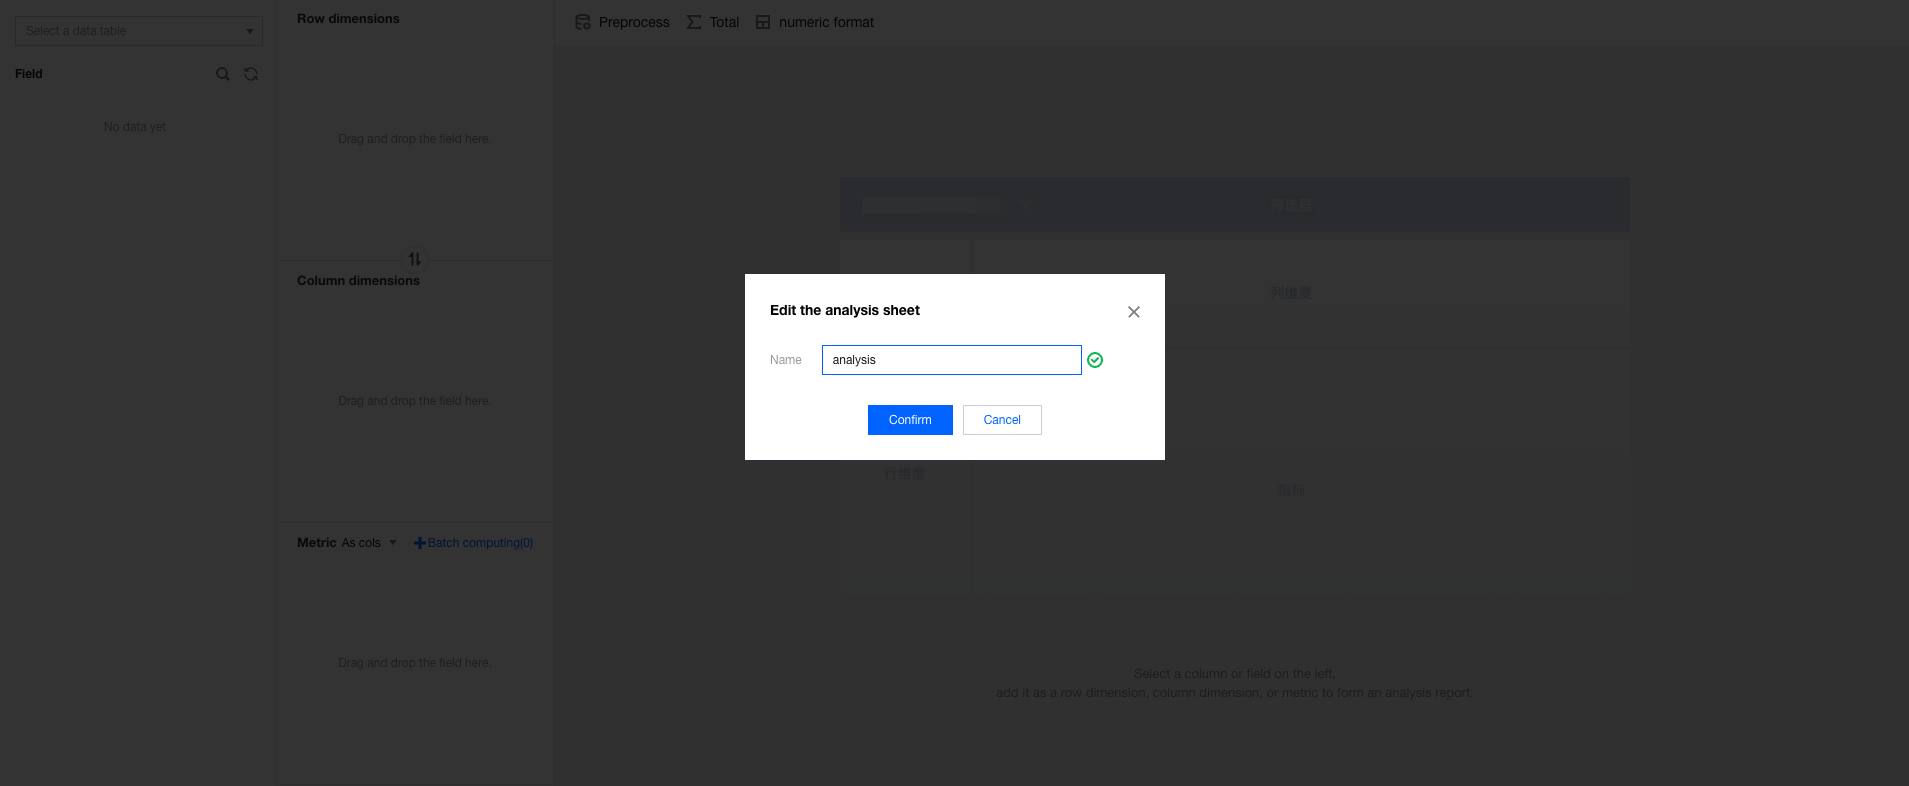
Add a sheet as a special analysis.
Connect to the data table, drag and drop the "Time", "Dimension", and "Value" fields to the following locations, then set batch computing.
To switch back to the previous process, switch the sheets.
Narrowing Down Analysis Objects Through Pre-processing
Through the above procedure, we analyzed some dimensions and filtered the analysis object by pre-processing.
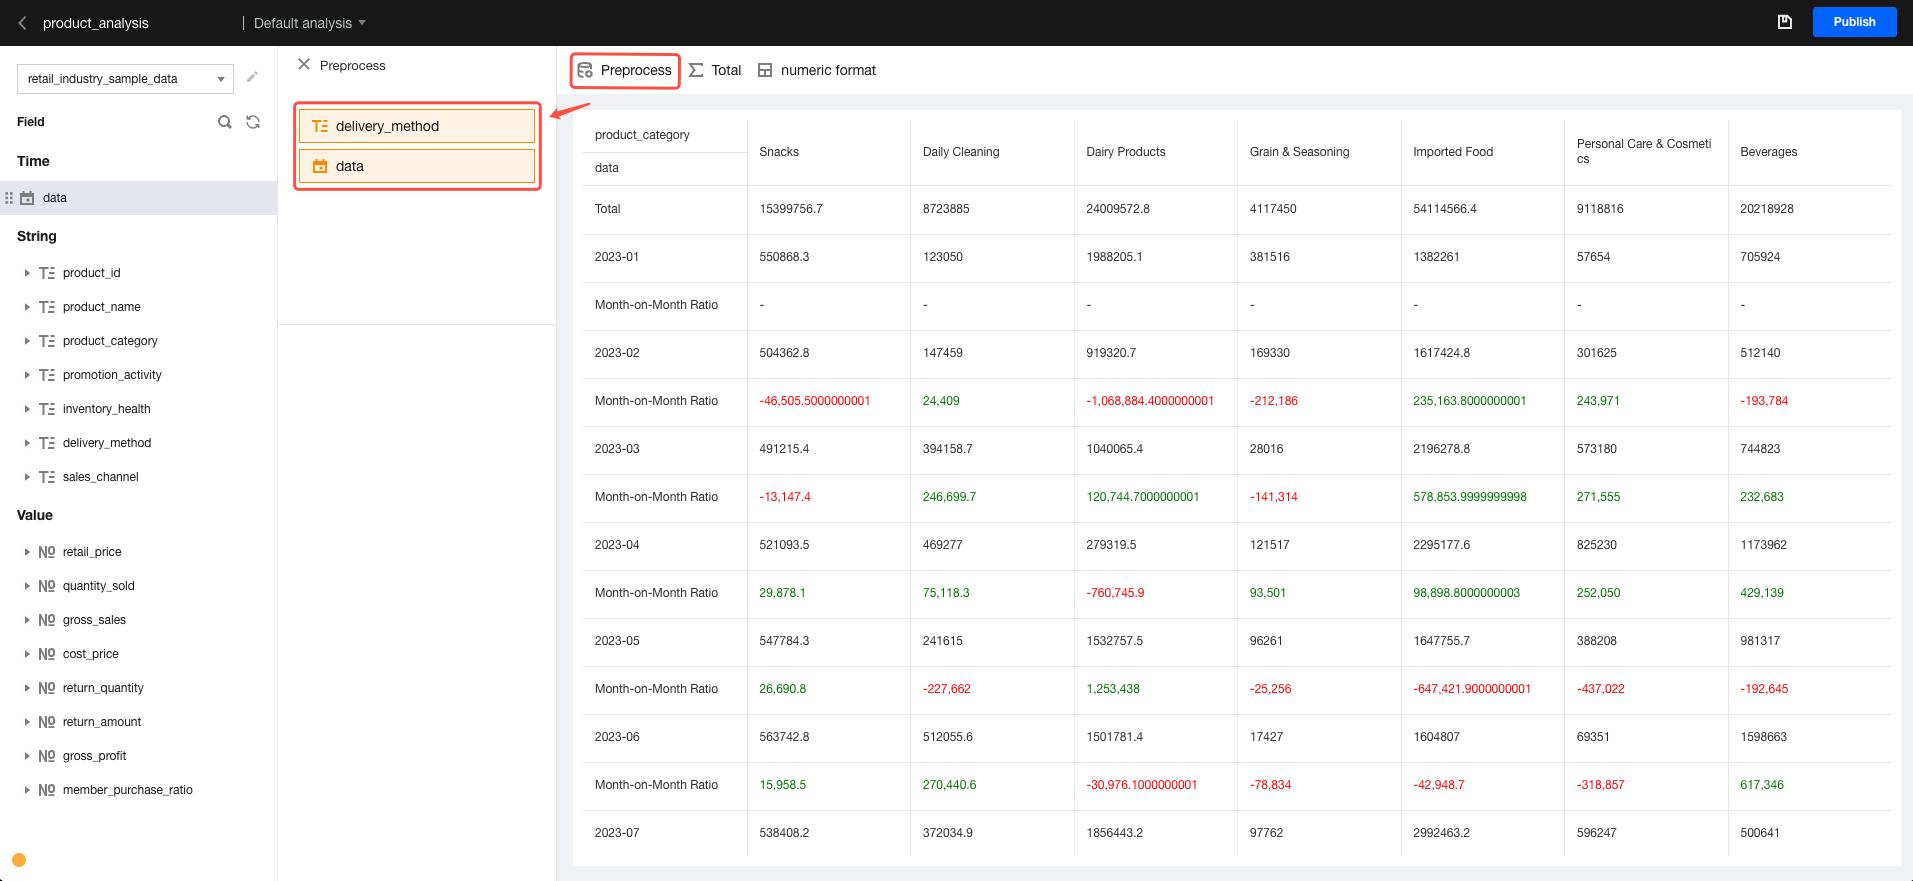
Click Preprocess to enable the pre-processing filter settings.
Drag and drop dimension fields into the pre-processing filter for condition settings.
Drag and drop the "time" field into the pre-processing filter to set the time condition (when the difference occurred).
After the settings, click "X" to return to the analysis interface.
Performing a Typical Sample Analysis of Data Differences
Through the above procedure, we analyze the detail:
By observing, we found variations in the data details.
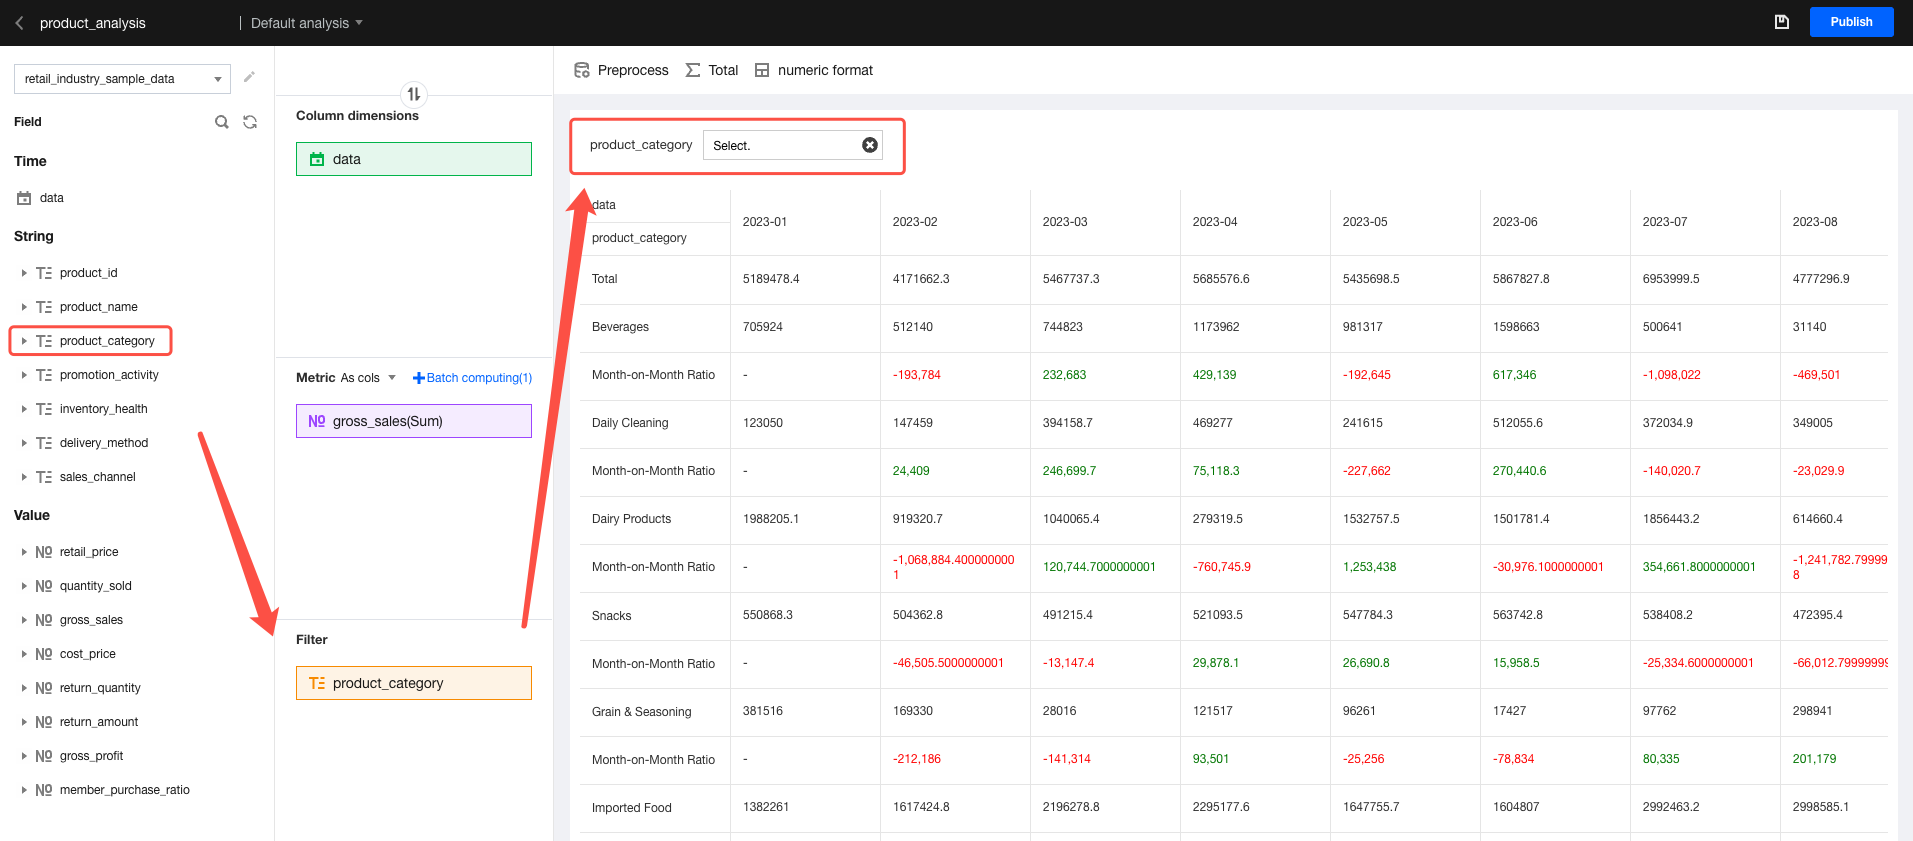
You can also drag a field into "filter". This way, you can quickly switch sample conditions in the analysis area.
Viewing Ad-Hoc Analysis Results
Congratulations on identifying the factors that influence the changes in output value through your continuous exploration!
At this point, you identify an influencing factor in the data. So you need to use the analysis result to convince the team decision-maker and adjust the management policy.
You can release the current analysis page and then share it with the decision-maker.
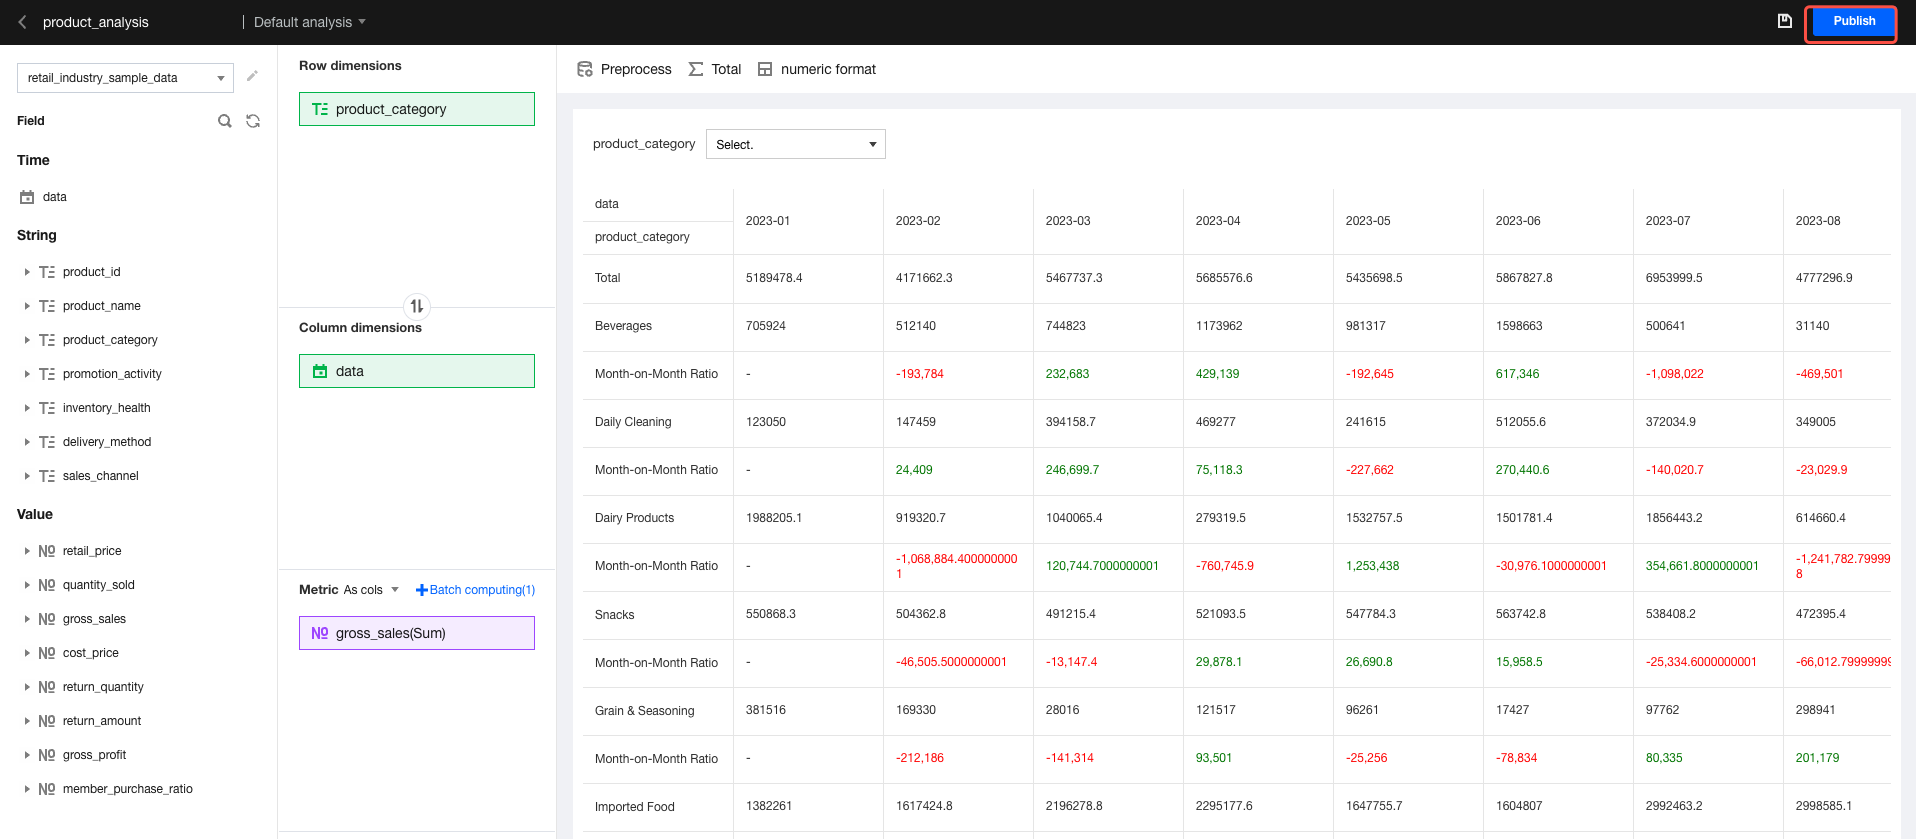
Release the page: As shown in the figure below, click Publish to perform ad-hoc analysis.
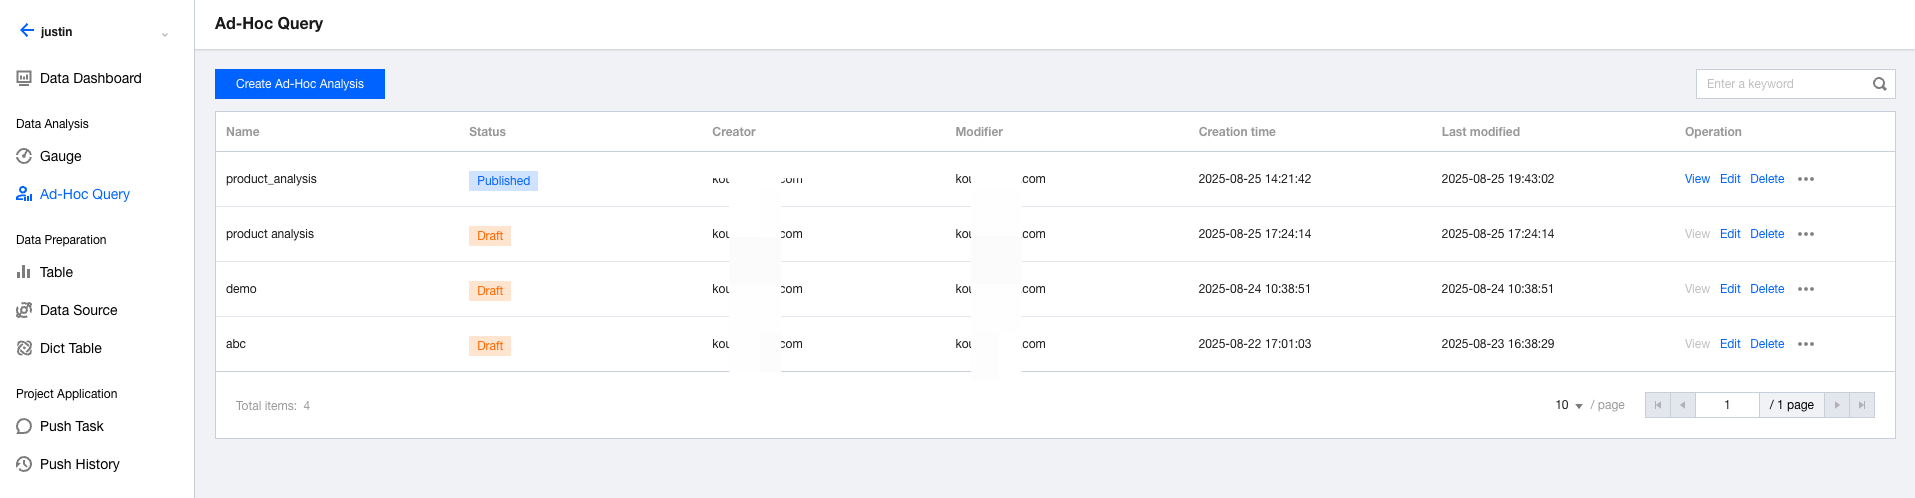
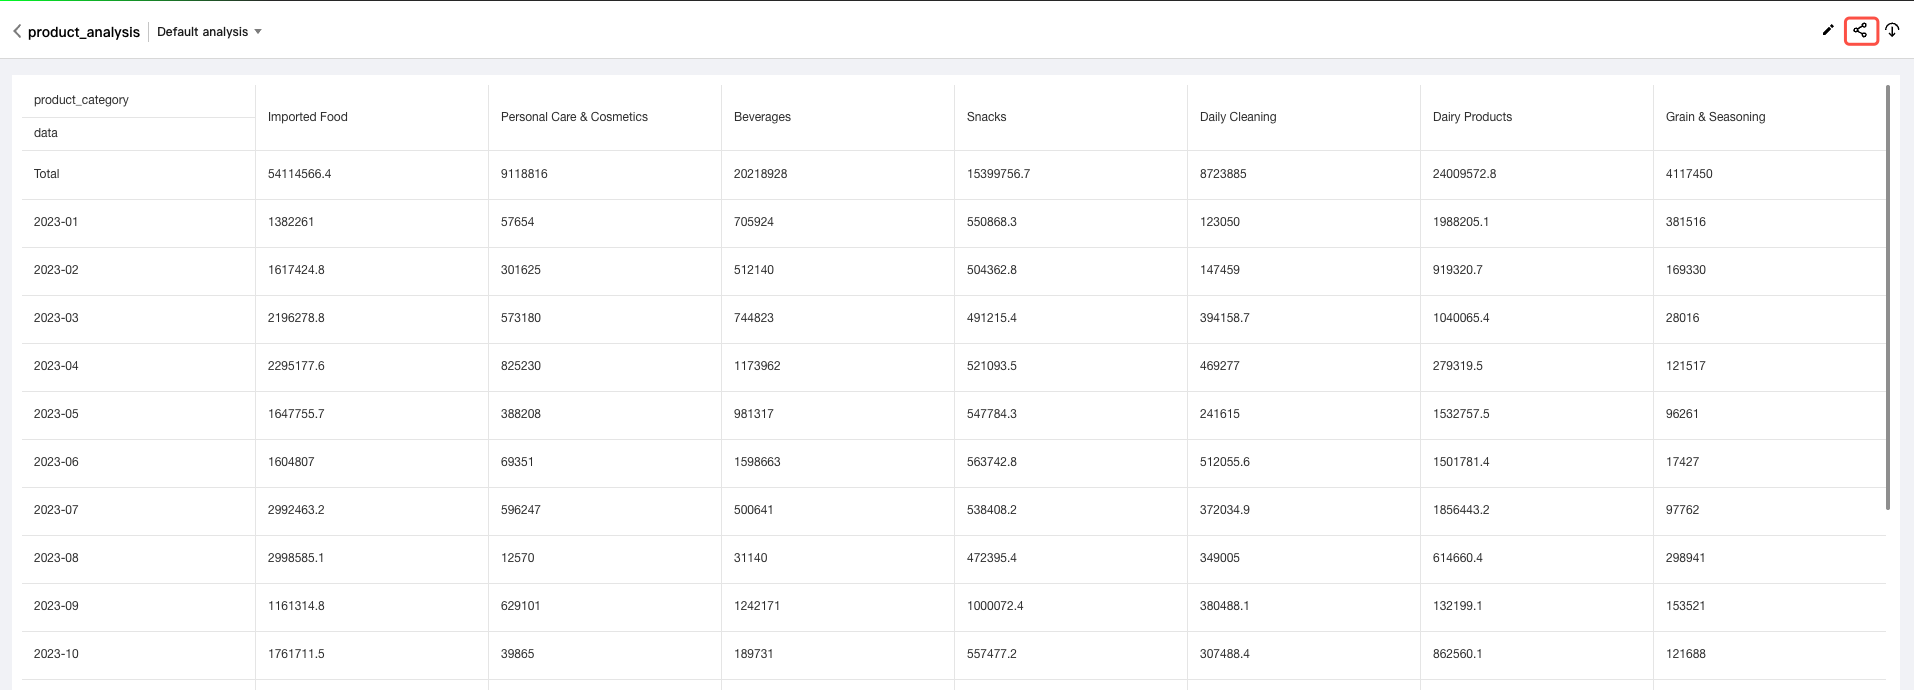
View the page: Go to the ad-hoc analysis list page, then click View in the "operation" column to view the analysis result.
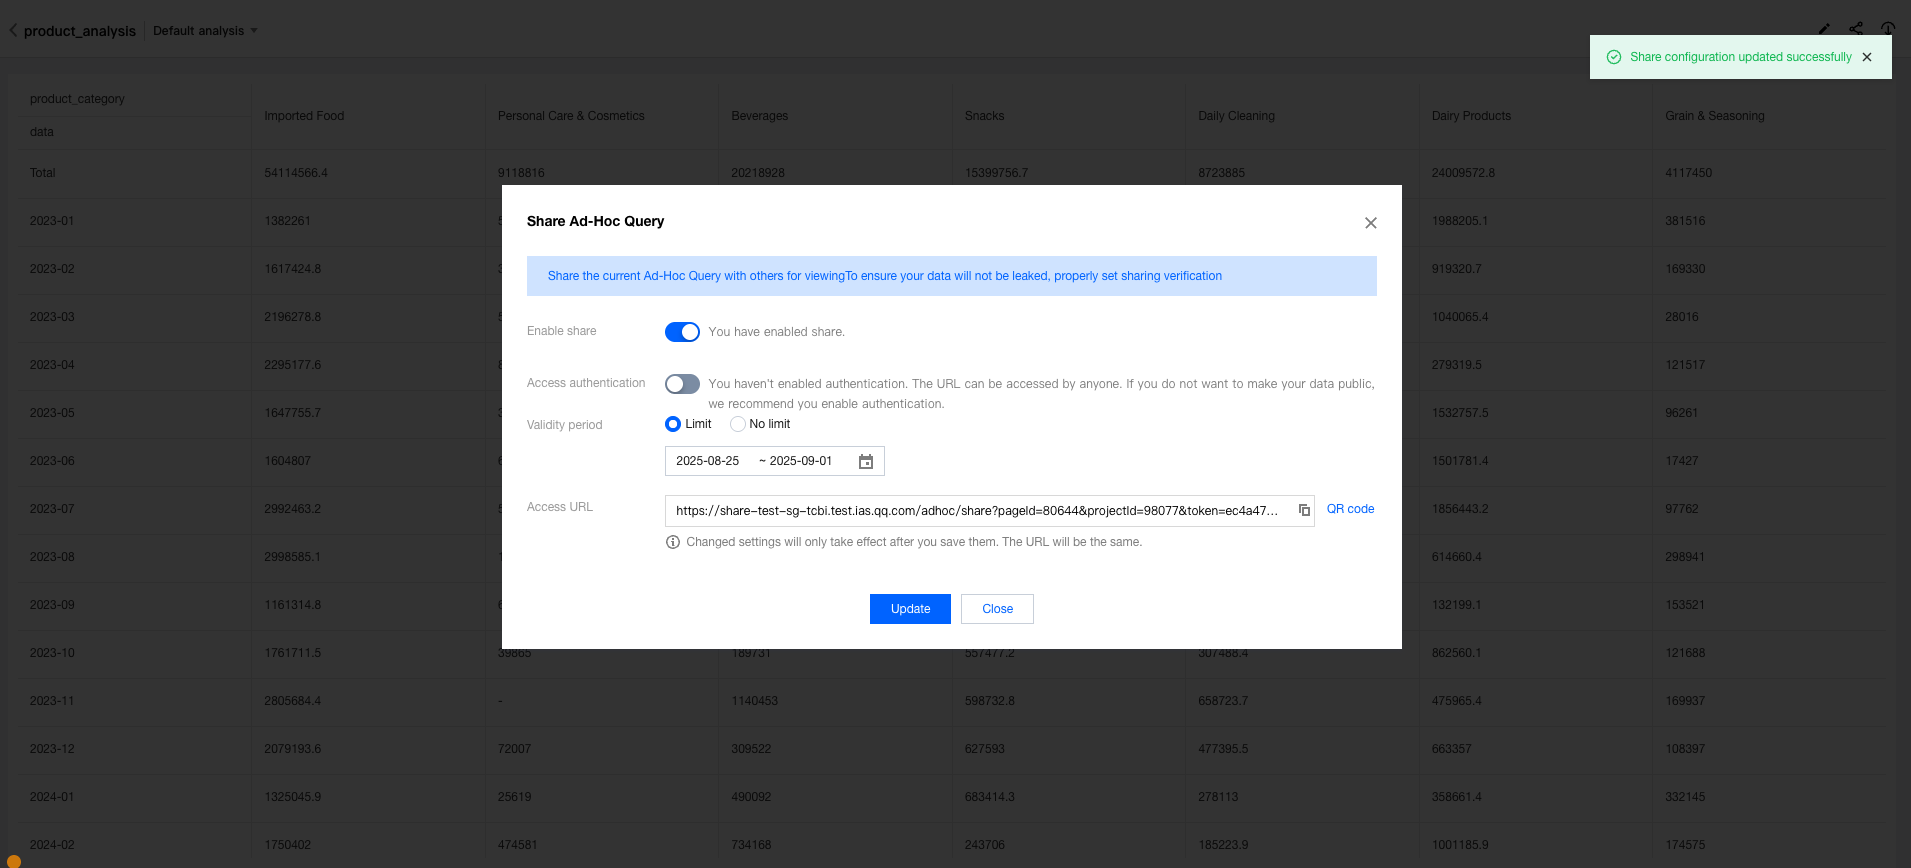
Share the page: When viewing the page, you can click the share icon to configure share settings.
After the settings, you will obtain the corresponding access link. Send this link to the decision-maker. Then, the decision-maker can access your analysis page.