Ad-hoc analysis, also known as temporary analysis, is a drag-and-drop exploratory analysis method for data analysts.
Ad-hoc analysis differs from dashboard-based analysis and has the following features:
Dashboard-based Analysis
Ad-Hoc Analysis
With a clear business model, this analysis method can identify metrics that reflect the business status.
Without a clear business model, this analysis method requires analysts to constantly change dimensions and metrics to ultimately identify the dimension and metric elements that reflect the business status.
The data and analysis model are fixed, and the requirements for "real-time" performance are low.
Data is retrieved in real time, the results are obtained quickly, and the requirements for "real-time" performance are high.
The dimension is fixed. A chart displays the results of a single-dimension model.
Analyzing a topic from different dimensions is supported. The analysis results from multiple dimensions can be compared to identify the optimal solution.
For example, for the "sales" metric, you can compare the results across channel, department, customer category, and region category dimensions to identify the influencing factor that best reflects "sales".
A visual chart is exported.
The business analysis model (combination of dimensions and metrics) is exported through exploration. The exported model is applicable to dashboard-based analysis.
Edition support: Professional Edition.
Through this document, you will learn the following:
Use Cases of Ad-Hoc Analysis
UI Interface Composition
Use Cases
Case 1: Temporary Data Discussion Meetings
An e-commerce company generates a large amount of user data every day. The operation team needs to conduct a data review every evening. During a review session, the boss noticed a sudden increase in product orders for a certain category, which was unexpected under normal circumstances. The boss asked the operation personnel to conduct an on-site investigation of the reasons for this abnormal change.
Case Difficulties:
Emergency event: The event cannot be anticipated in advance and requires the operation personnel to analyze it separately.
Real-time calculation: Since the cause is unknown, we can only attempt to guess continuously, and the data result should be quickly calculated.
Ad-hoc analysis enables quick self-service analysis for non-fixed models via drag-and-drop operations, delivering results instantly.
Case 2: Root Cause Analysis for Issues
An intelligent manufacturing company found a drop in the yield rate of a batch of products, but too many processes and craftsmanship factors might affect it, leaving no clear approach for analysis.
Case Difficulties:
Multiple variables: A uniform analysis model cannot be established, and creating a model for each process leads to significant workload and adjustment complexity.
Comparison difficulty: Automated comparisons across multiple dimensions cannot be achieved, affecting analysis efficiency.
Ad-hoc analysis allows for building multiple sheets, multiple dimension combinations, and dimension value combinations for a topic. With built-in computing capabilities, it can quickly identify differences among multiple solutions.
Case 3: Data Effect Inference
A telecommunications operator plans to launch a new package. The operations team needs to estimate the attractiveness of the package and the corresponding operational risks.
Case Difficulties:
Complex user tags: Each user has over 100 tags, and these tags have different combinations.
Varying focus points of the decision-making team: The operations department needs to consider the impact on channels and marketing, while the customer service department needs to consider the impact on the service carrying capacity after scaling up customer groups.
Ad-hoc analysis allows for grouping each tag combination. By comparing the historical effects of multiple combinations, the actual impact of the package can be deduced. Different departments can customize their own analysis sheets to illustrate the impact of the new service on their teams.
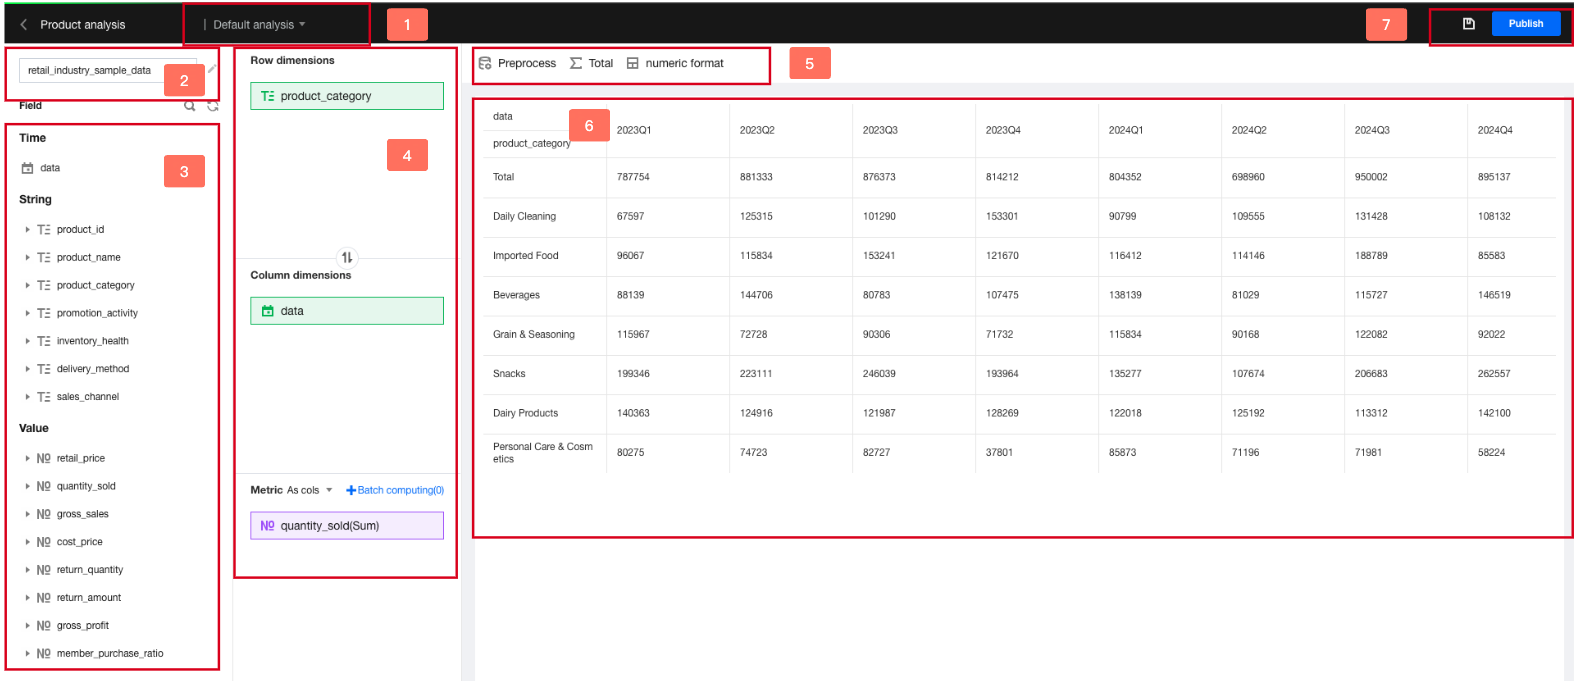
Interface Descriptions
1. Switching Sheets
You can create multiple sheets for a topic to analyze the topic from different dimensions.
2. Switching Data Tables
You can quickly switch data tables.
3. Field Operations
You can drag and drop fields to the analysis area. Field search, dimension value expansion, and grouping are supported.
4. Analysis Area
After dragging and dropping fields to the analysis area, you can perform operations including aggregation, sorting, and calculation. You can also quickly create a filter to filter the fields.
5. Feature Area
More table definitions are supported, including conditional filtering for data pre-processing and total configurations.
6. Table Interaction Area
The data result is displayed. If a filter is configured, quick filtering can be performed.
7. Release and Save
Once the ad-hoc analysis is released, you can directly query the result or share the report.