tencent cloud

Business Intelligence

Product Introduction
Product Overview
Strengths
Product Features
Use Cases
Purchase Guide
Billing Instructions
Purchase Guide
Upgrade Instructions
Renewal Instructions
Quick Start
Data Access
Creating a VPC Data Source
Creating Cloud Data Sources
Creating Proprietary Data Sources
Data Table Creation and Data Processing
Introduction to Data Analysis Basics
Data Table Creation
Data Processing
Data Analysis
Analysis Settings
Interactive Analysis
Ad-Hoc Analysis
Data Visualization
Public Style Setting Instructions
Filter Components
Chart components
Rich Text Component
Other Components
Mobile Terminal Layout Editor
Theme Settings Introduction
Page Layout Introduction
Dashboard Directory Management
Collaboration and Application
Push Channel Management
Report Push
Sharing
Embedding
Self-Service Data Retrieval
Metric Alarms
Data Security
Parameter Construction
Platform Management
Account and Permission Management
Statistics and Analysis
System Settings
Resource Migration
Practical Tutorial
Collection of Optimization Practices
Performing Trend Analysis
Performing Proportion Analysis
Performing Data Analysis with Excel Files
Creating Tables
API Documentation
History
Introduction
API Category
Making API Requests
Project Management APIs
Role APIs
Database Table APIs
Report Embedding APIs
Page Management APIs
Data Types
Error Codes
FAQs
Relevant Agreements
Service Level Agreement
Privacy Policy
Data Privacy And Security Agreement
Contact Us

Page Layout Introduction

PDF
Focus Mode
Font Size
Last updated: 2025-09-19 15:24:43

Overview

This article introduces the usage guidelines and use cases of two commonly used layout styles in Tencent Cloud Business Intelligence (BI) products for data analysis and visual reports: flow layout and cockpit layout.
Human visual characteristics: The human eye naturally views content from left to right and top to bottom. Therefore, it is best to place important content on the left side and top of the report page. Keep related content adjacent, and you can also use whitespace or background color to split data.

Introducing Flow Layout

1. Flow layout use cases: for example, daily reports, monthly reports, and regular business operation reports or written report-style data reports.


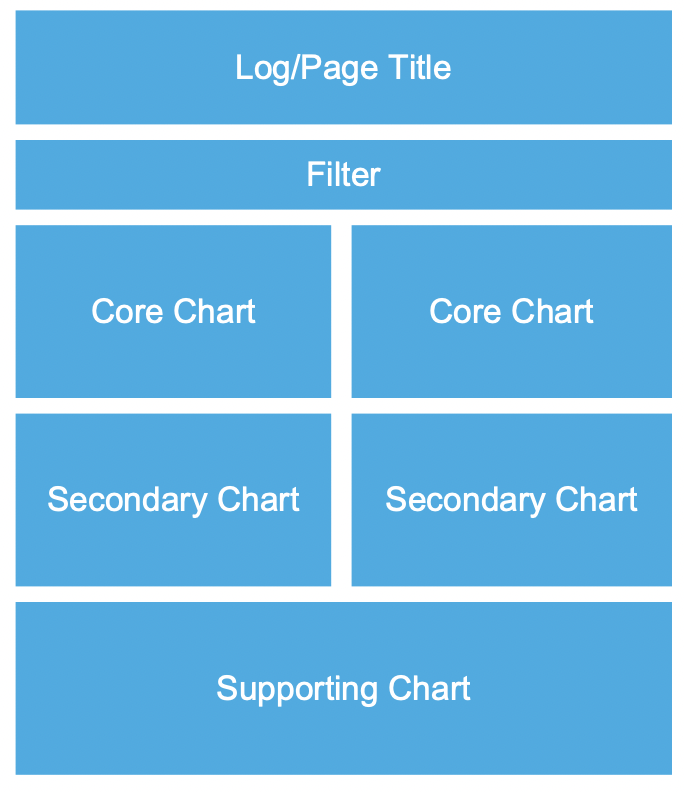
2. Flow layout principles:
Top: Place the company logo/page title image to help readers intuitively understand the core theme of the data report.
Header: Place the data filtering component at the top, followed by the most important core chart component (such as core KPI metrics), arranged from left to right and top to bottom by importance.
Waist/bottom: Place secondary/auxiliary data chart components to provide supplementary description for the data report page, such as detailed tables, etc.

Cockpit Layout Introduction

1. Use cases: Leader/Boss core data cockpit/large screen


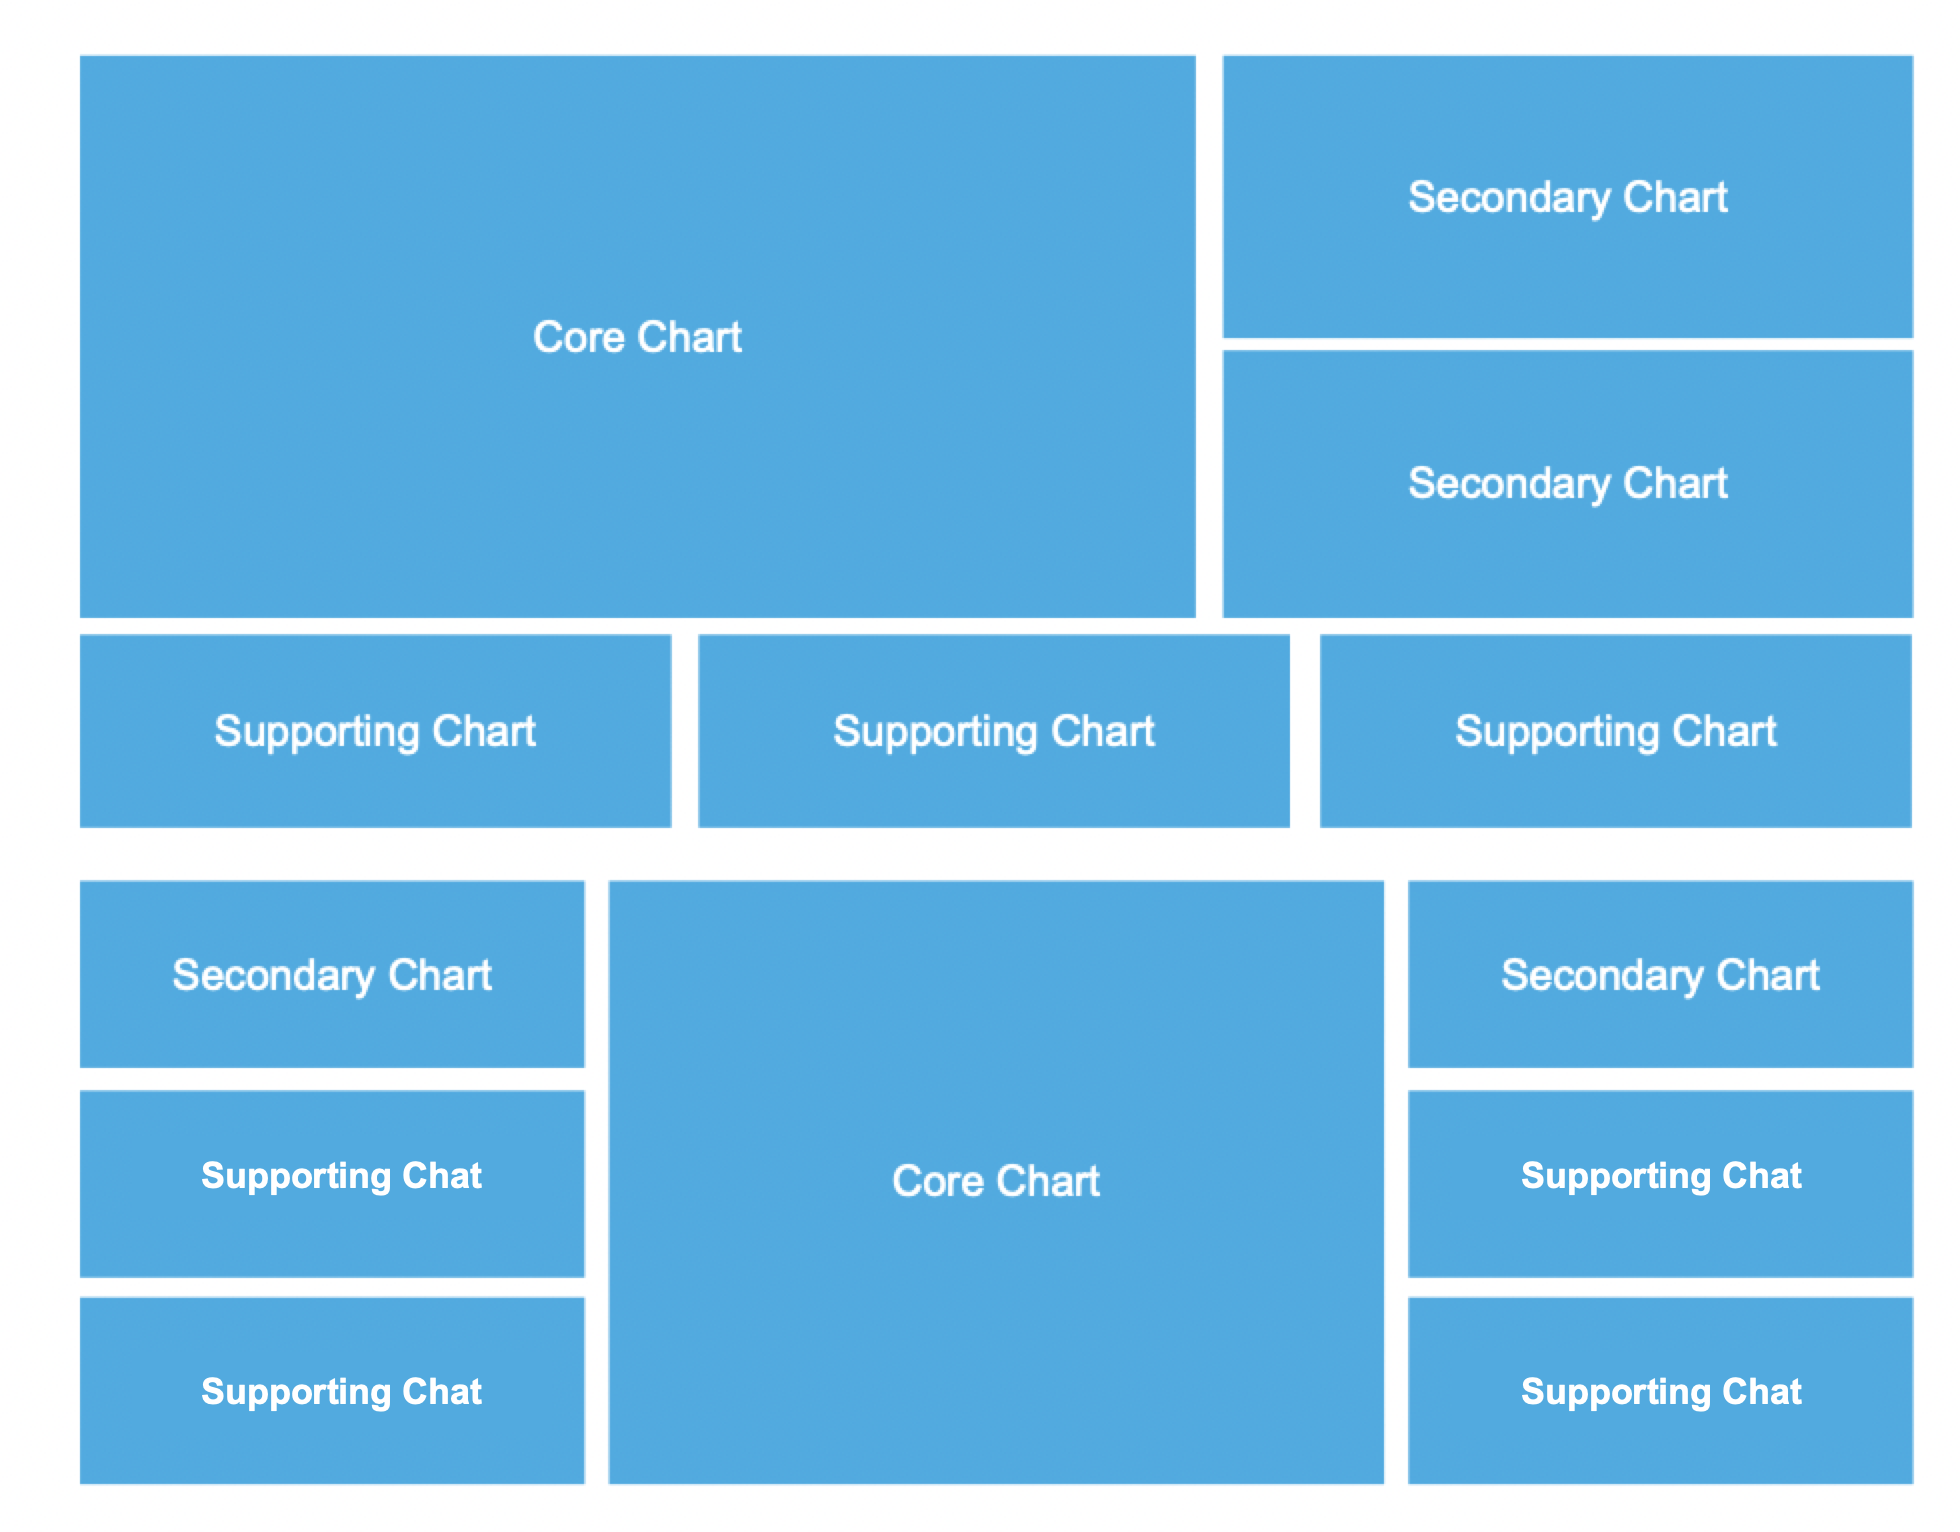
2. Cockpit layout principles:
Core area: Place core business metrics in the middle position with a large area, often featuring dynamic-effect-rich maps. The top can display the company logo/page title image.
Secondary area: Minor metrics are located on the left and right of the screen, mostly various charts.
Auxiliary area: Auxiliary analysis content can be displayed through drill-down/integration/redirection.


Help and Support

Was this page helpful?

Help us improve! Rate your documentation experience in 5 mins.

Feedback