Tencent Cloud Business Intelligence (BI) product includes crosstab, table, and detailed table, mainly used for dimensional metric data statistics or detailed data display.
Crosstab
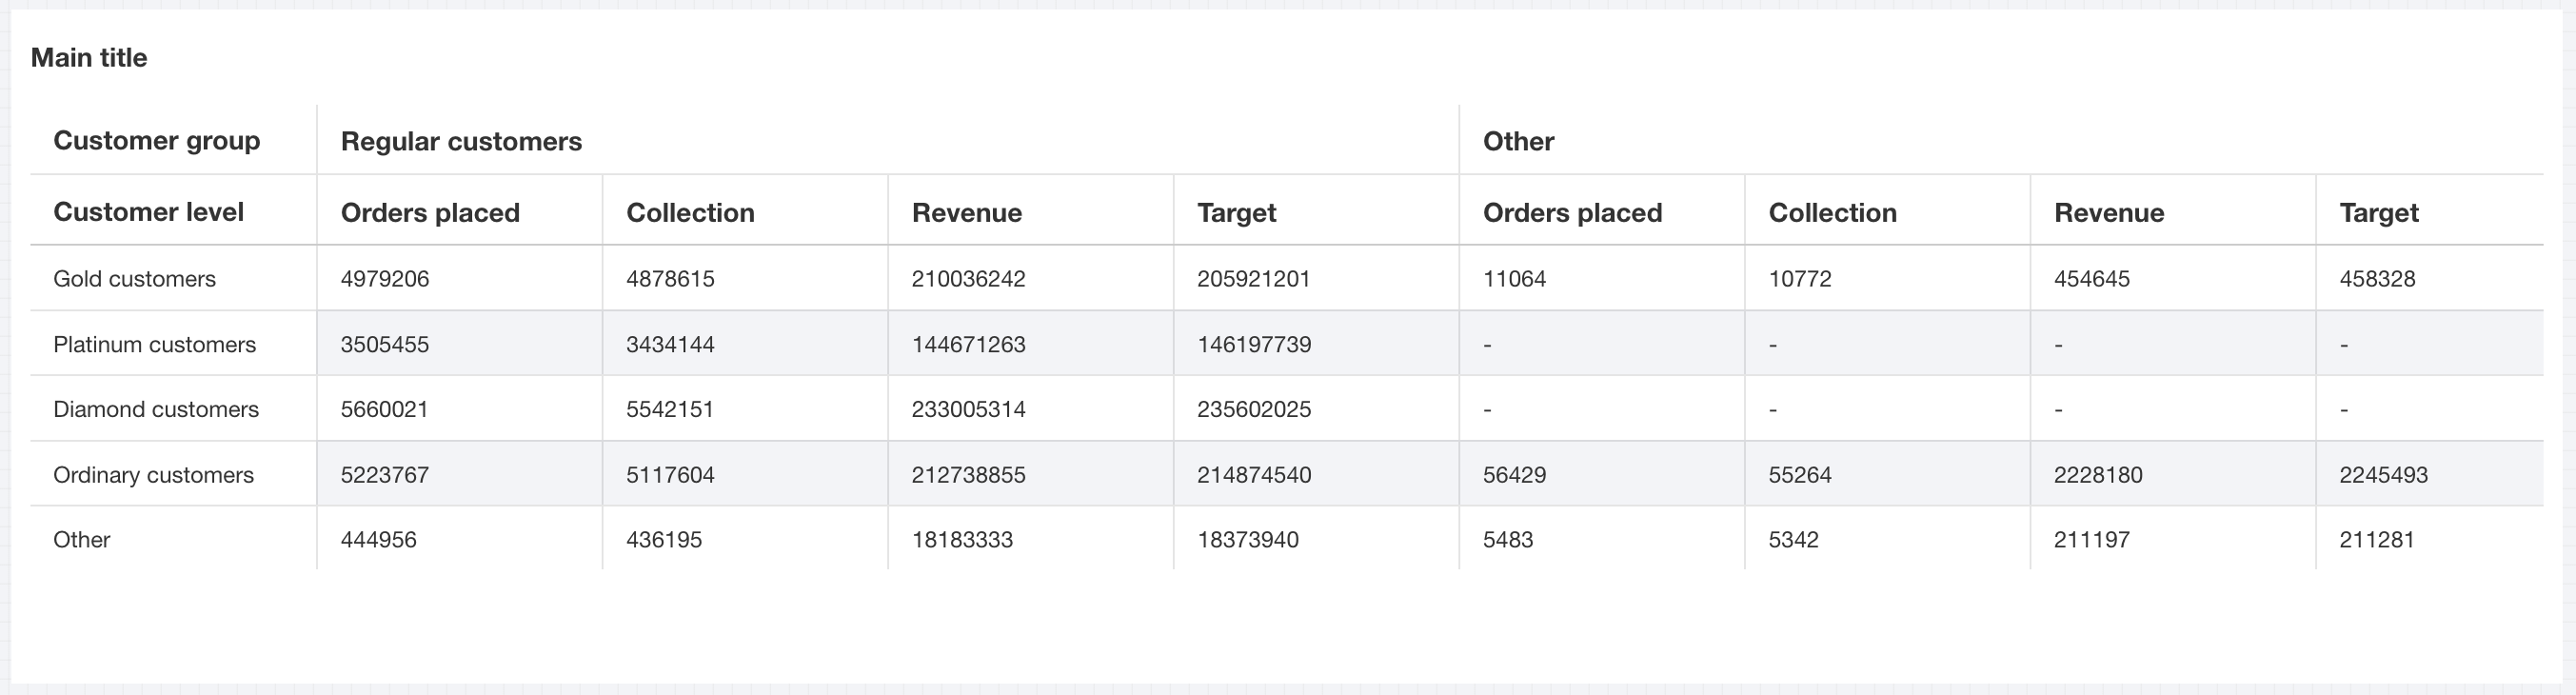
A crosstab is a report that supports grouping in row and column orientation. Unlike ordinary reports, it has row and column dimensions, and metrics can be displayed as rows or columns. The intersection of rows and columns represents the metric data result. It supports multiple forms of aggregation for rows or columns.
The condition area allows filtering data by dragging and dropping time, character, and numeric value fields.
The immediate analysis button can trigger the data update display of the chart. Meanwhile, you can set the maximum display of XX results (0-10000) on the right.
Component Style Setting
Crosstab supports the following style settings:
Setting Item
Set a Category
Setup Instructions
Title
Display
Enable/Disable Display Chart Title
Main Title
Set Chart Main Title
horizontal position
Set the horizontal position of the title display, such as left, center, or right.
Alignment Mode
left/center/right
Set the text alignment direction in the table, available options: left/center/right
Advanced Feature Settings
Enable total
Enable total in spreadsheet
Wrap header text
When the header text is relatively long, enable wrap header text for line breaks.
Freeze row and column settings
Select frozen column
Currently only support consecutive column freeze starting from the first column; any column freeze feature development in progress, stay tuned.
Numeric display
value type
Set the numeric display type and choose from three options: 1. Standard numerical value: for example, "1211" is displayed as "1211" 2. Percentage: for example, "0.11" is displayed as "11%" 3. Thousands separator: for example, "1211" is displayed as "1,211"
value unit
Set the measurement unit for numeric display and choose from the following options: 1. None 2. Ten thousand: for example, "121112" is displayed as 12.111, analogous for other units 3. Million 4. Ten million 5. Hundred million 6. One billion 7. Billions of
decimal places retained
Set the number of decimal places for numeric values. For example, "1211.2334" with 2 decimal places retained will display as "1211.23".
Table
Tables are mainly used for metric summaries based on dimension fields in statistical tables, and merge aggregation statistics for the same type of data. As shown in the figure below, it displays sales data statistics for products under different categories.
Query Condition Settings
Dimension & metric count requirements: dimension + metric ≥ 1. Conditional filtering can be performed by dragging and dropping time, character, or numeric value fields in the condition section. Click the immediate analysis button to trigger chart data update display, and set the maximum display of XX results (0-10000) on the right.
Component Style Setting
Spreadsheet supports the following style settings:
Setting Item
Set a Category
Setup Instructions
Title
Display
Enable/Disable Display Chart Title
Main Title
Set Chart Main Title
horizontal position
Set the horizontal position of the title display, such as left, center, or right.
Alignment Mode
left/center/right
Set the text alignment direction in the table, available options: left/center/right
Advanced Feature Settings
Enable total
Enable total in spreadsheet
Wrap header text
When the header text is relatively long, enable wrap header text for line breaks.
Freeze row and column settings
Select frozen column
Currently only support consecutive column freeze starting from the first column; any column freeze feature development in progress, stay tuned.
Numeric display
value type
Set the numeric display type and choose from three options: 1. Standard numerical value: for example, "1211" is displayed as "1211" 2. Percentage: for example, "0.11" is displayed as "11%" 3. Thousands separator: for example, "1211" is displayed as "1,211"
value unit
Set the measurement unit for numeric display and choose from the following options: 1. None 2. Ten thousand: for example, "121112" is displayed as 12.111, analogous for other units 3. Million 4. Ten million 5. Hundred million 6. One billion 7. Billions of
decimal places retained
Set the number of decimal places for numeric values. For example, "1211.2334" with 2 decimal places retained will display as "1211.23".
Details table
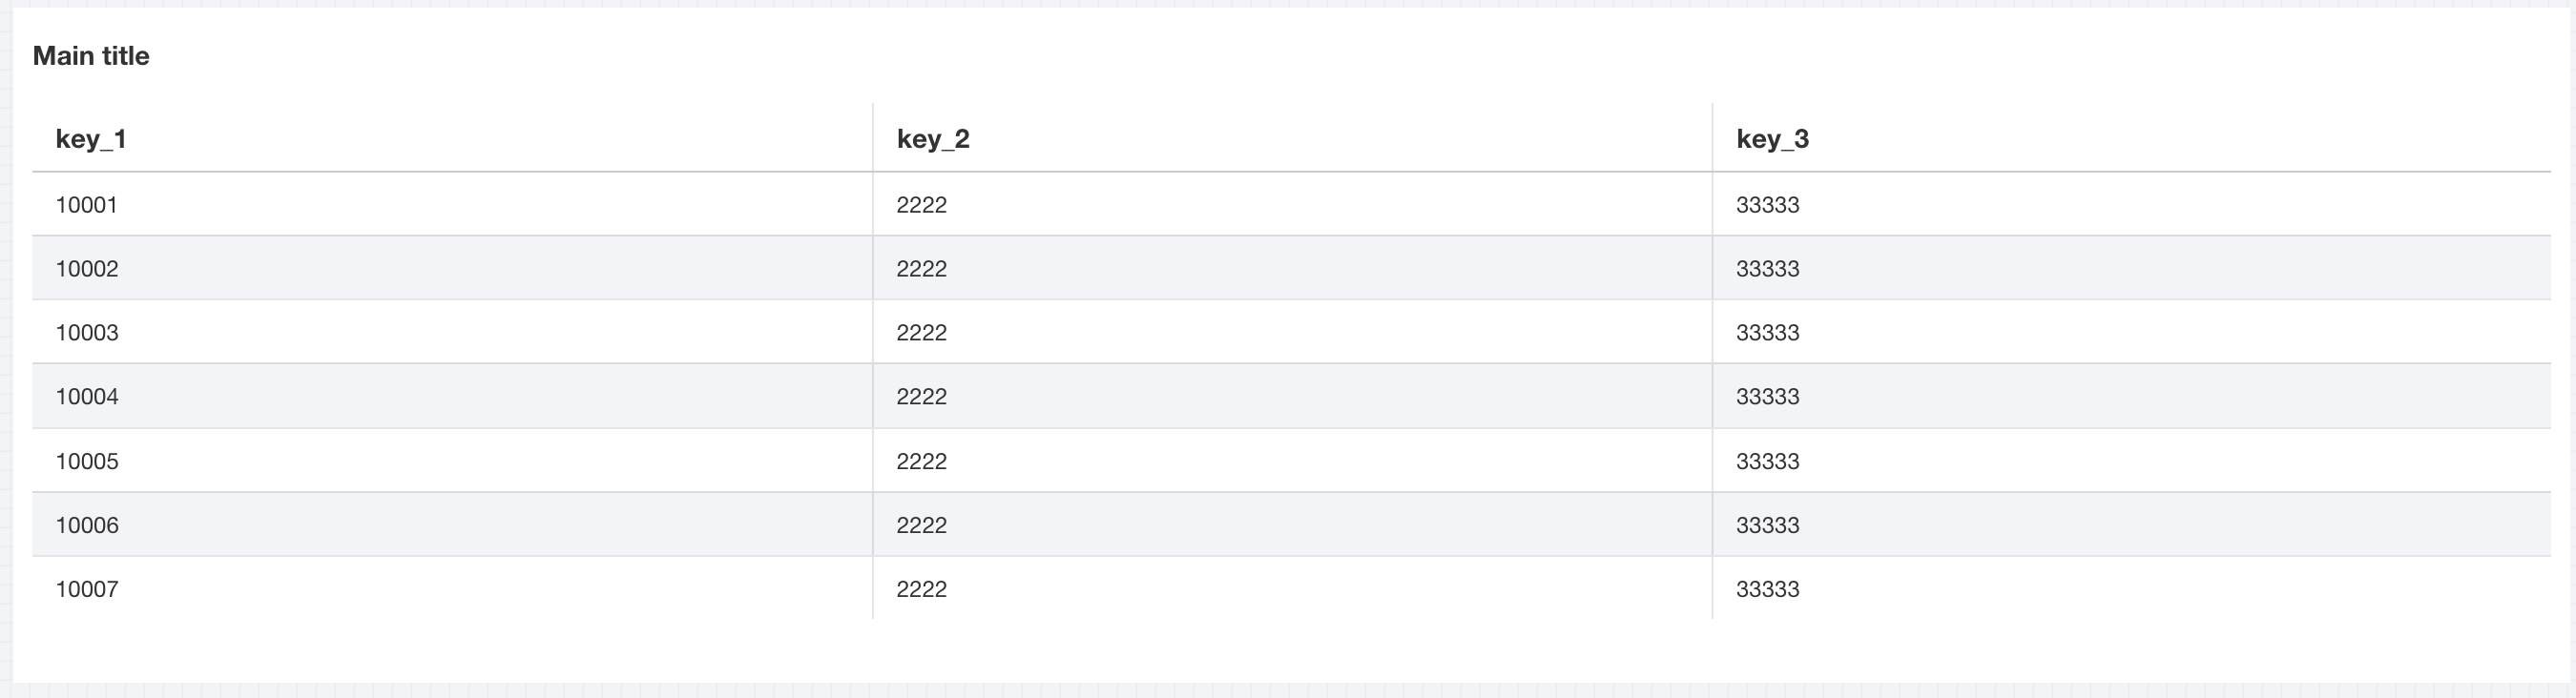
The details table is mainly used to show detail fields and data content. As shown in the figure below, it displays the sales detail sheet data.
Query Condition Settings
Dimension & metric count requirements: data column ≥ 1. The condition area allows conditional filtering of data by dragging and dropping time, character, or numeric value fields. The immediate analysis button can trigger chart data updates for display, while the maximum display of XX results (0-10000) can be set on the right.
Component Style Setting
The detailed table supports the following style settings:
Setting Item
Set a Category
Setup Instructions
Title
Display
Enable/Disable Display Chart Title
Main Title
Set Chart Main Title
horizontal position
Set the horizontal position of the title display, such as left, center, or right.
Alignment Mode
left/center/right
Set the text alignment direction in the table, available options: left/center/right
Advanced Feature Settings
Enable total
Enable total in spreadsheet
Wrap header text
When the header text is relatively long, enable wrap header text for line breaks.
Freeze row and column settings
Select frozen column
Currently only support consecutive column freeze starting from the first column; any column freeze feature development in progress, stay tuned.
Numeric display
value type
Set the numeric display type and choose from three options: 1. Standard numerical value: for example, "1211" is displayed as "1211" 2. Percentage: for example, "0.11" is displayed as "11%" 3. Thousands separator: for example, "1211" is displayed as "1,211"
value unit
Set the measurement unit for numeric display and choose from the following options: 1. None 2. Ten thousand: for example, "121112" is displayed as 12.111, analogous for other units 3. Million 4. Ten million 5. Hundred million 6. One billion 7. Billions of
decimal places retained
Set the number of decimal places for numeric values. For example, "1211.2334" with 2 decimal places retained will display as "1211.23".