地图类图表
下载
聚焦模式
字号
腾讯云 BI 产品的地图类图表包括气泡地图、色彩地图、点地图,主要用于通过地图展示指标的数据大小和分布范围,并支持 GIS 地图的能力。
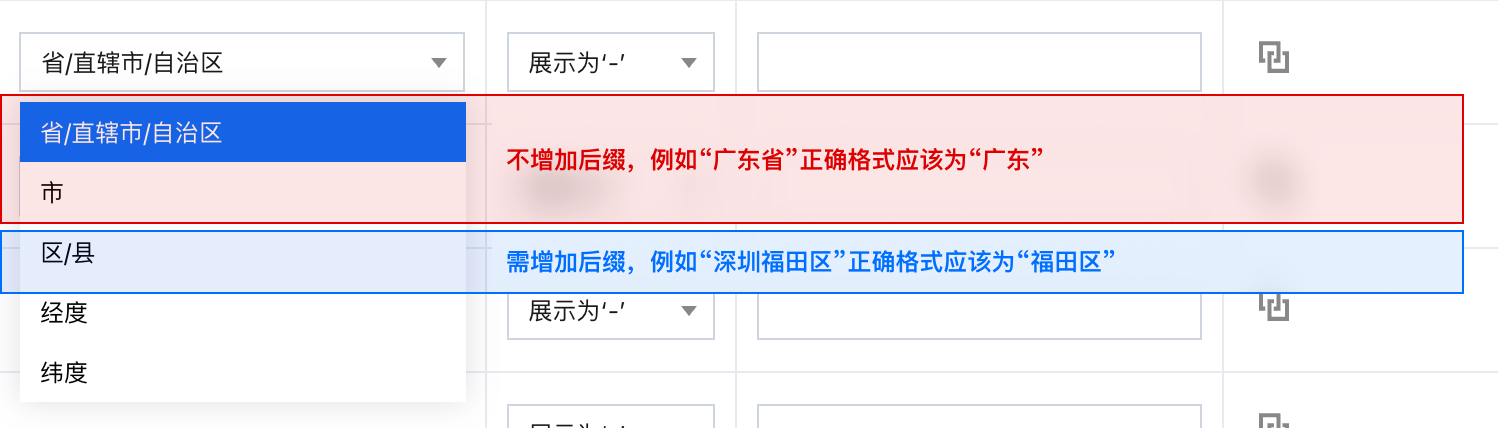
说明:配置地图类图表时,需先在编辑数据表页面内将地理信息字段的字段类型切换为地理字段,其中省/直辖市/自治区/市不需要添加省、直辖市、自治区、市等后缀, 区/县级的行政区划需要对应完整地区名称。
气泡地图
气泡地图主要用于通过横向展示方式来比较数据间的大小以及各项之间的差距,如下图展示的是各个省份的城市数量。
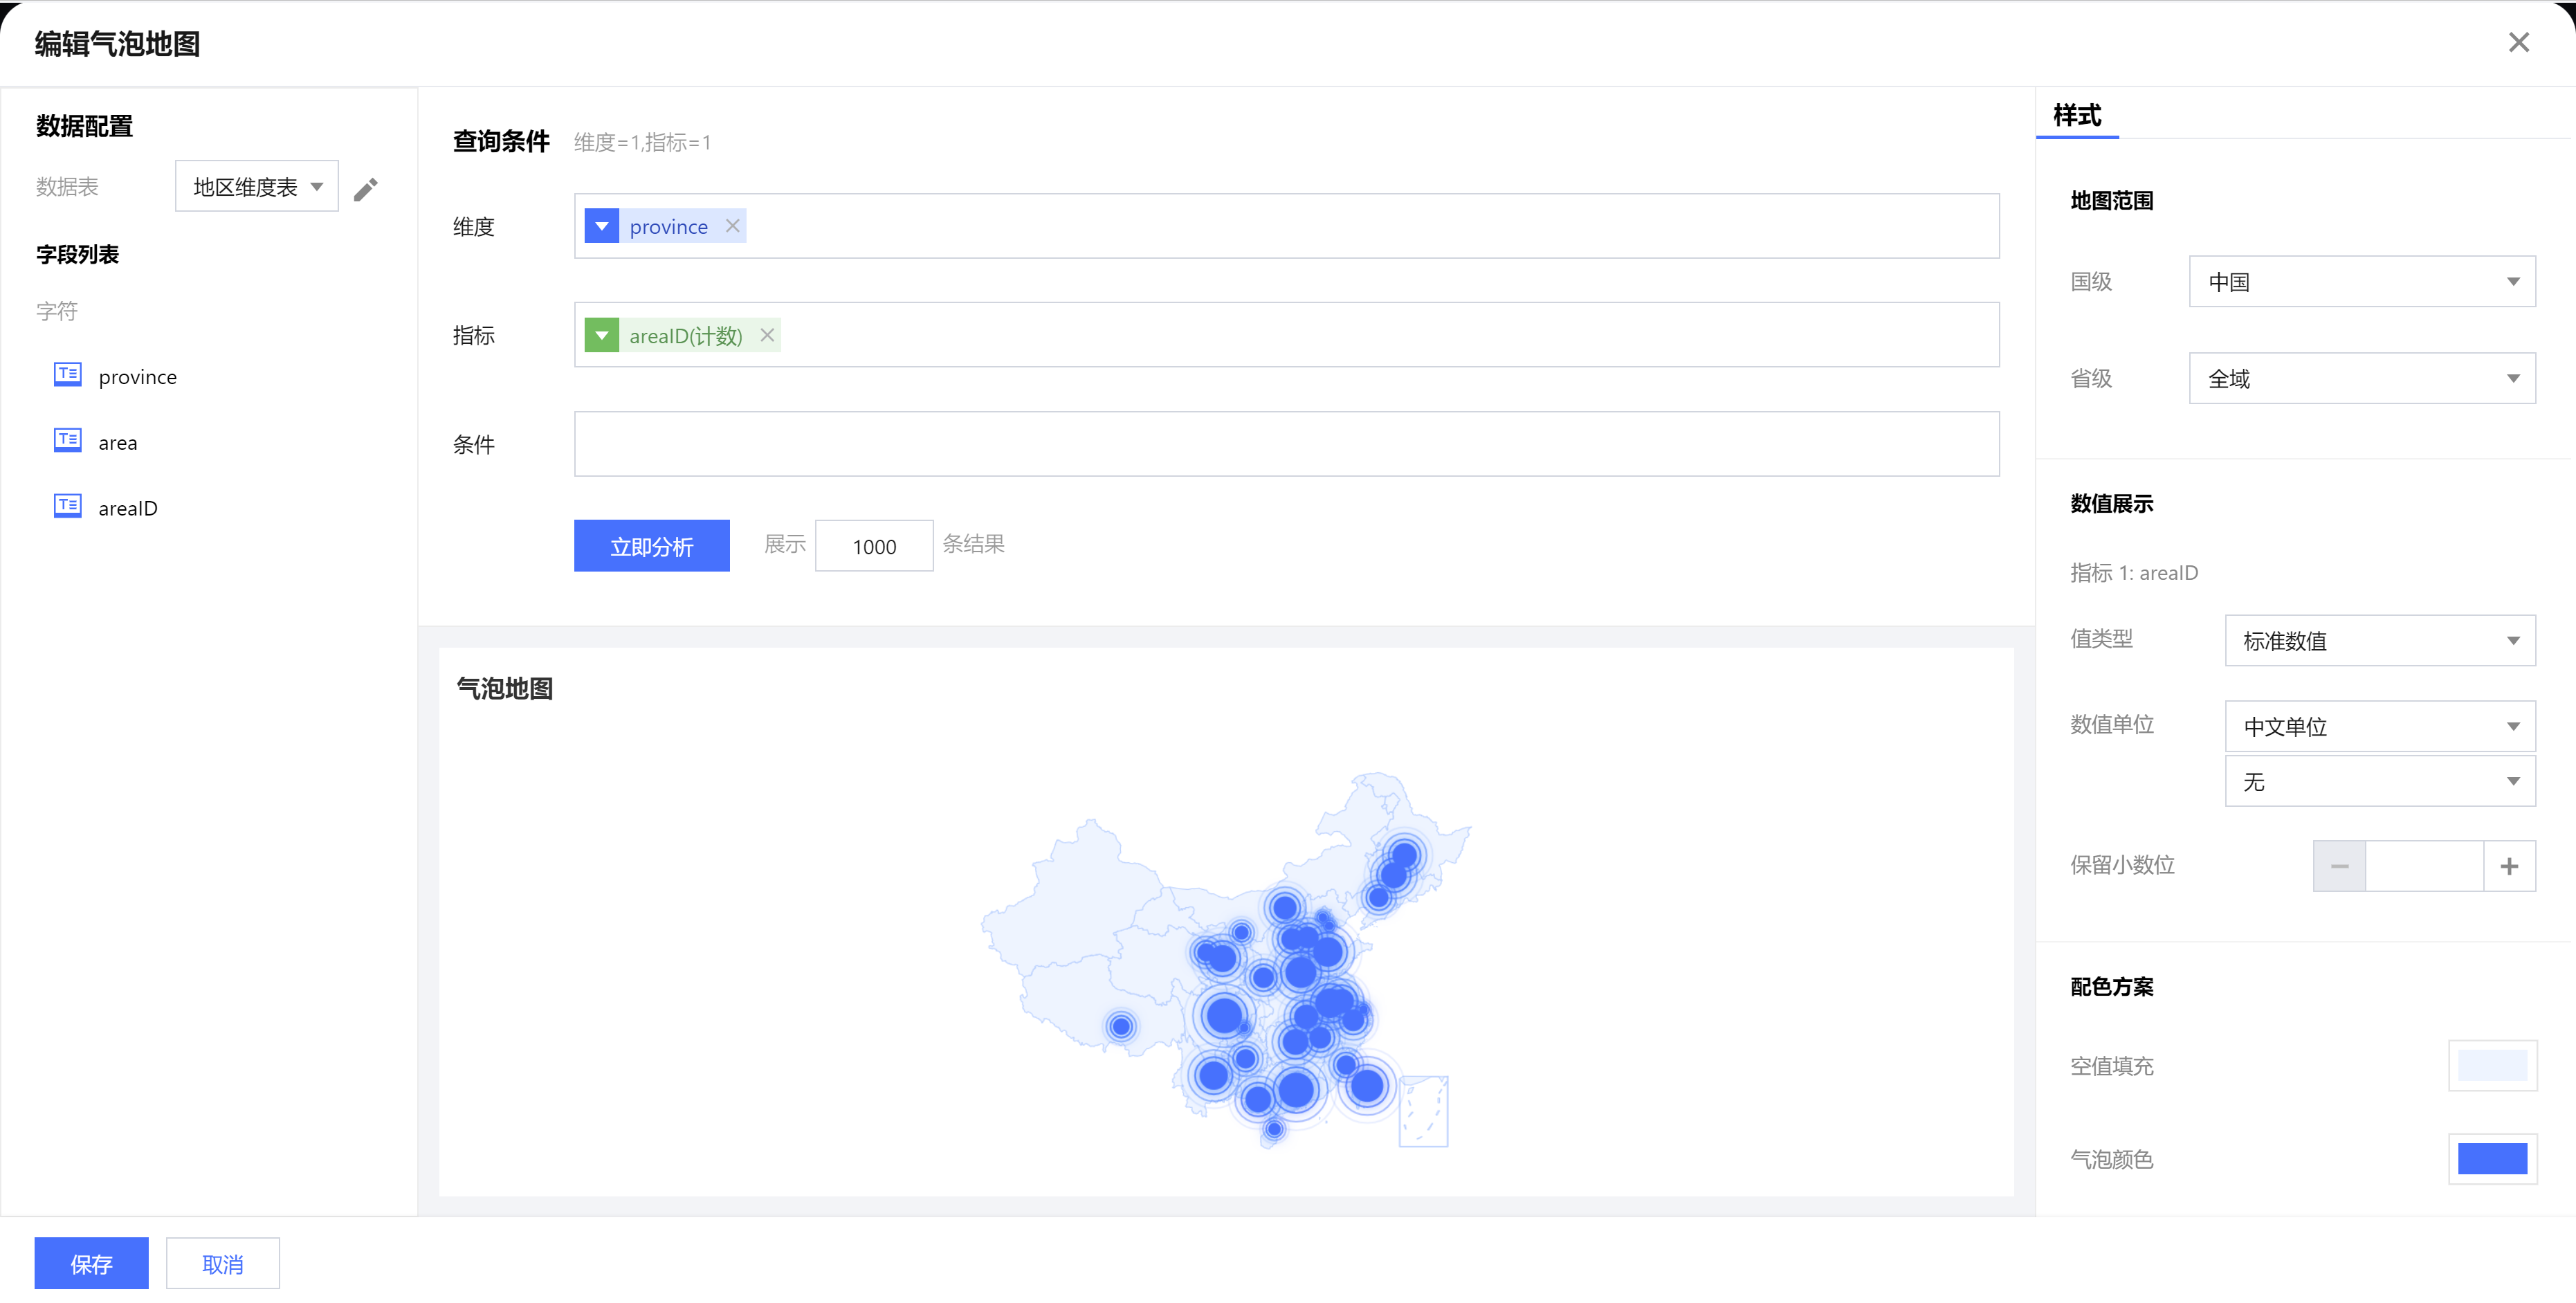
查询条件设置
维度&指标个数要求:维度=1个,指标=1个。
条件区域可通过拖拽时间、字符、数值类字段进行对数据的条件筛选过滤。
立即分析按钮可以触发图表的数据更新显示,同时可在右侧设置最大展示XX条结果(0-10000)。
组件样式设置
气泡地图支持以下样式设置:
设置分类 | 设置项 | 设置说明 |
地图范围 | 国级 | 选择地图的国级区域 |
| 省级 | 1. 选择全域,设置地图范围为所选国家的全国区域; 2. 选择地图的省级区域; |
| 市级 | 1. 仅当“省级”选择了某一省级区域,该字段显示; 2. 选择全域,设置地图范围为所选省份的全省区域; 3. 选择地图的市级区域; |
数值展示 | 值类型 | 设置数值展示的类型,提供三种类型供选择: 1. 标准数值:如“1211”,展示为“1211” 2. 百分比:如“0.11”,展示“11%” 3. 千分位:如“1211”,展示为“1,211” |
| 数值单位 | 设置数值展示的单位,提供以下单位供选择: 1. 无 2. 万:如“121112”,展示为12.1112万,以下单位类推 3. 百万 4. 千万 5. 亿 6. 十亿 7. 百亿 |
| 保留小数位 | 设置数值小数位的位数,如“1211.2334”,设置保留小数位为“2”,则展示“1211.23” |
配色方案 | 空值填充 | 设置地图中,数值为空的区域填充颜色 |
| 气泡颜色 | 设置地图中,存在数值的区域,显示气泡的颜色 |
| 悬停颜色 | 设置地图中各区域,鼠标悬停时的填充颜色 |
| 边界颜色 | 设置地图中各区域边界线颜色 |
| 标签颜色 | 设置地图中标签的字体颜色 |
标题 | 显示 | 开启/关闭显示图表标题 |
| 主标题 | 设置图表的主标题 |
| 水平位置 | 设置标题展示的水平方向位置,如居中,则选择“中” |
| 垂直位置 | 设置标题展示的垂直方向位置,如希望标题展示在下面,则选择“下” |
标签 | 显示 | 开启/关闭显示图表标签 |
| 地名 | 设置标签中是否显示地名,一般开启显示标签,会同时开启地名显示 |
| 数值 | 设置标签中是否显示数值,一般开启显示标签,会同时开启地名显示 |
色彩地图
色彩地图主要用于通过色彩的深浅来展示数据的大小和分布范围,如下图展示的是各个省份的城市数量。
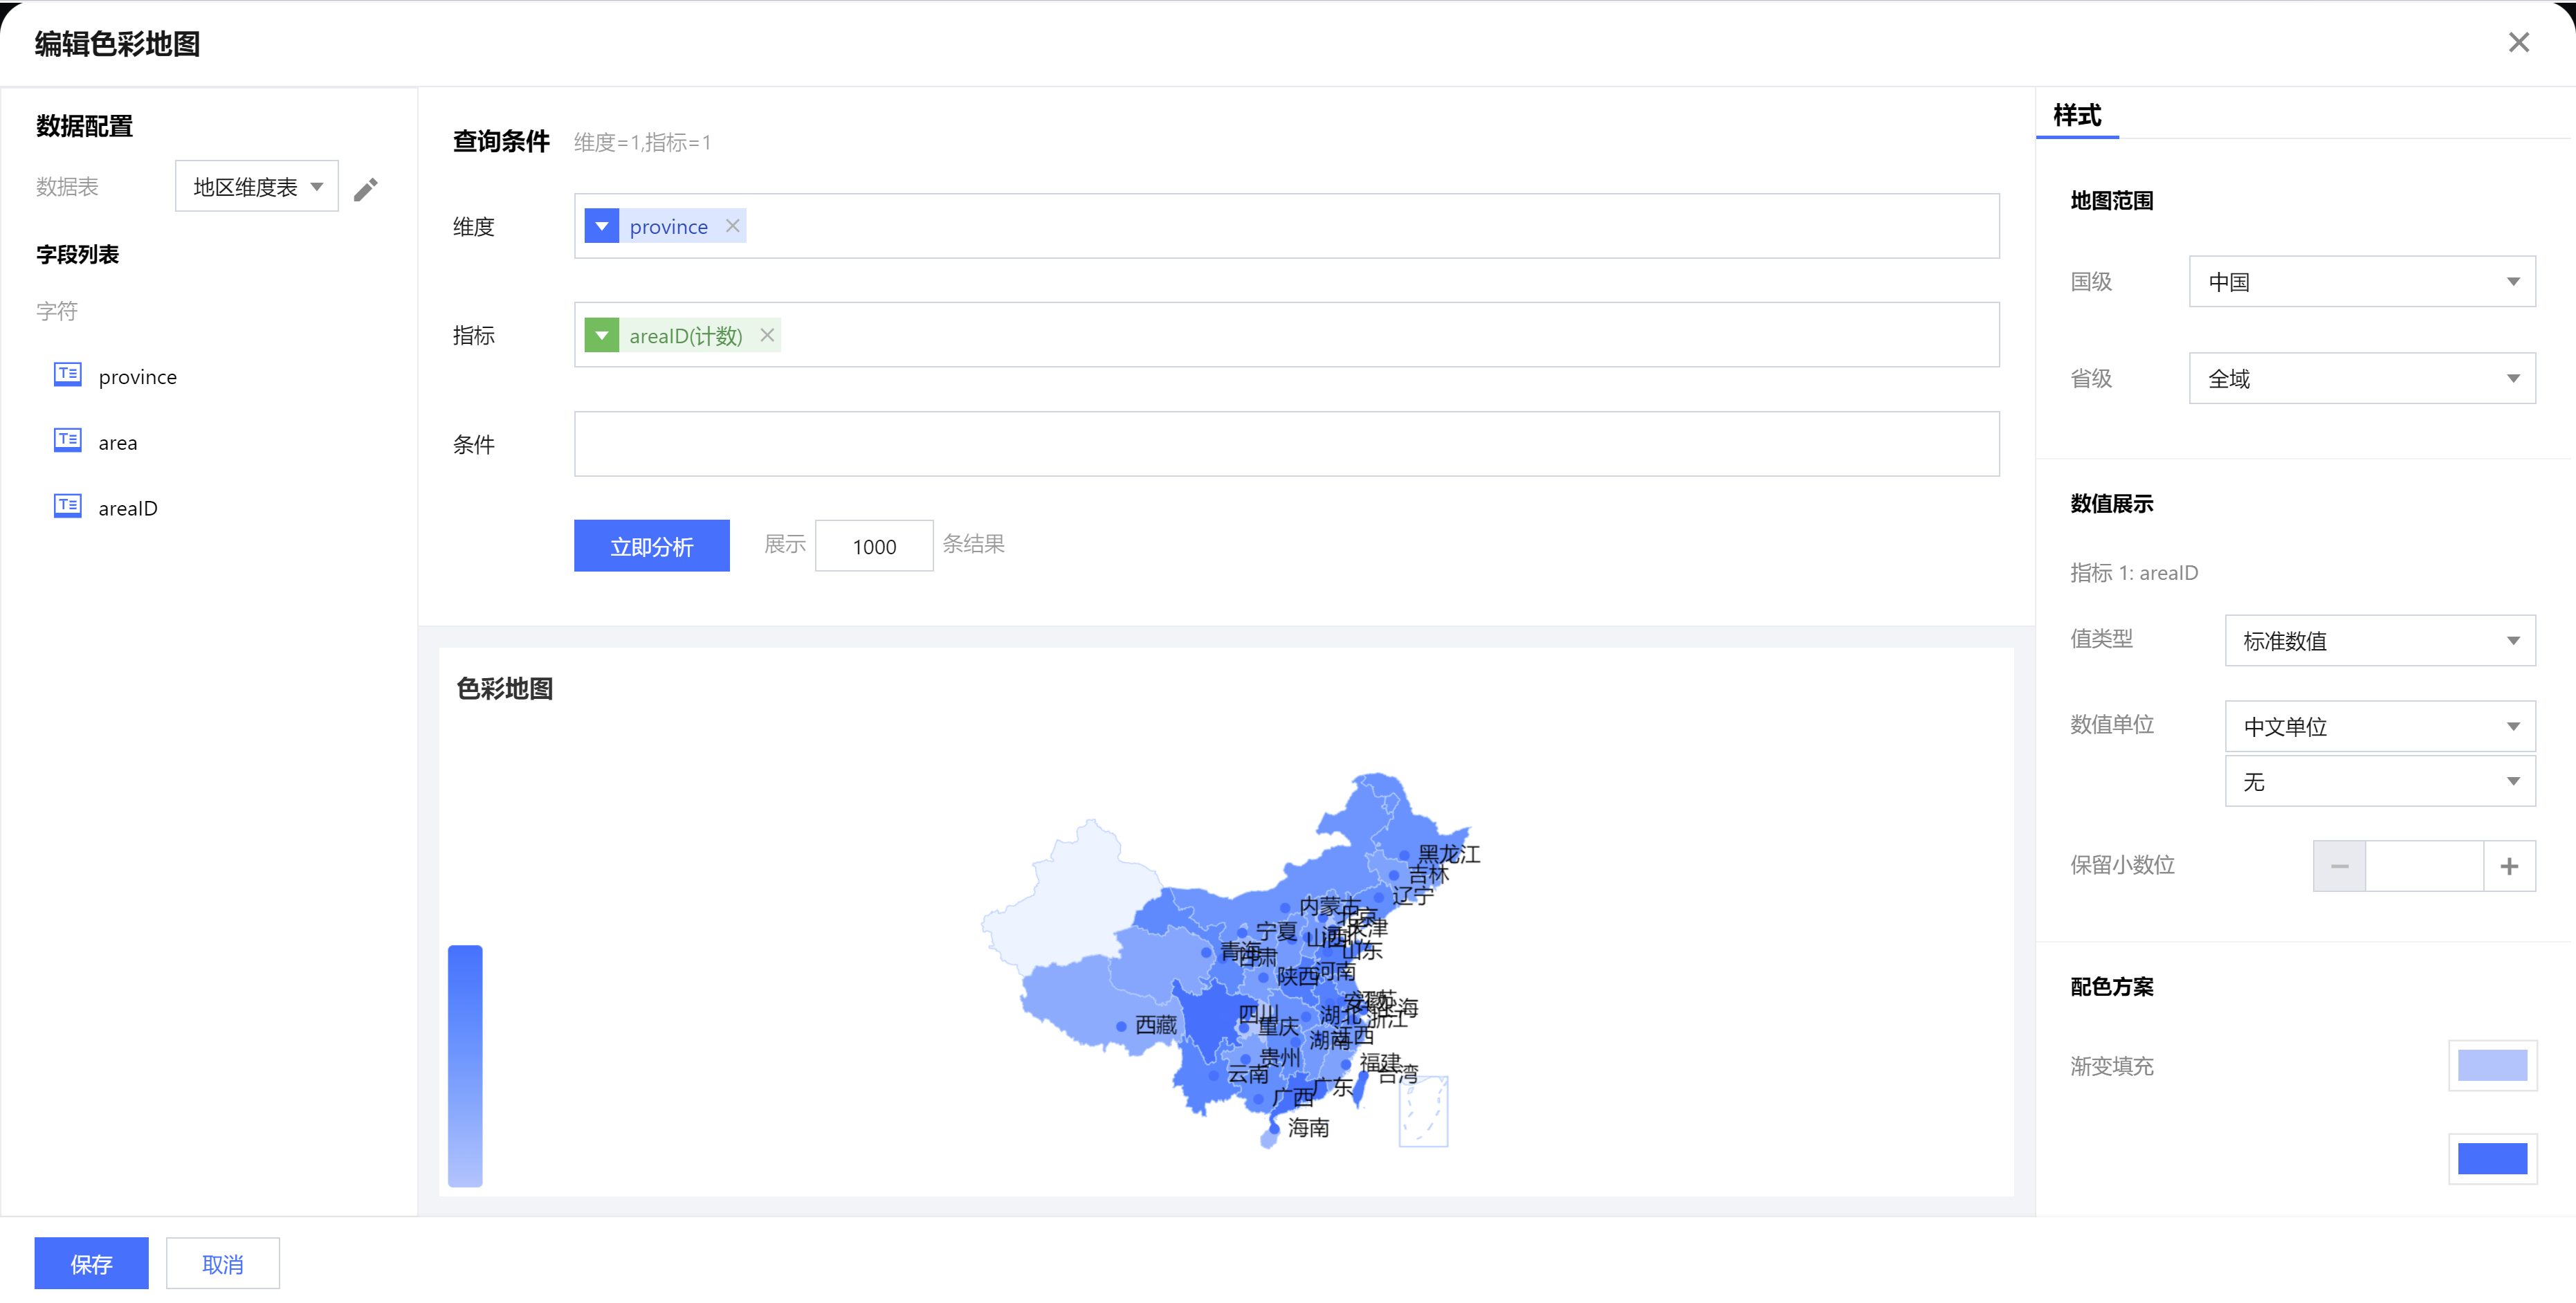
查询条件设置
维度&指标个数要求:维度=1个,指标=1个。
条件区域可通过拖拽时间、字符、数值类字段进行对数据的条件筛选过滤。
立即分析按钮可以触发图表的数据更新显示,同时可在右侧设置最大展示XX条结果(0-10000)。
组件样式设置
色彩地图支持以下样式设置:
设置分类 | 设置项 | 设置说明 |
地图范围 | 国级 | 选择地图的国级区域 |
| 省级 | 1. 选择全域,设置地图范围为所选国家的全国区域; 2. 选择地图的省级区域; |
| 市级 | 1. 仅当“省级”选择了某一省级区域,该字段显示; 2. 选择全域,设置地图范围为所选省份的全省区域; 3. 选择地图的市级区域; |
数值展示 | 值类型 | 设置数值展示的类型,提供三种类型供选择: 1. 标准数值:如“1211”,展示为“1211” 2. 百分比:如“0.11”,展示“11%” 3. 千分位:如“1211”,展示为“1,211” |
| 数值单位 | 设置数值展示的单位,提供以下单位供选择: 1. 无 2. 万:如“121112”,展示为12.1112万,以下单位类推 3. 百万 4. 千万 5. 亿 6. 十亿 7. 百亿 |
| 保留小数位 | 设置数值小数位的位数,如“1211.2334”,设置保留小数位为“2”,则展示“1211.23” |
配色方案 | 渐变填充 | 设置地图中,按照数值大小渐变显示的两个颜色 |
| 空值填充 | 设置地图中,数值为空的区域填充颜色 |
| 悬停颜色 | 设置地图中各区域,鼠标悬停时的填充颜色 |
| 边界颜色 | 设置地图中各区域边界线颜色 |
| 标签颜色 | 设置地图中标签的字体颜色 |
标题 | 显示 | 开启/关闭显示图表标题 |
| 主标题 | 设置图表的主标题 |
| 水平位置 | 设置标题展示的水平方向位置,如居中,则选择“中” |
| 垂直位置 | 设置标题展示的垂直方向位置,如希望标题展示在下面,则选择“下” |
标签 | 显示 | 开启/关闭显示图表标签 |
| 地名 | 设置标签中是否显示地名,一般开启显示标签,会同时开启地名显示 |
| 数值 | 设置标签中是否显示数值,一般开启显示标签,会同时开启地名显示 |
点地图
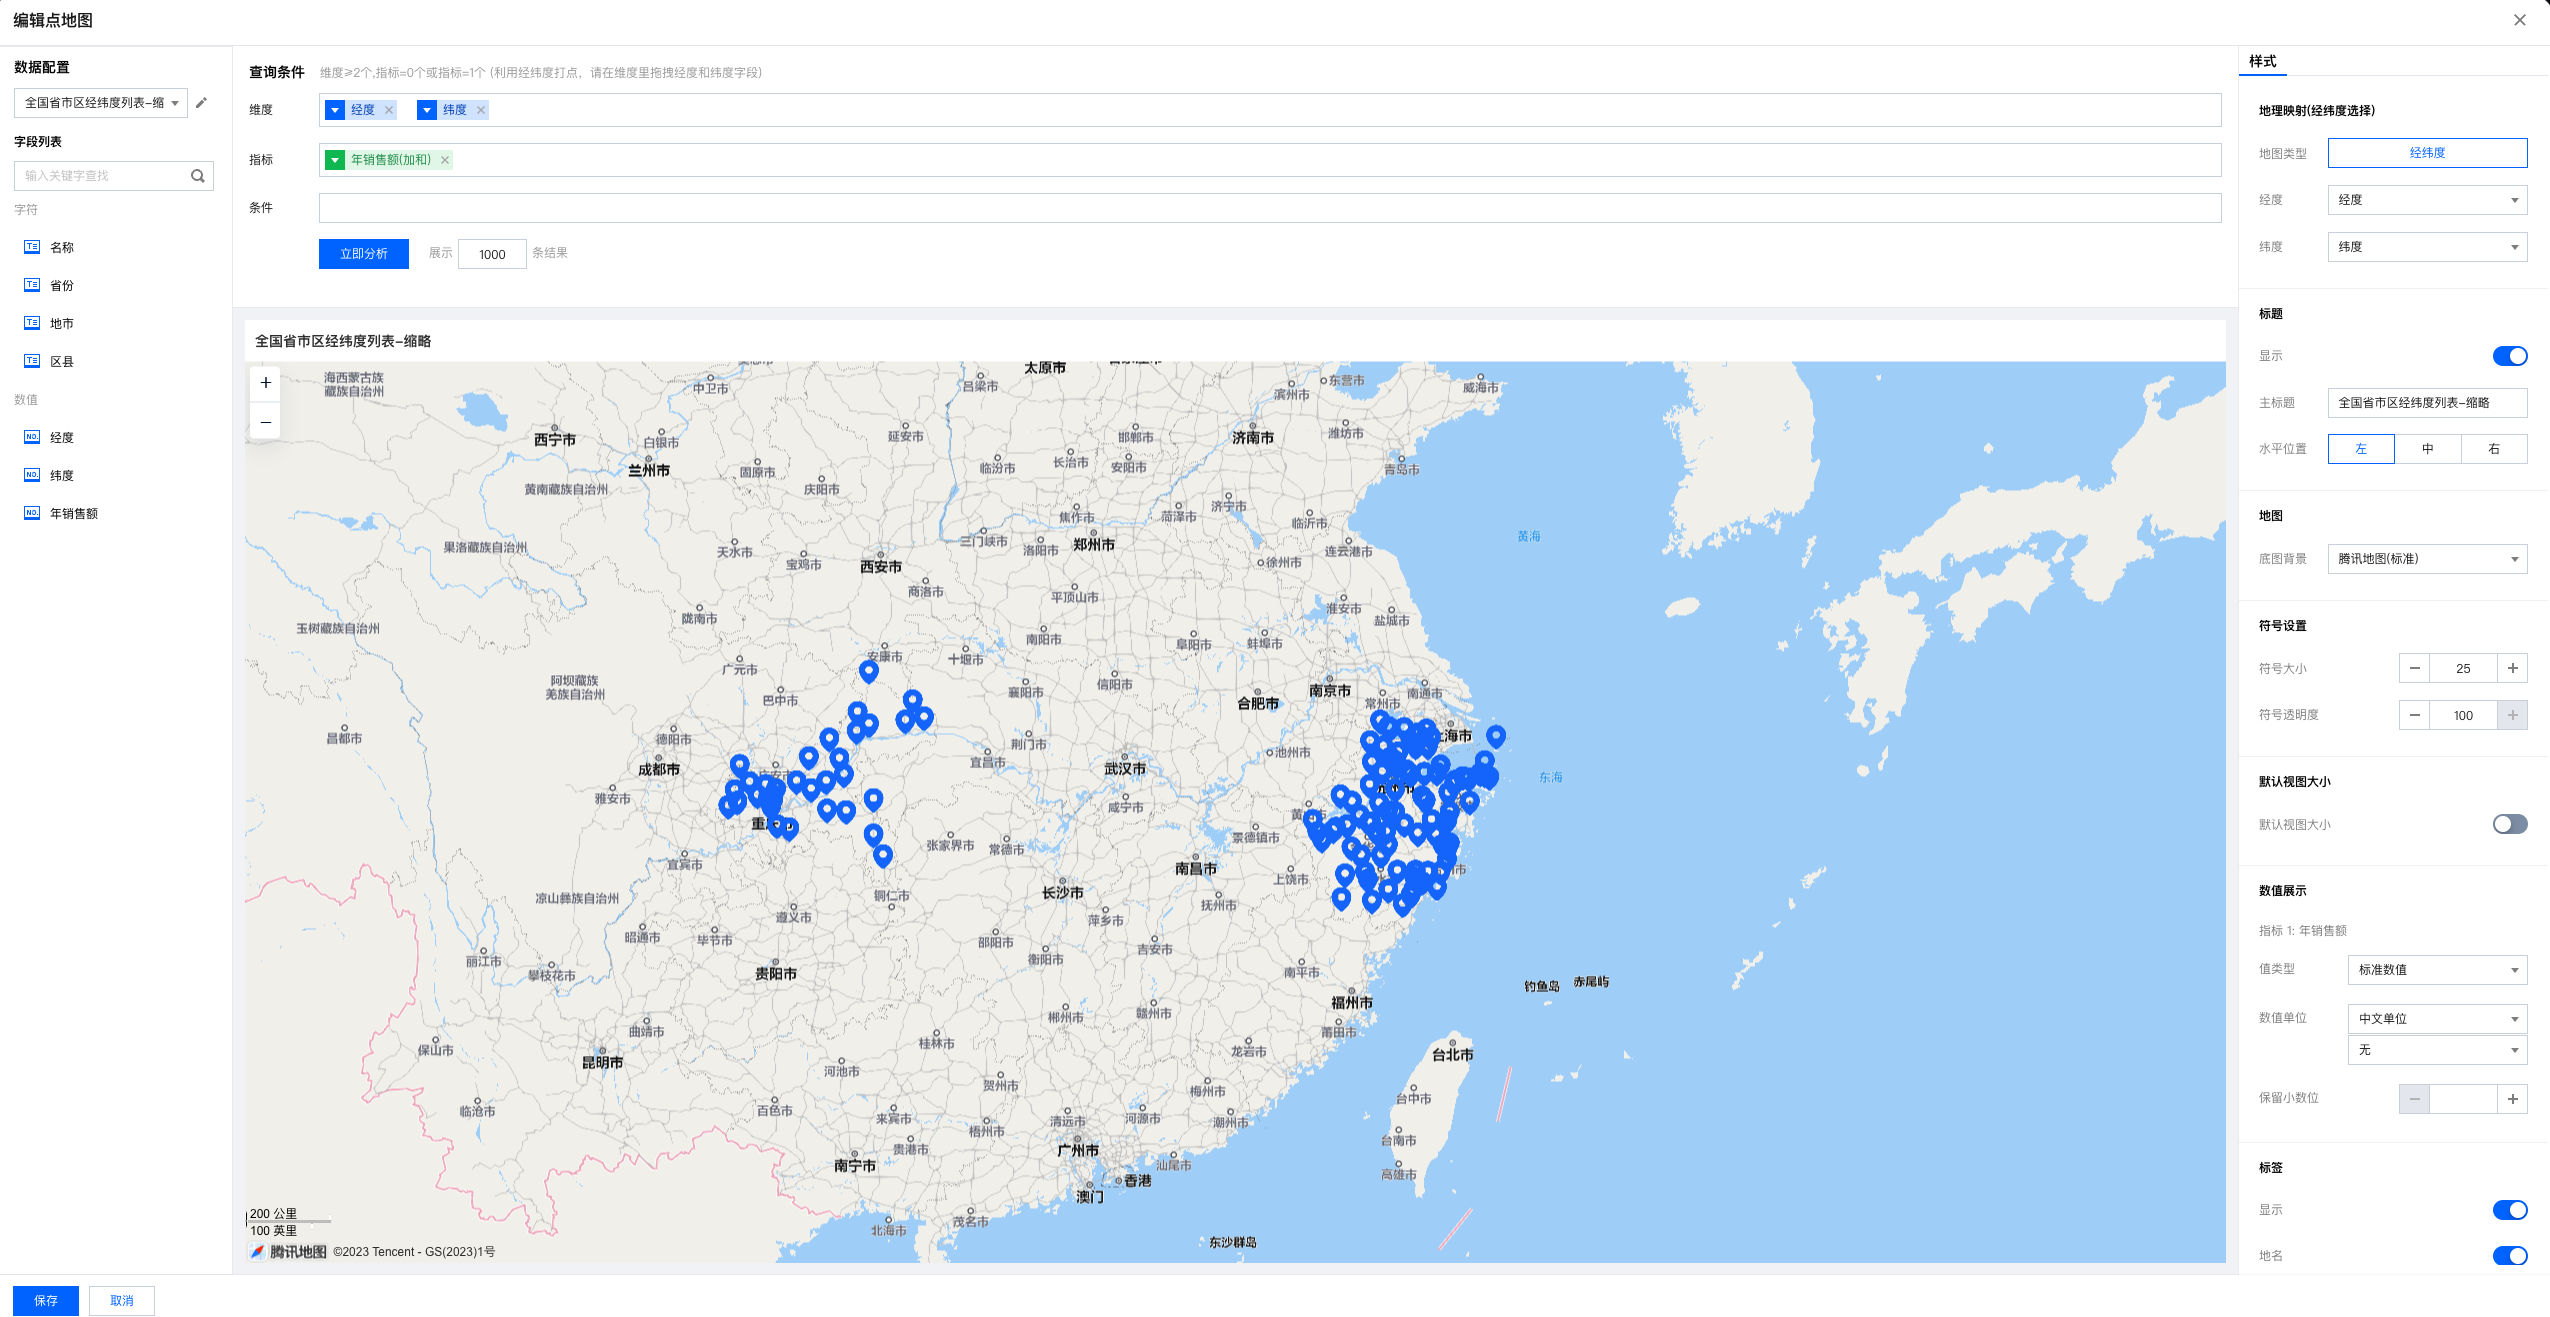
点地图主要用于通过 GIS 地图标点来展示地图所处位置的情况,如下图展示的是基于经纬度展示地理点位。
数据准备
需要在地图上进行打点,需要提供经纬度等数据。
查询条件设置
维度&指标个数要求:维度 ≥ 2个,指标 = 0个或指标 = 1个,用经纬度打点,必须将经度和维度对应字段拖拽到维度内。
条件区域可通过拖拽时间、字符、数值类字段进行对数据的条件筛选过滤。
立即分析按钮可以触发图表的数据更新显示,同时可在右侧设置最大展示XX条结果(0-10000)。
组件样式设置
地图支持以下样式设置:
设置分类 | 设置项 | 设置说明 |
地理映射 | 经度 | 选择数据表里的经度字段,用于地图打点 |
| 纬度 | 选择数据表里的维度字段,用于地图打点 |
标题 | 显示 | 开启/关闭显示图表标题 |
| 主标题 | 设置图表的主标题 |
| 水平位置 | 设置标题展示的水平方向位置,如居中,则选择“中” |
地图 | 底图背景 | 用于切换3种腾讯地图底图效果,包括腾讯地图(标准)、腾讯地图(暗色)和腾讯地图(亮色) |
符号设置 | 符号大小 | 调整符号大小 |
| 符号透明度 | 调整符号透明度 |
默认视图大小 | 默认视图大小 | 开启/关闭视图对应位置大小 |
| 国级 | 选择地图的国级区域,目前只支持中国 |
| 省级 | 1. 选择全域,设置地图范围为所选国家的全国区域; 2. 选择地图的省级区域; |
| 市级 | 1. 仅当“省级”选择了某一省级区域,该字段显示; 2. 选择全域,设置地图范围为所选省份的全省区域; 3. 选择地图的市级区域; |
数值展示 | 值类型 | 设置数值展示的类型,提供三种类型供选择: 1. 标准数值:如“1211”,展示为“1211” 2. 百分比:如“0.11”,展示“11%” 3. 千分位:如“1211”,展示为“1,211” |
| 数值单位 | 设置数值展示的单位,提供以下单位供选择: 1. 无 2. 万:如“121112”,展示为12.1112万,以下单位类推 3. 百万 4. 千万 5. 亿 6. 十亿 7. 百亿 |
| 保留小数位 | 设置数值小数位的位数,如“1211.2334”,设置保留小数位为“2”,则展示“1211.23” |
标签 | 显示 | 开启/关闭显示图表标签 |
| 地名 | 设置标签中是否显示名称(和维度里除经纬度外的字段保持一致),一般开启显示标签,会同时开启地名显示 |
| 数值 | 设置标签中是否显示数值,一般开启显示标签,会同时开启地名显示 |
文档反馈