Performance Analysis
Download
Focus Mode
Font Size
After a report is created and accessed by users, Business Intelligence (BI) provides performance analysis capabilities to monitor metrics, including report query duration, the number of chart queries, and chart query time.
This document introduces the following operations:
Data overview.
Report performance.
Chart performance.
Viewing performance in the project.
Access path:
View all resources performance: Log in to BI console > Toolbox > Performance analysis.
View project resource performance: Log in to BI console > Project Management > Select a project > Performance analysis.
View chart performance in the canvas: Go to the page editor > hover over the chart > select Performance analysis in the toolbar.
Data Overview
The data overview provides an overall view of report visits and a daily breakdown of query durations by time range.
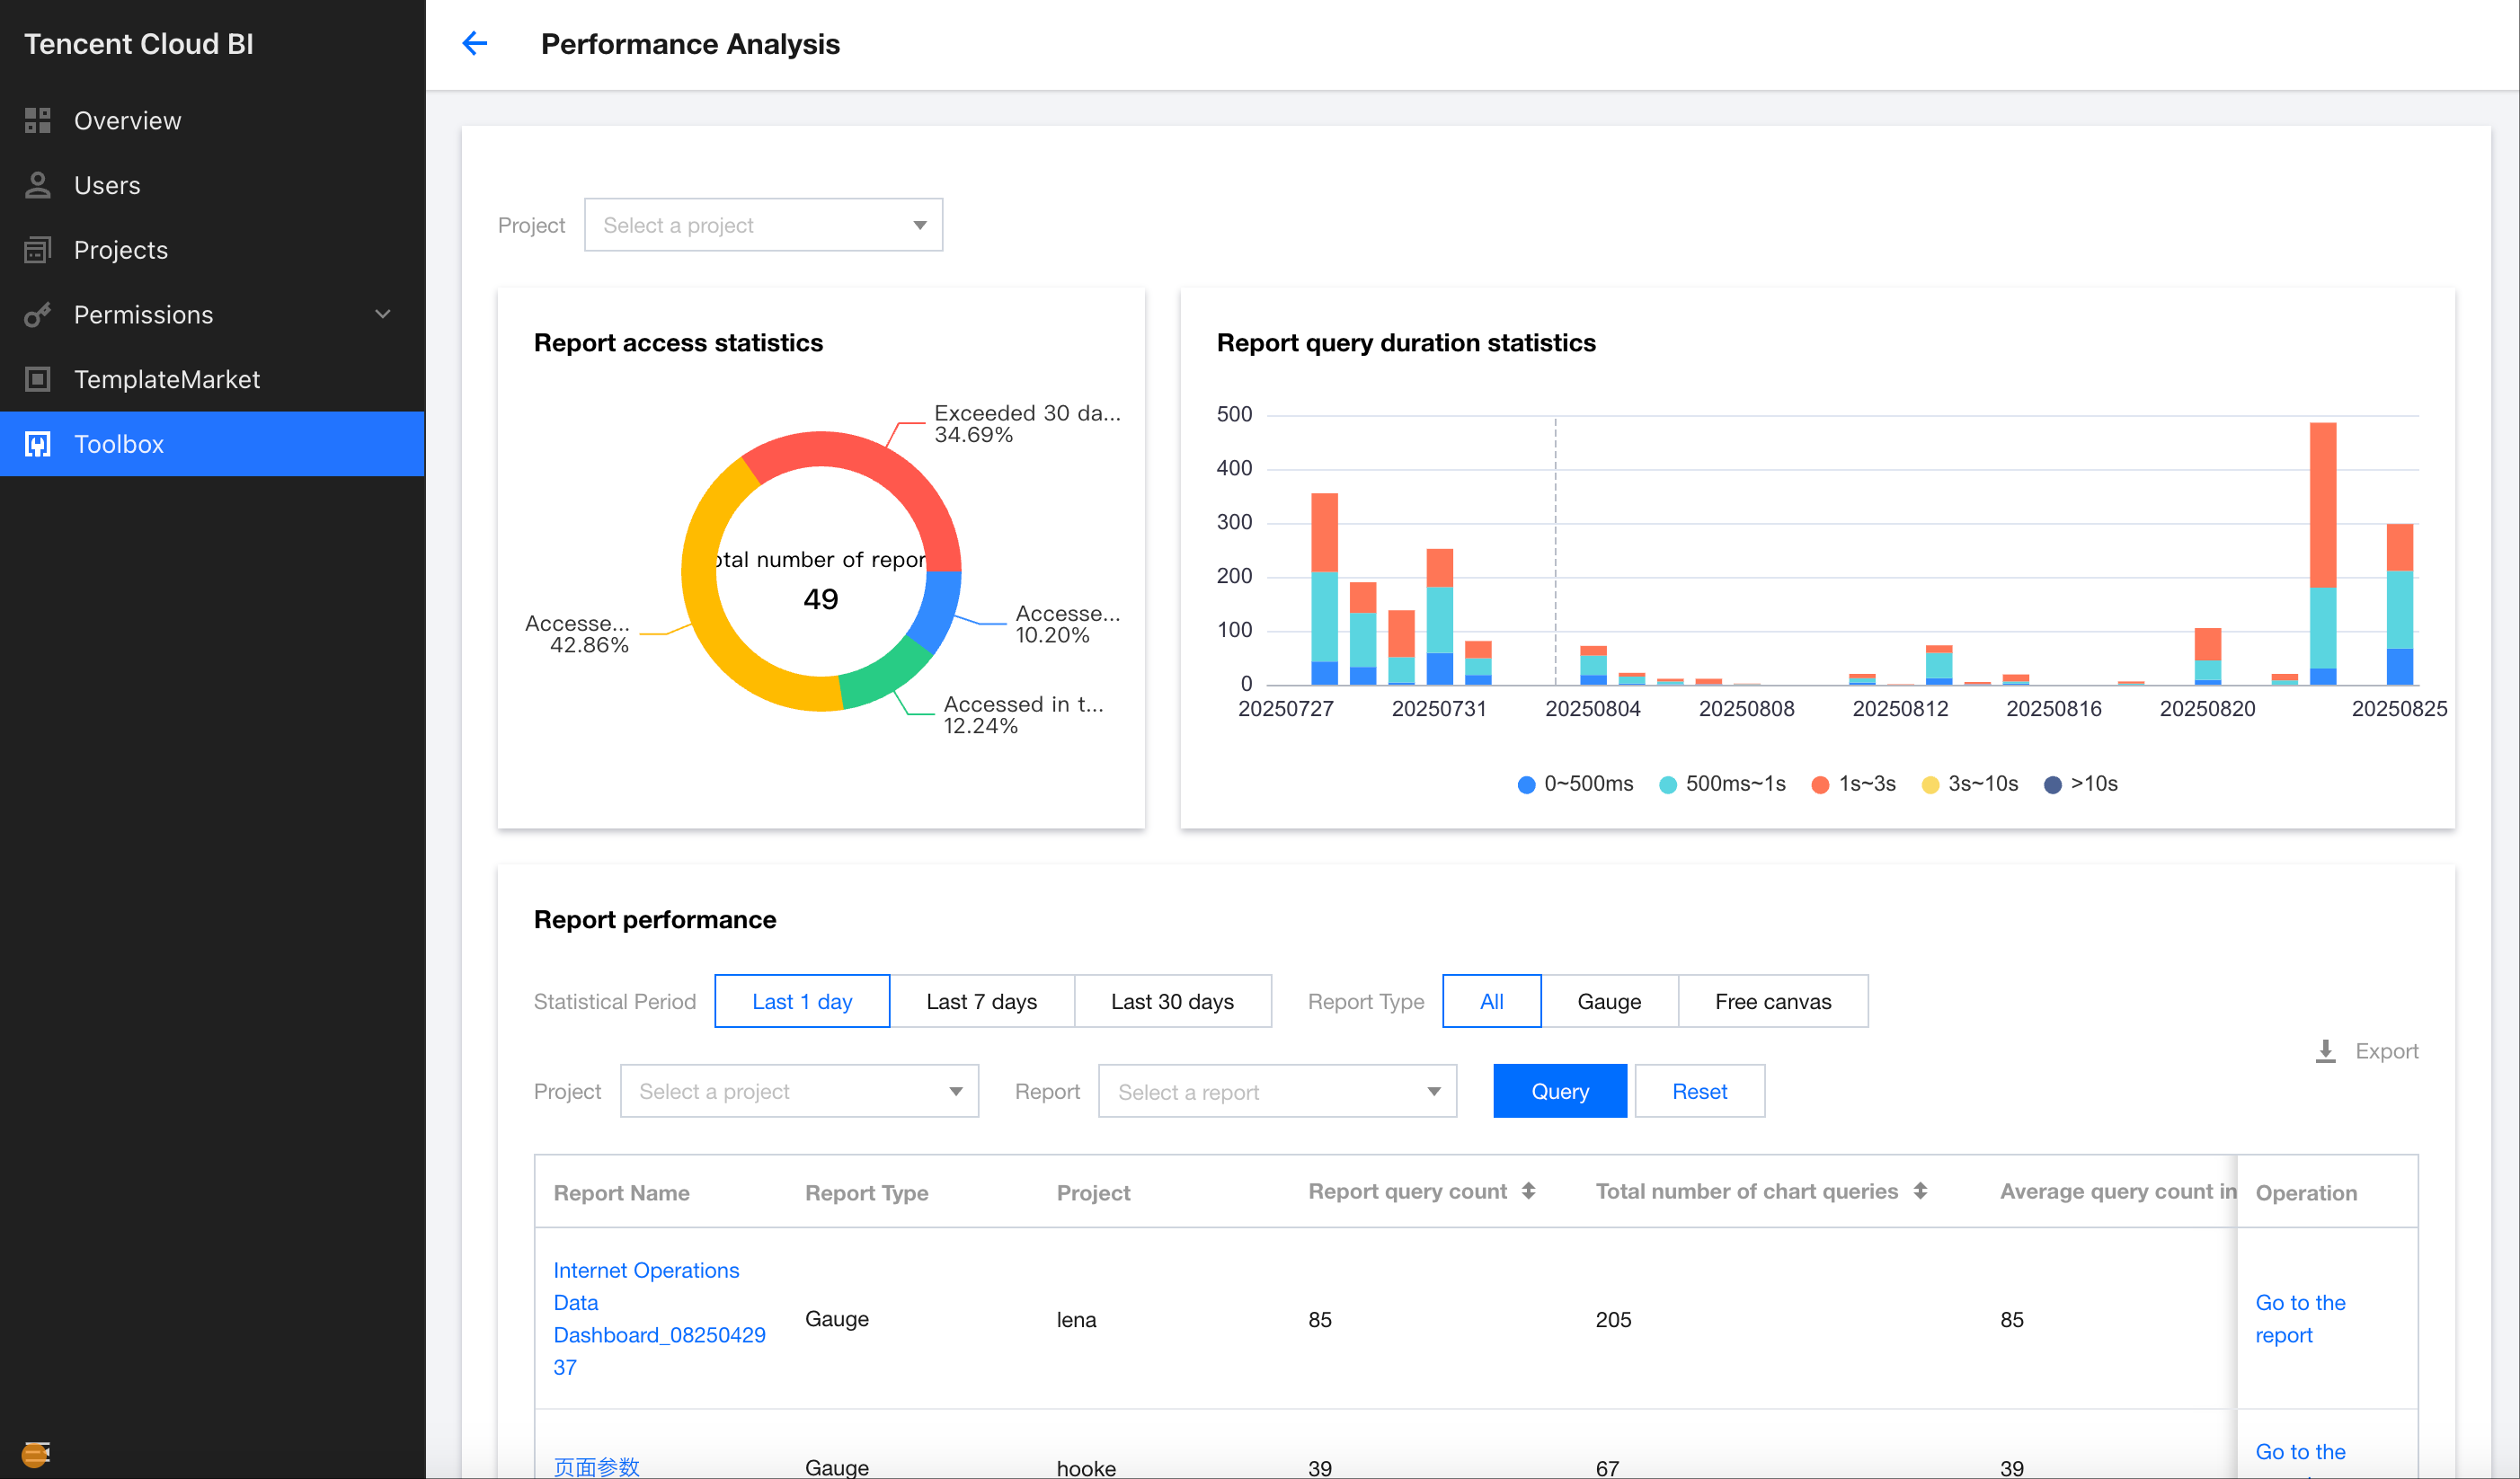
Report Performance
Support viewing performance based on report granularity.
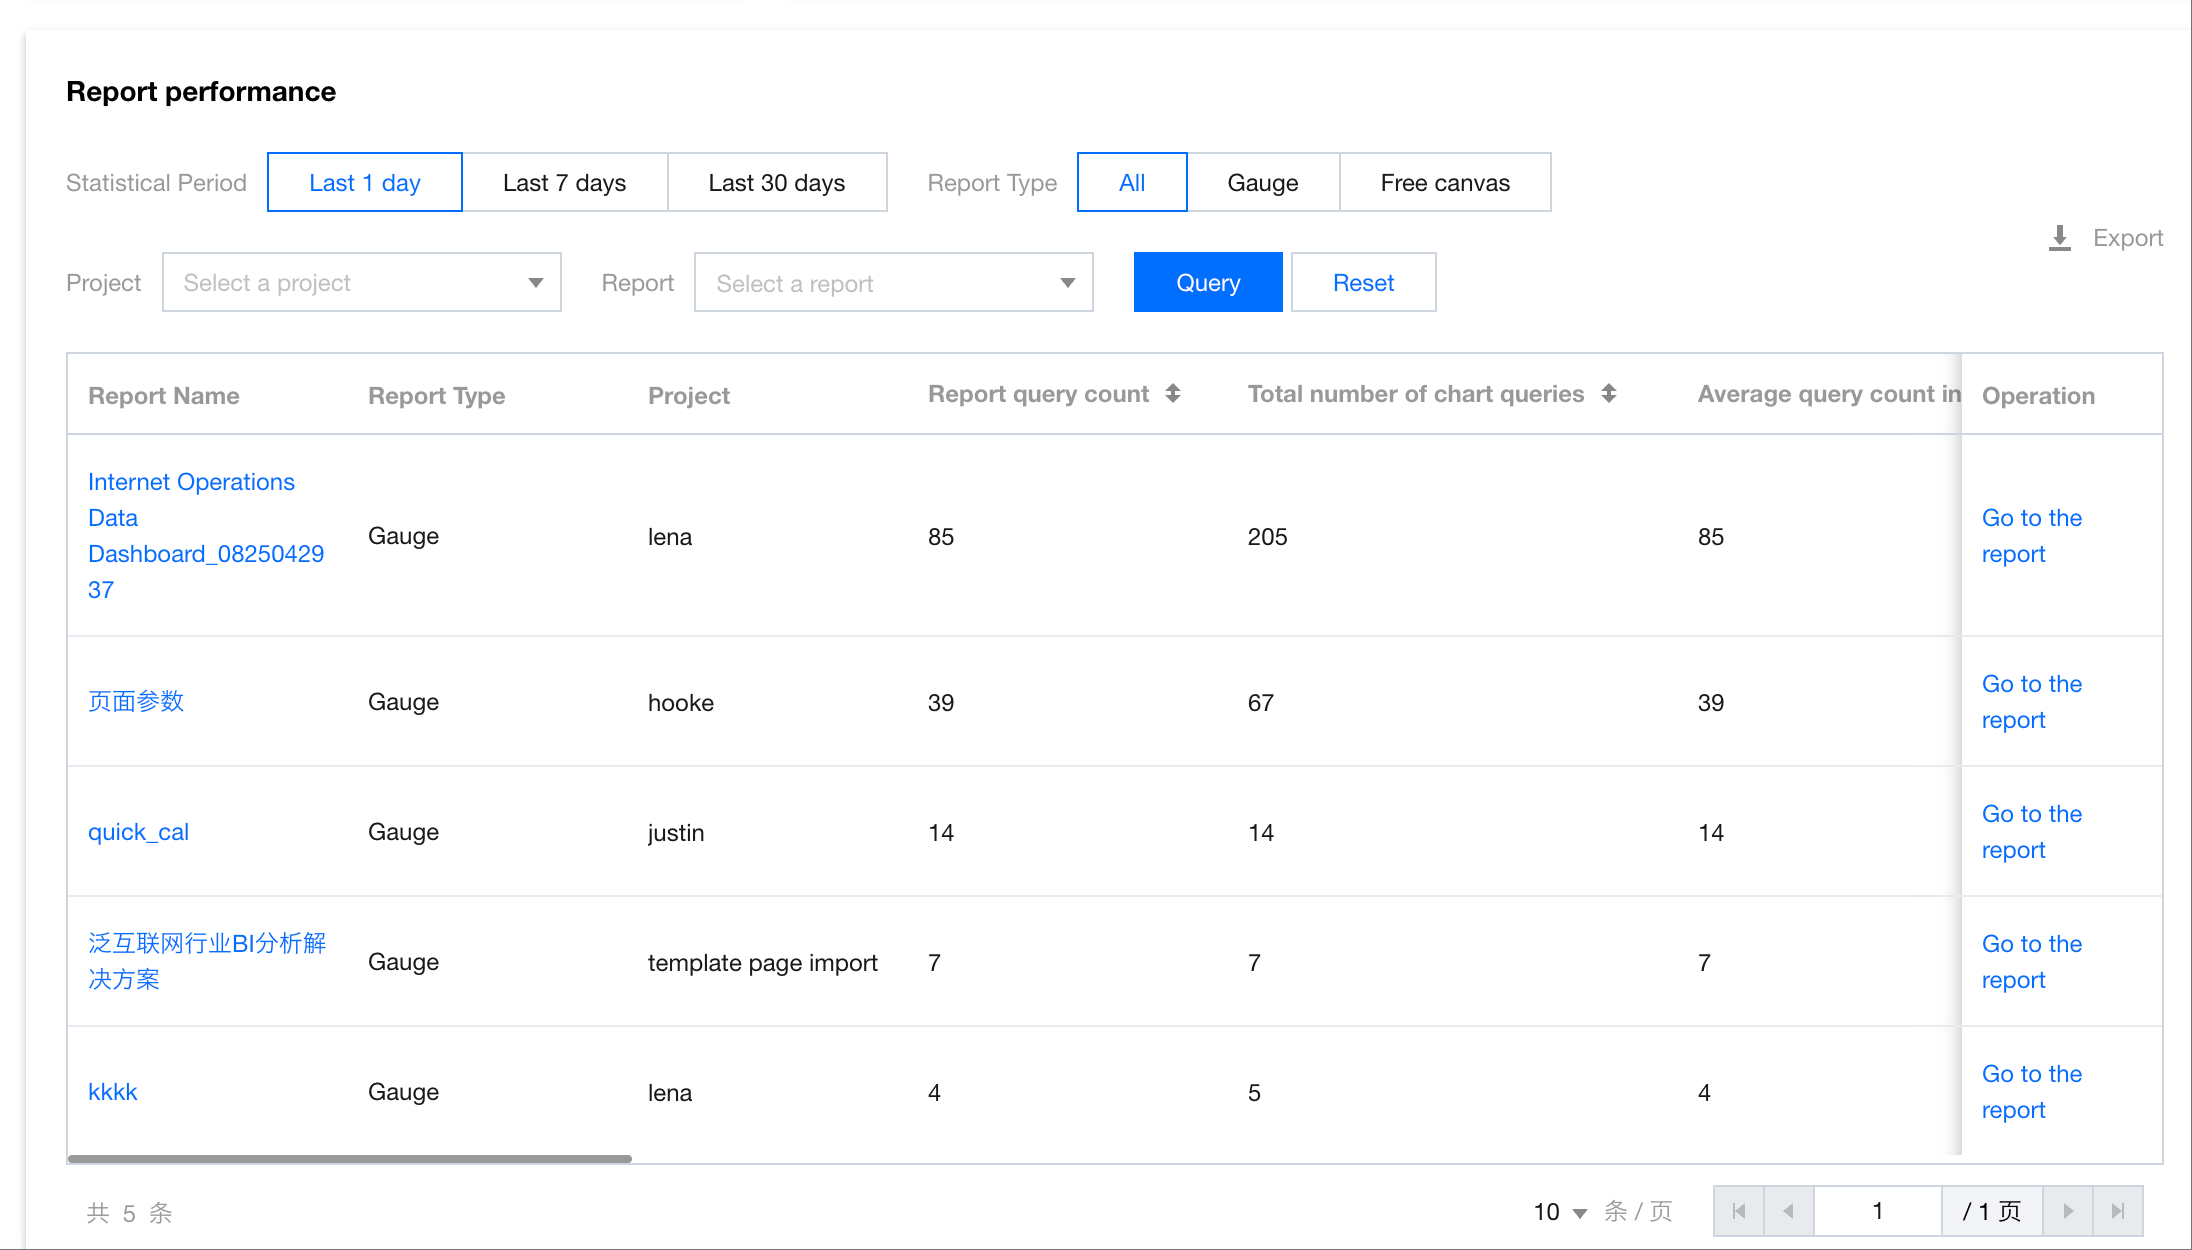
Field Description:
Report name: The name of the visited report.
Report type: The type of the visited report.
Associated project: The project to which the visited report belongs.
Report query count: The number of visits to the page.
Total chart query count: The total number of chart queries on the page.
Average report query count: The average number of report queries per day during the selected time period.
Average chart query count: The average number of chart queries per day under this report during the selected time period.
Average chart query duration: The average time spent on each chart query under this report during the selected time period.
Chart cache hit count: The number of cache reads for charts under the report during the selected time period.
Average chart cache hit duration (ms): The average time spent reading the report chart data from cache during the selected time period.
Proportion of chart queries over 10s: The proportion of chart queries that took longer than 10 seconds to the total number of queries under the report during the selected time period.
Chart query timeout count: The total number of chart query timeouts under the report during the selected time period.
Proportion of chart query timeouts: The proportion of chart query timeouts to the total number of queries under the report during the selected time period.
Chart refresh query count: The number of query requests triggered by refresh actions for charts under the report during the selected time period.
Average chart refresh query duration (ms): The average time taken for chart queries triggered by refresh actions under the report during the selected time period.
Count of chart queries using acceleration engine: The number of chart queries under the report accelerated by the data table during the selected time period.
Average duration of chart queries using acceleration engine (ms): The average time taken for chart queries under the report accelerated by the data table during the selected time period.
Chart Performance
Support viewing performance at the chart level.
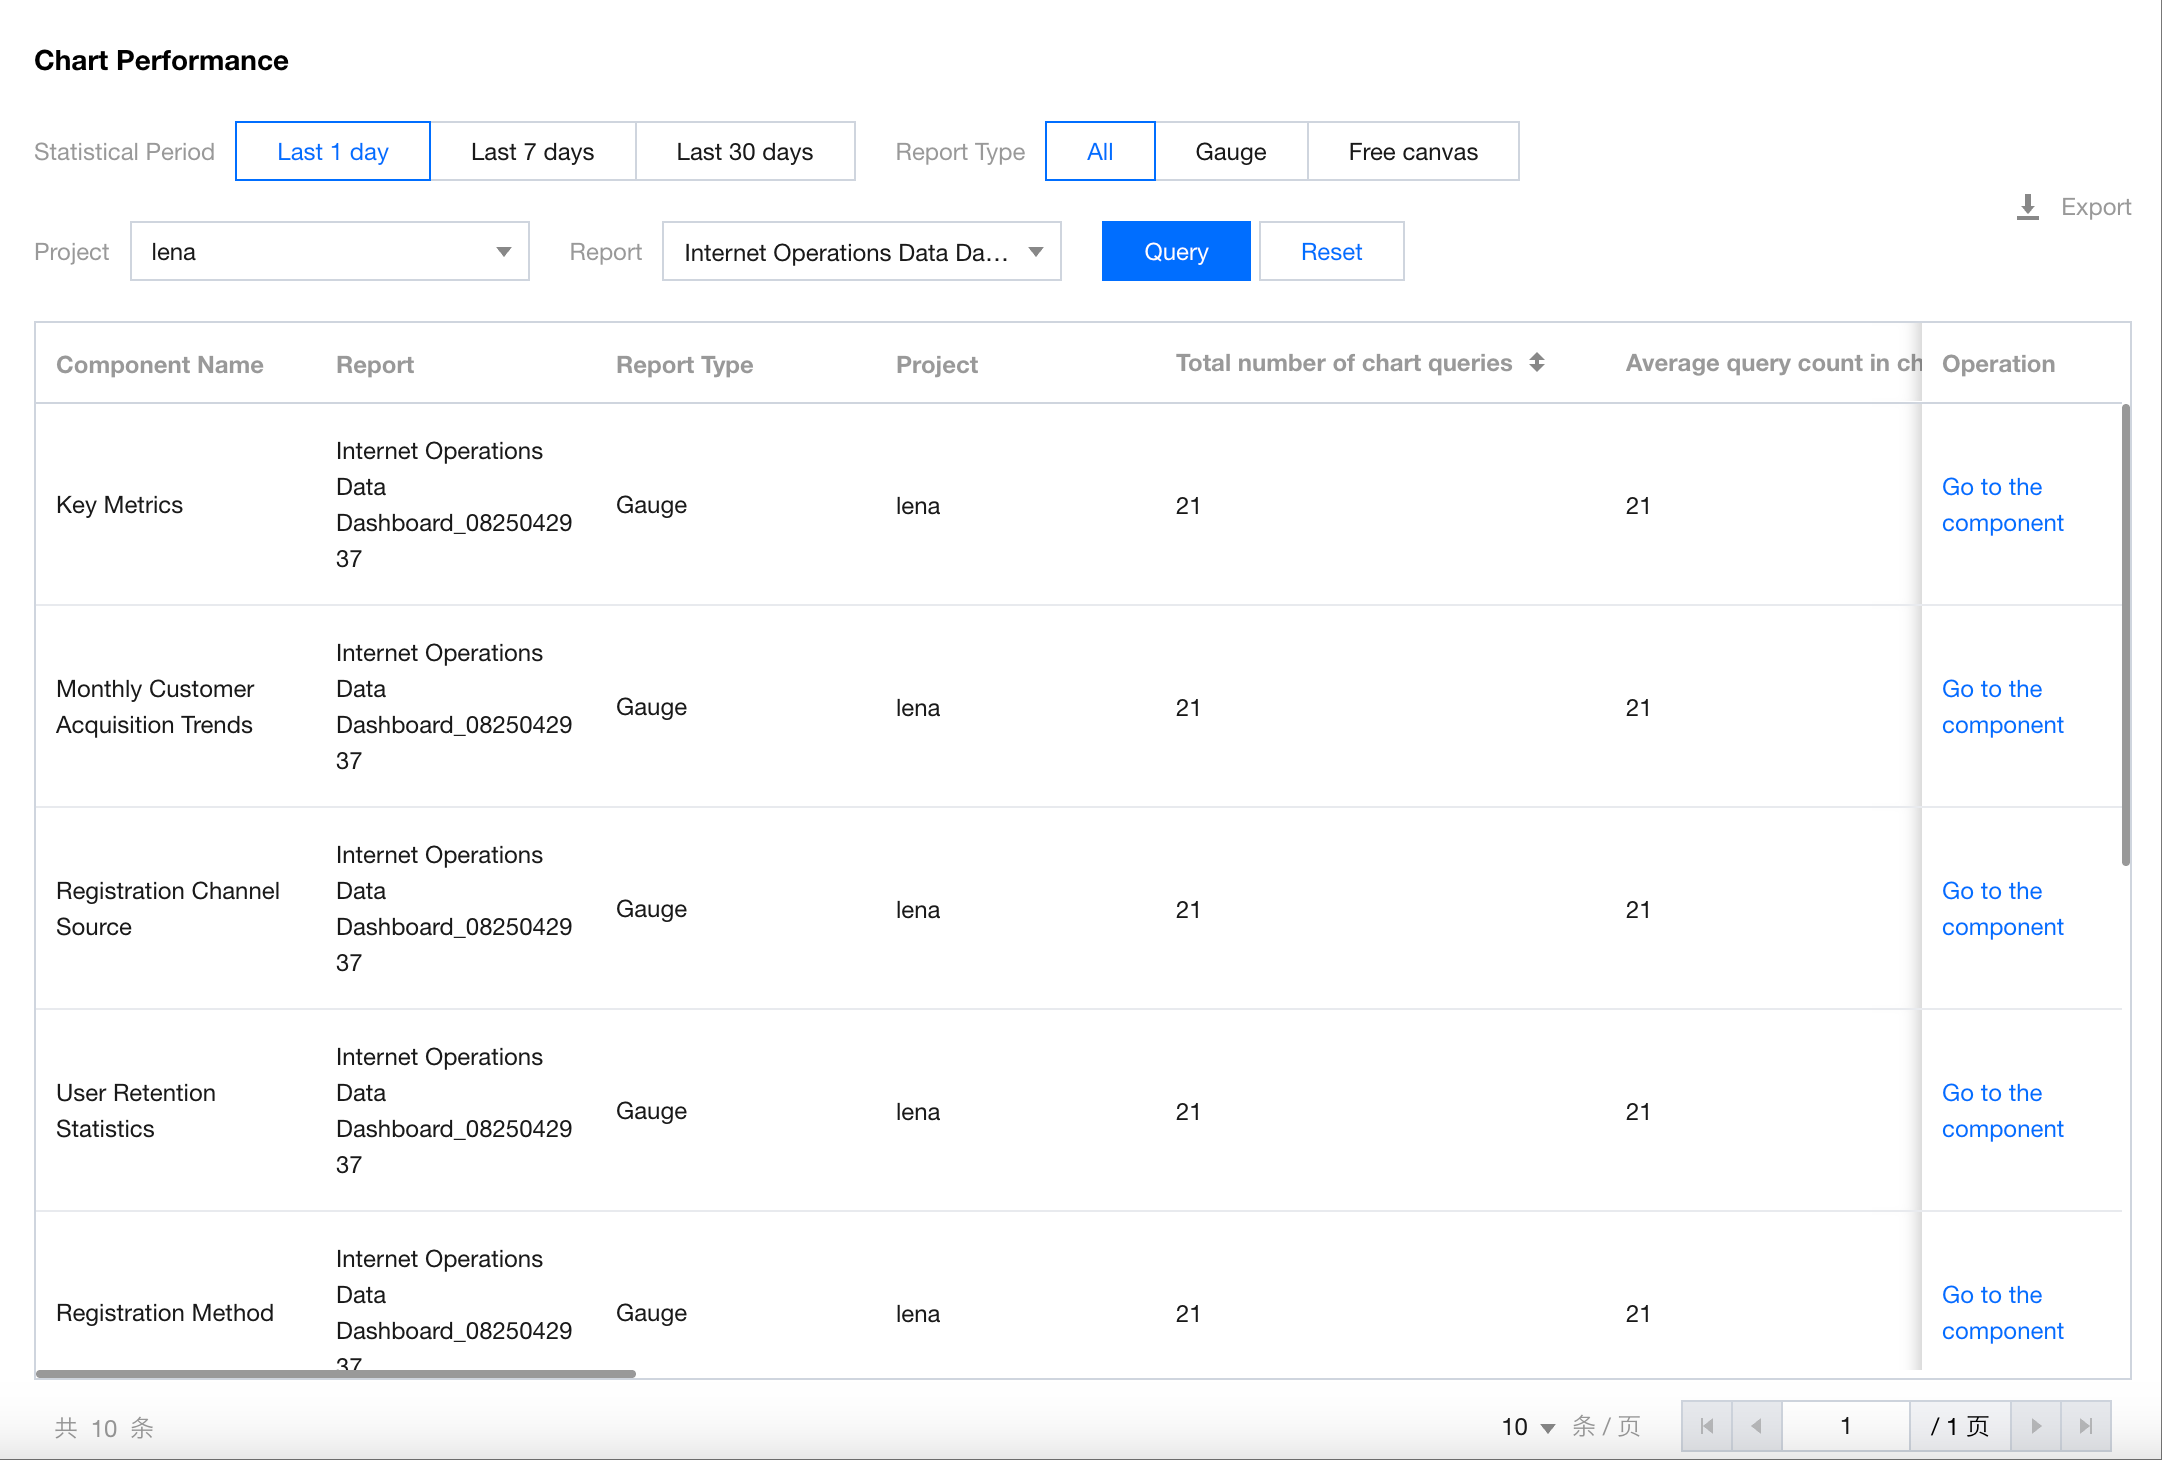
The field description is the same as the description for the report performance, but the scope is different. The chart performance only covers the current chart, not the entire report.
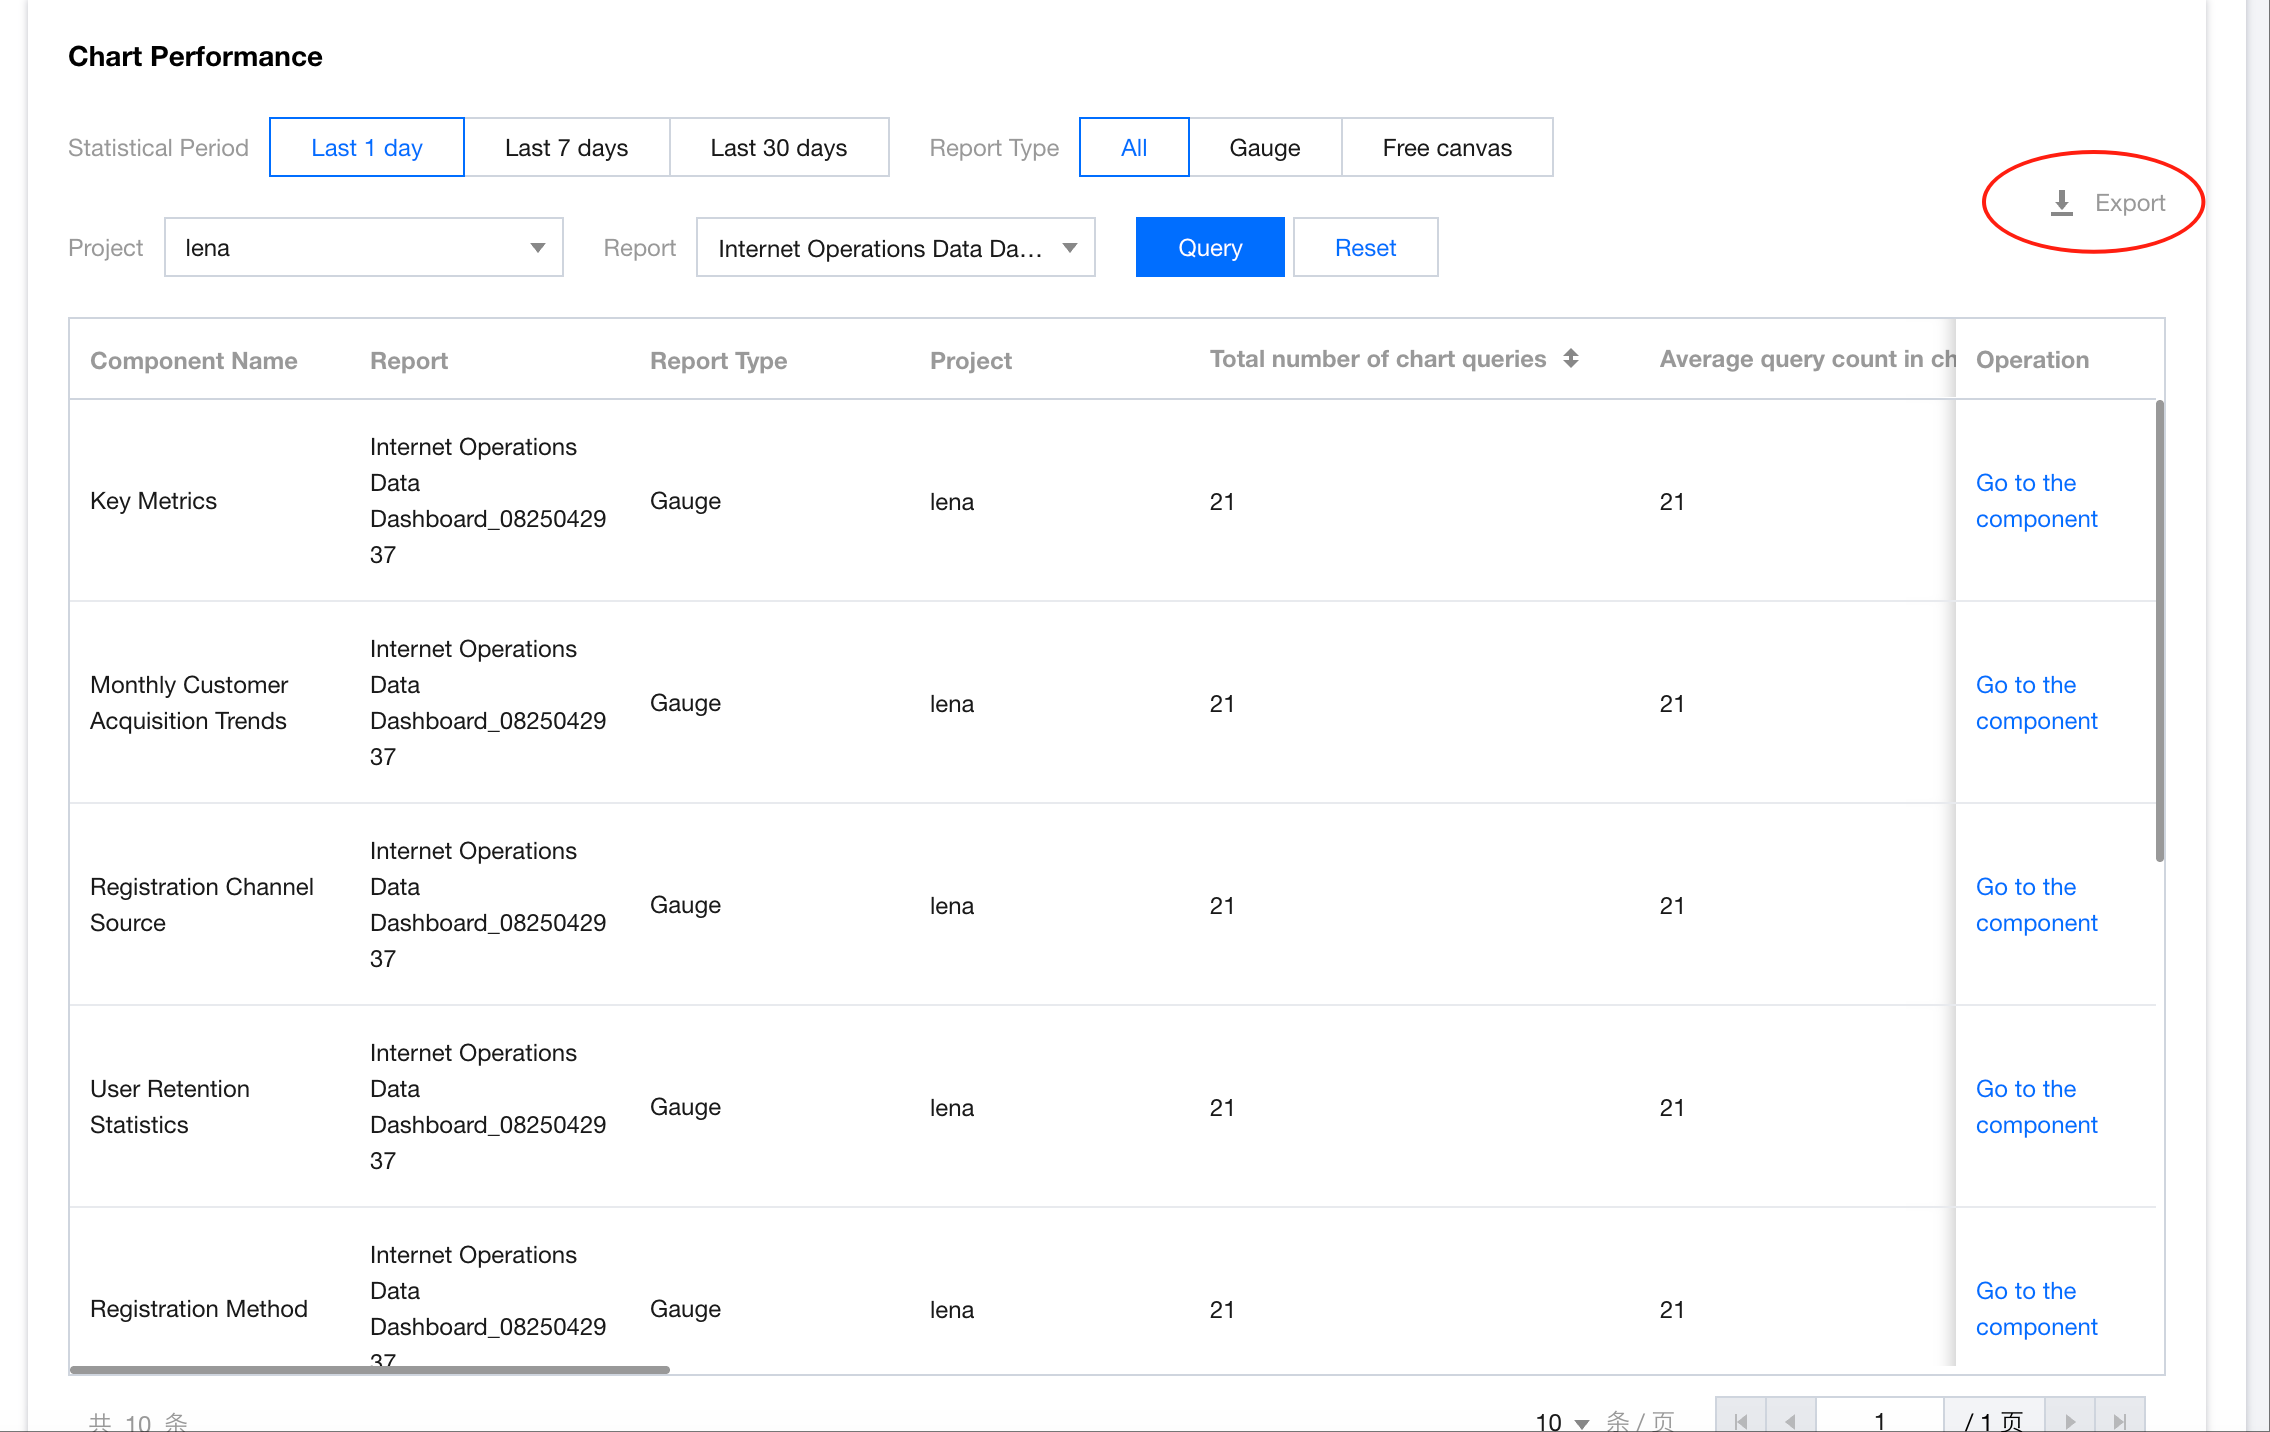
Exporting Details
Support exporting the performance data for the current query.
Help and Support
Was this page helpful?
You can also Contact sales or Submit a Ticket for help.
Help us improve! Rate your documentation experience in 5 mins.
Feedback