In data analysis scenarios, you may need to filter and view multiple charts under the same conditions to compare the performance of different analytical models in the same dimension. The chart linkage feature can help you quickly establish linkage relationships between chart modules on the same chart or different charts. The specific operations are as follows:
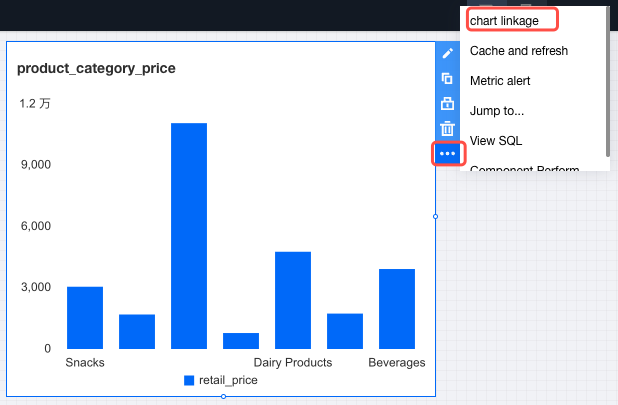
1. Go to the editor, then select "Chart Interaction" under the "More" icon.
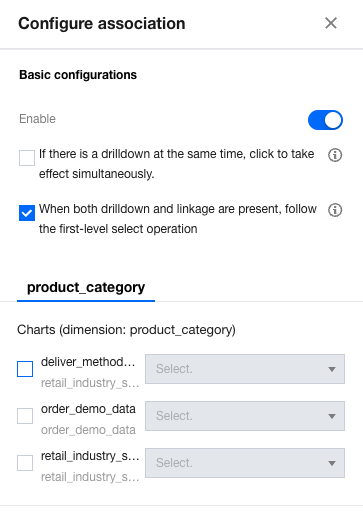
2. Enable "Enable linkage" in the settings panel.
When "If there is a drilldown, click takes effect at the same time" is selected, if a drill-down is configured, clicking chart dimension values will initiate both the linkage and drill-down at the same time. Otherwise, you can choose between performing a drill-down or a linkage for the current click.
When "When both drilldown and interaction exist, follow the first-level select operation" is selected, if a drill-down is configured, clicking chart dimension values will follow the first selection. For example, if the first selection is a drill-down, any subsequent clicks will trigger the drill-down interaction without requiring another selection.
If neither of the two options is selected, clicking chart dimension values will prompt you to select which operation to perform for the current click.
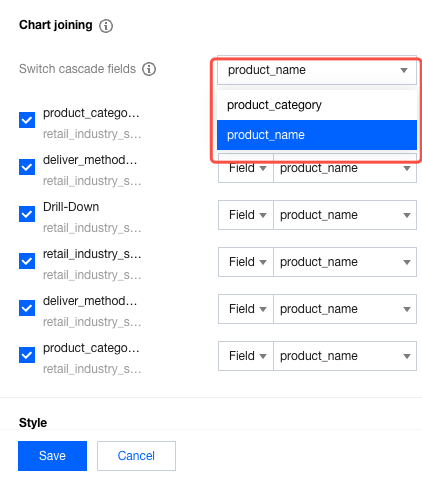
3. Select different dimension tags for linkage (The dimension tags are determined by the number of dimensions set in the component settings).
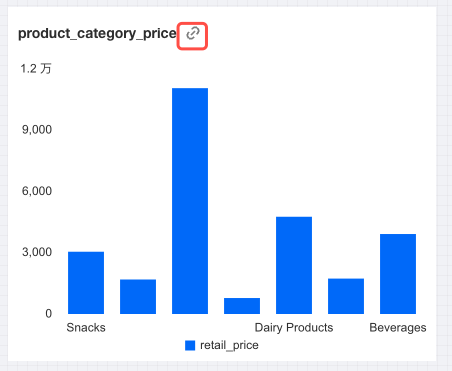
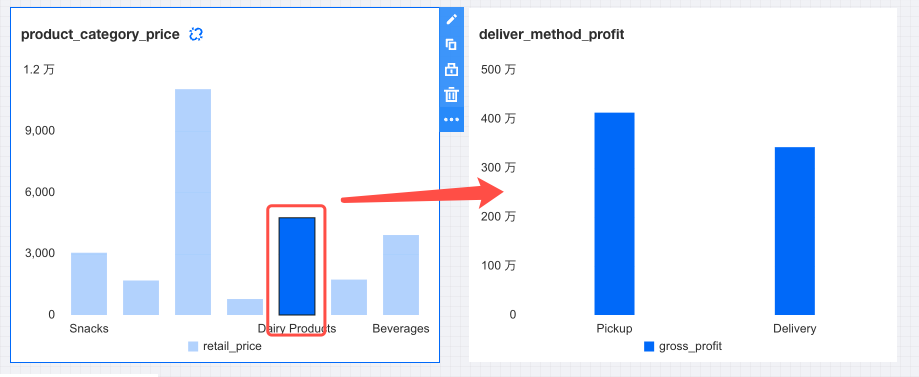
4. After a page is released, if a linked component is set, the linkage icon will appear on the dashboard.
5. When you click a dimension, the associated chart will refresh data based on the linkage settings. As shown in the figure below, clicking a dimension value will automatically filter out the data of that dimension in the data table.
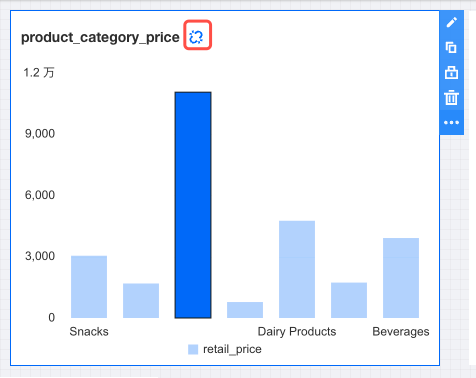
6. To restore the chart to its pre-linkage status, click the "Clear Linkage" icon to perform the clearing operation. The location of the clearing icon is as follows:
Note
1. Chart linkage is only supported for chart components.
2. Linkage settings do not allow for looped linkage. For example, if Chart A links to Chart B, then Chart B cannot link to Chart A.
3. When the linkage feature is enabled, you need to link at least one chart.