Tag
Download
Focus Mode
Font Size
This document introduces the settings for data tags in charts, including component tag display, tag content, tag location, global settings for tag text style, and style settings for specific fields.
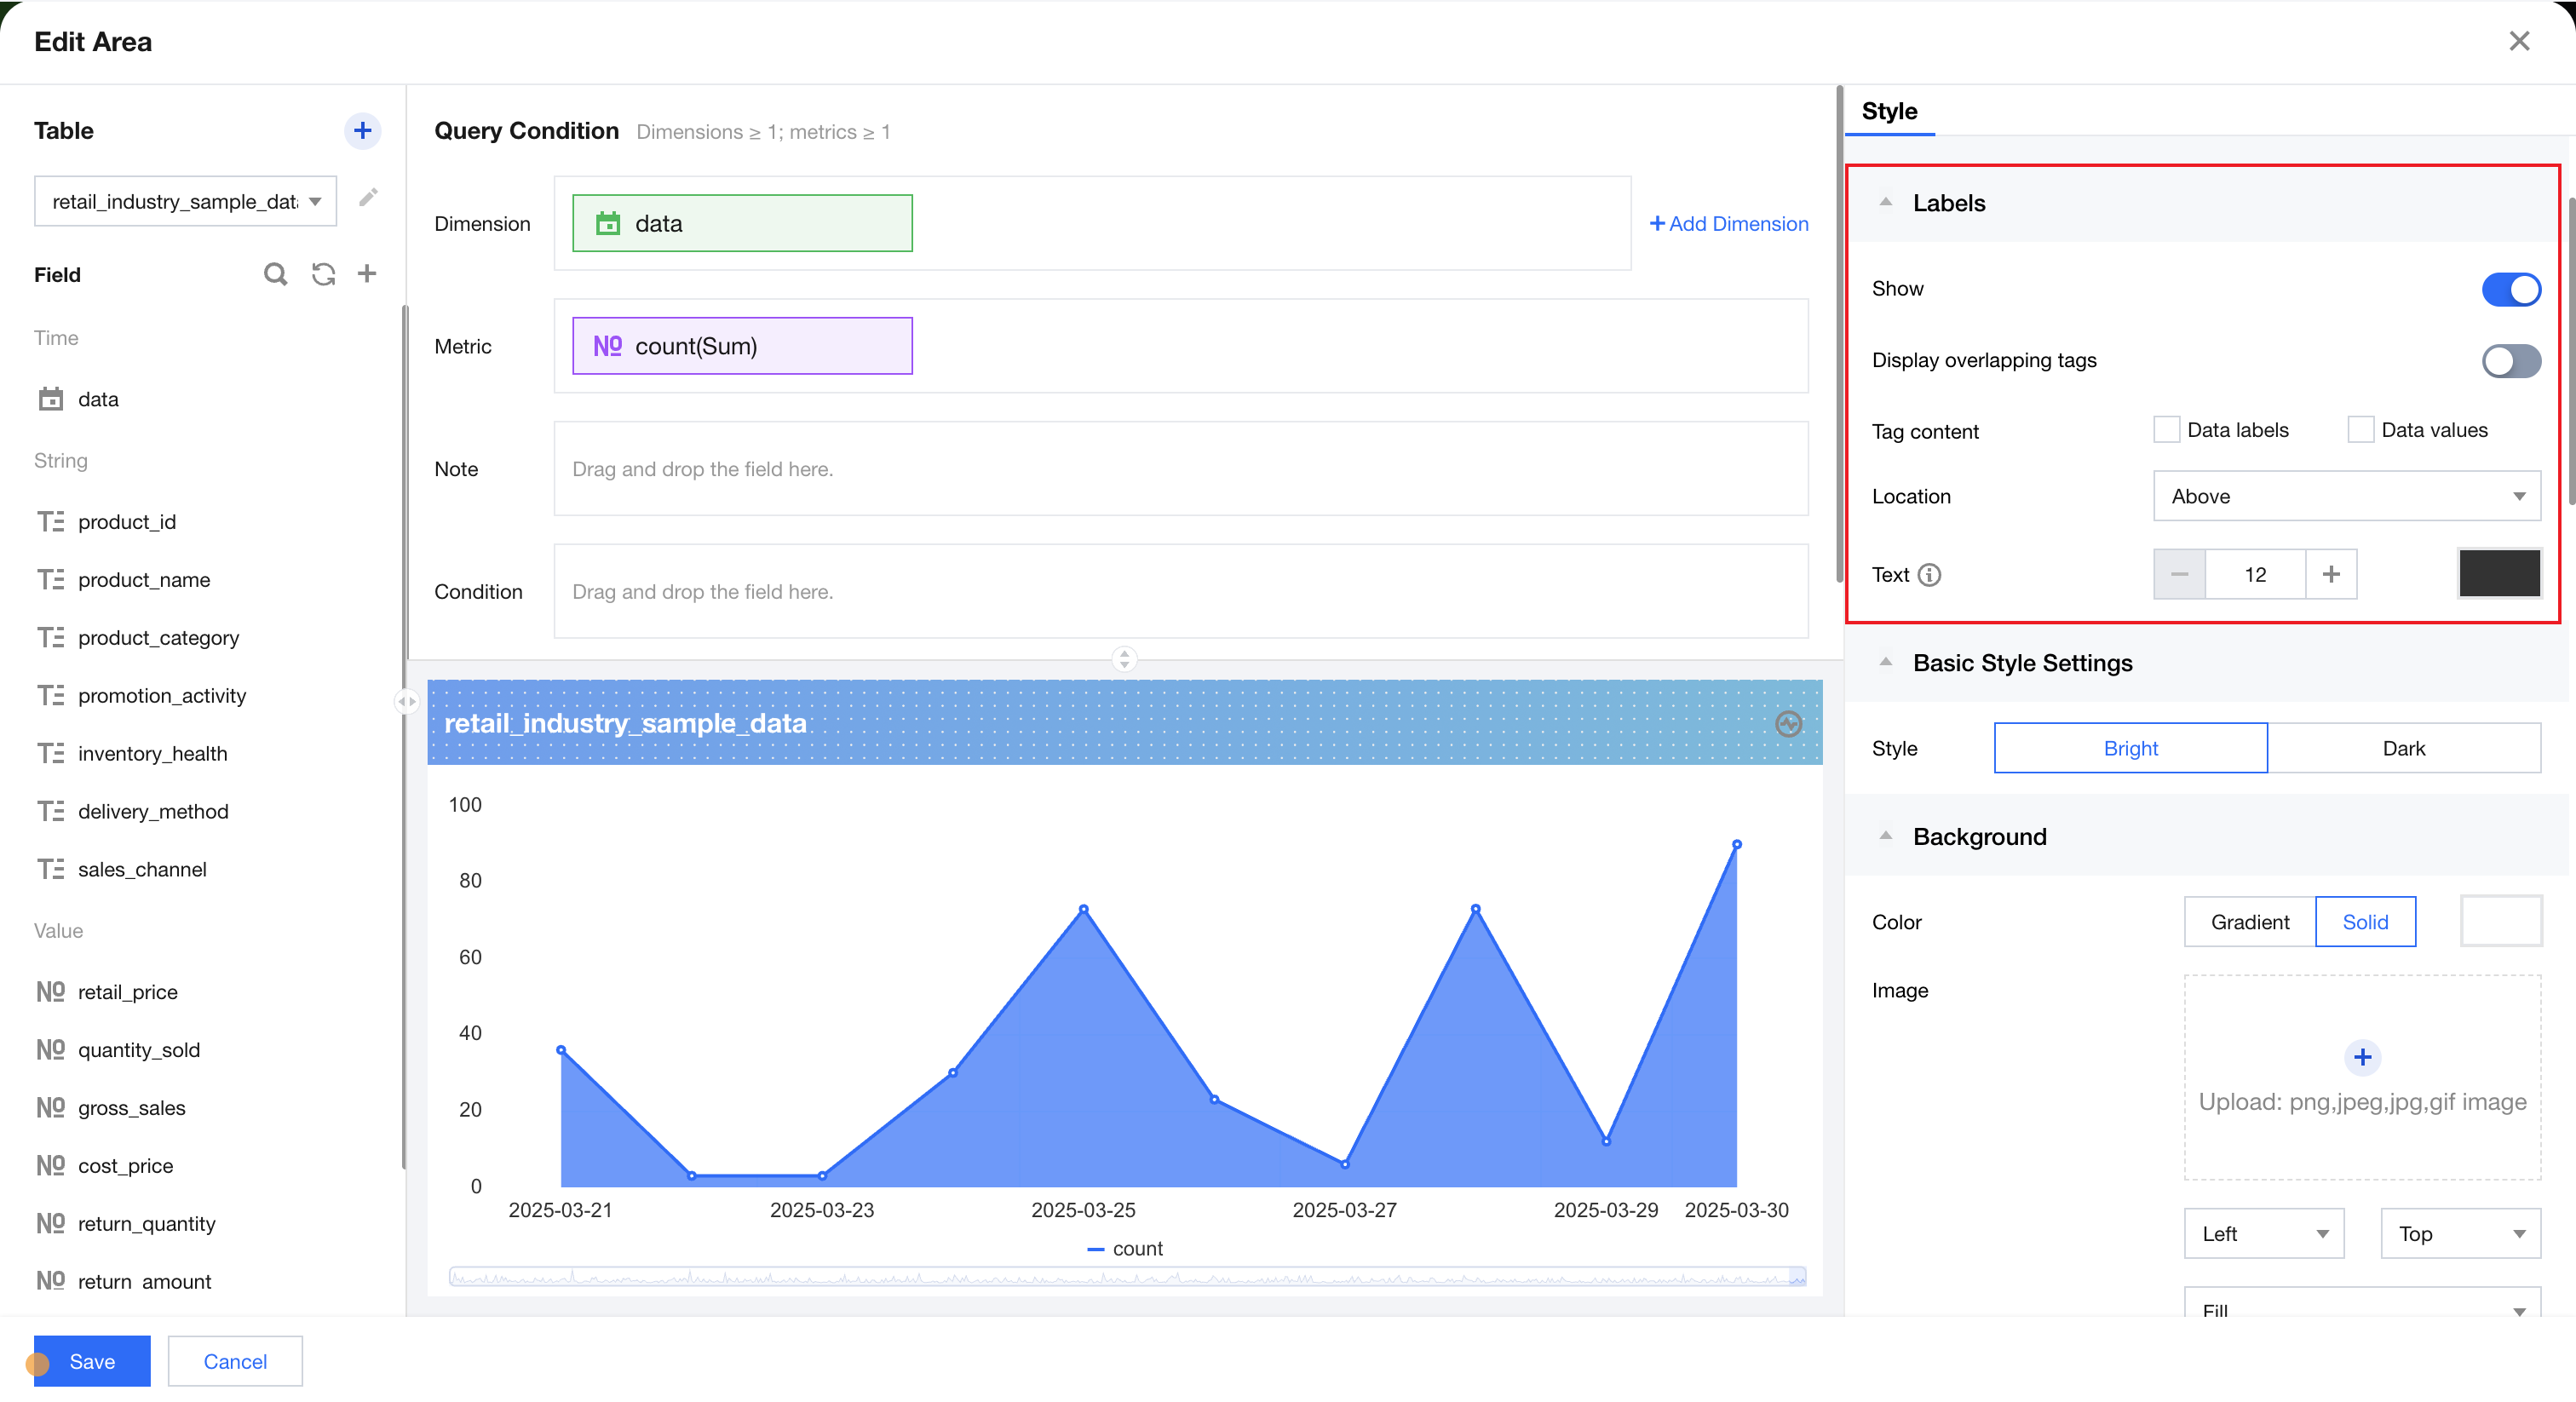
Display Tag
Tag Switch
After turning on the display, the selected tag items in the tag content will be shown in the chart. The following figure shows the data value tag.
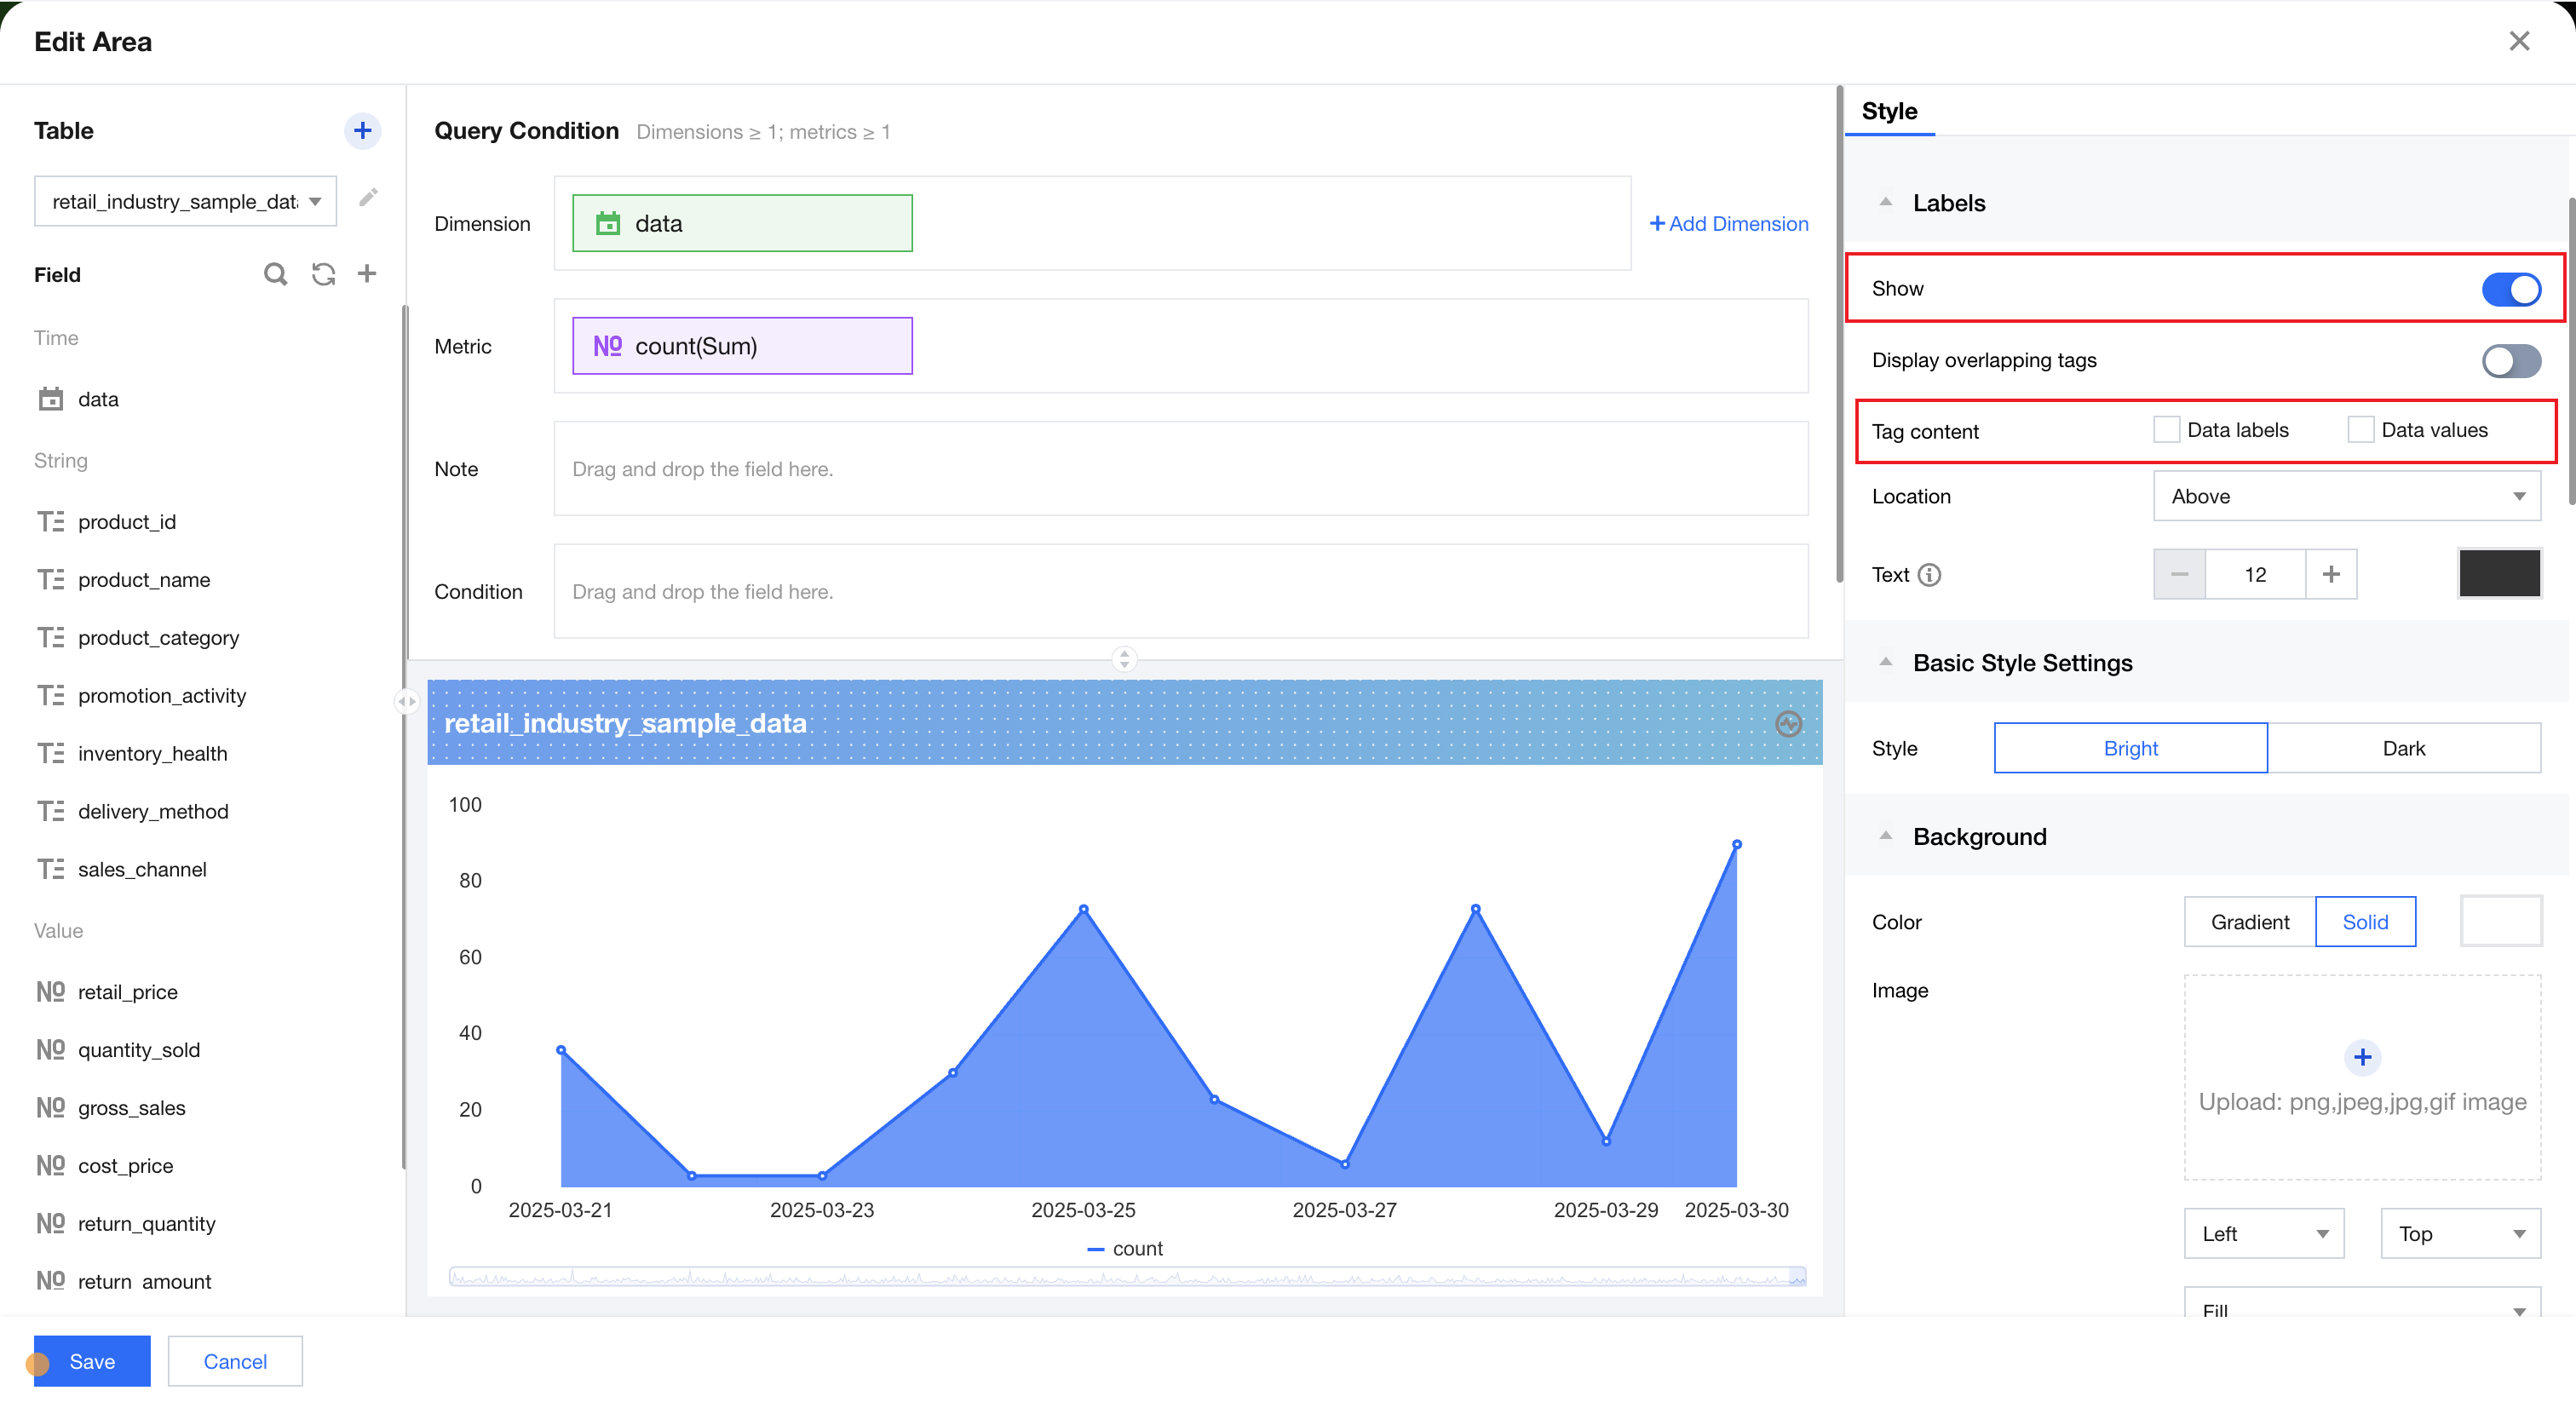
Display Overlapping Tags
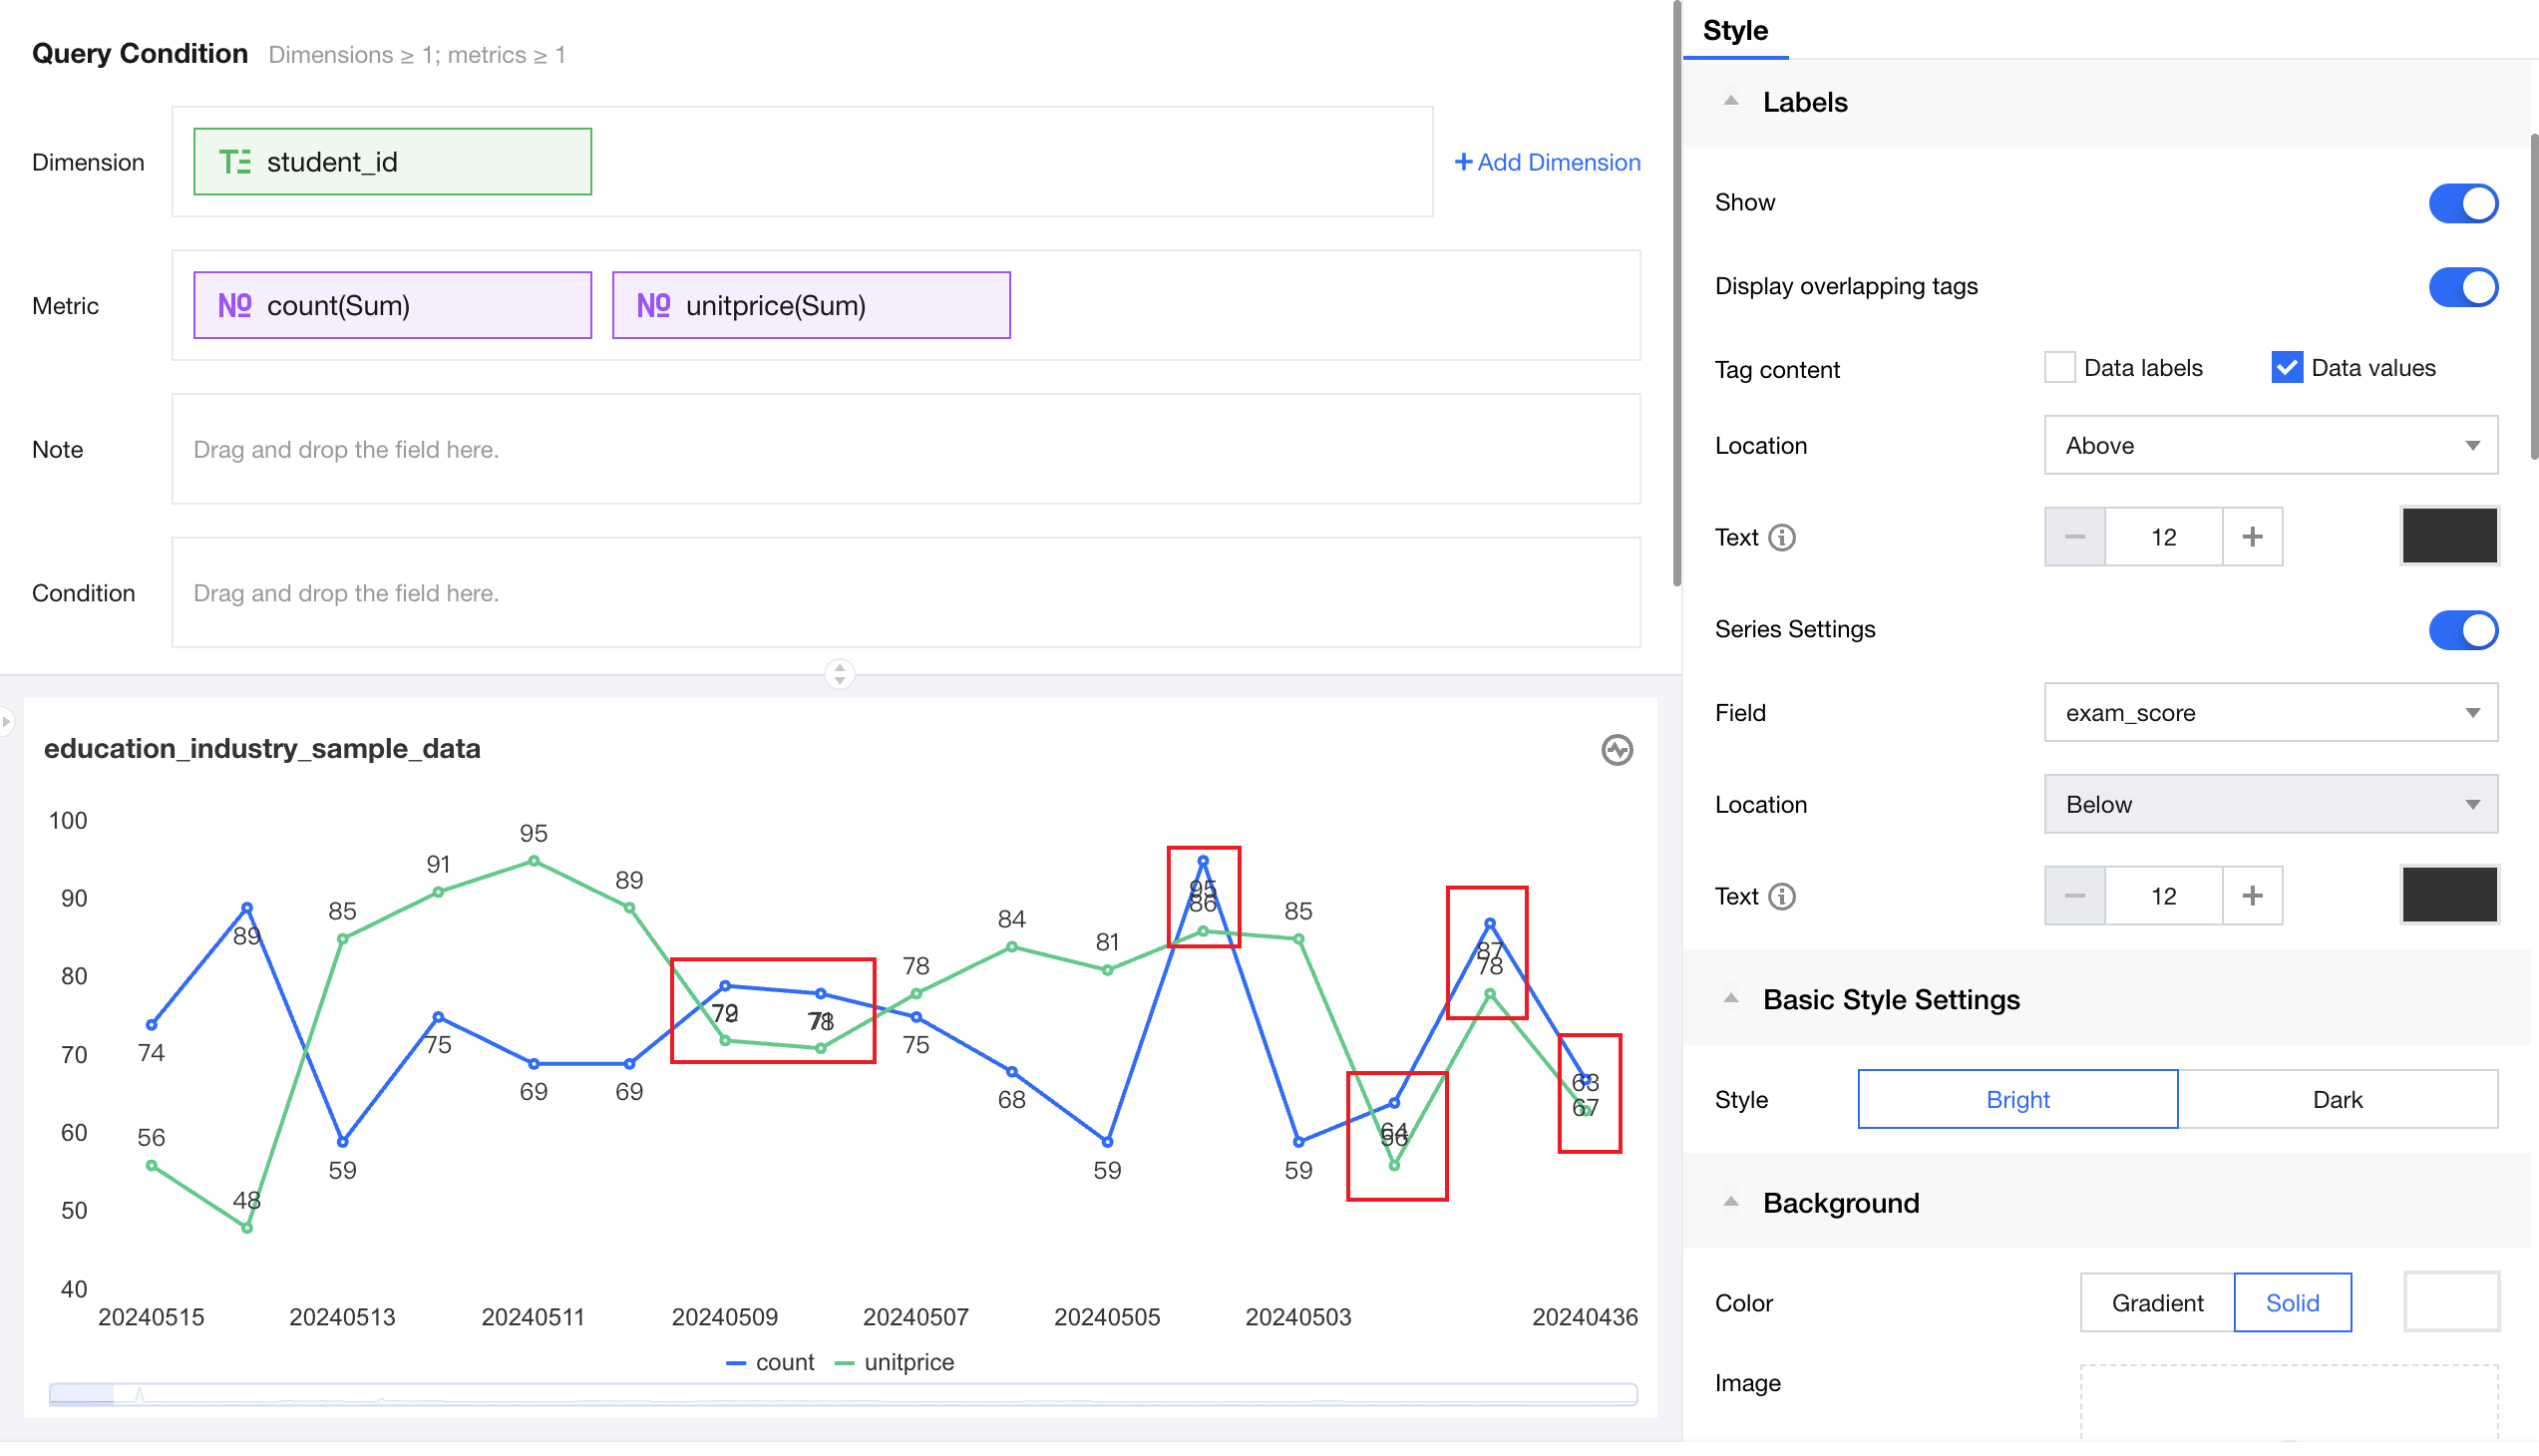
When overlapping tags are enabled, all originally overlapping tags will be fully displayed, suitable for chart data with less overlap. If tag positions overlap considerably, the location and size of specific fields can be adjusted individually through series settings for an appropriate display effect.
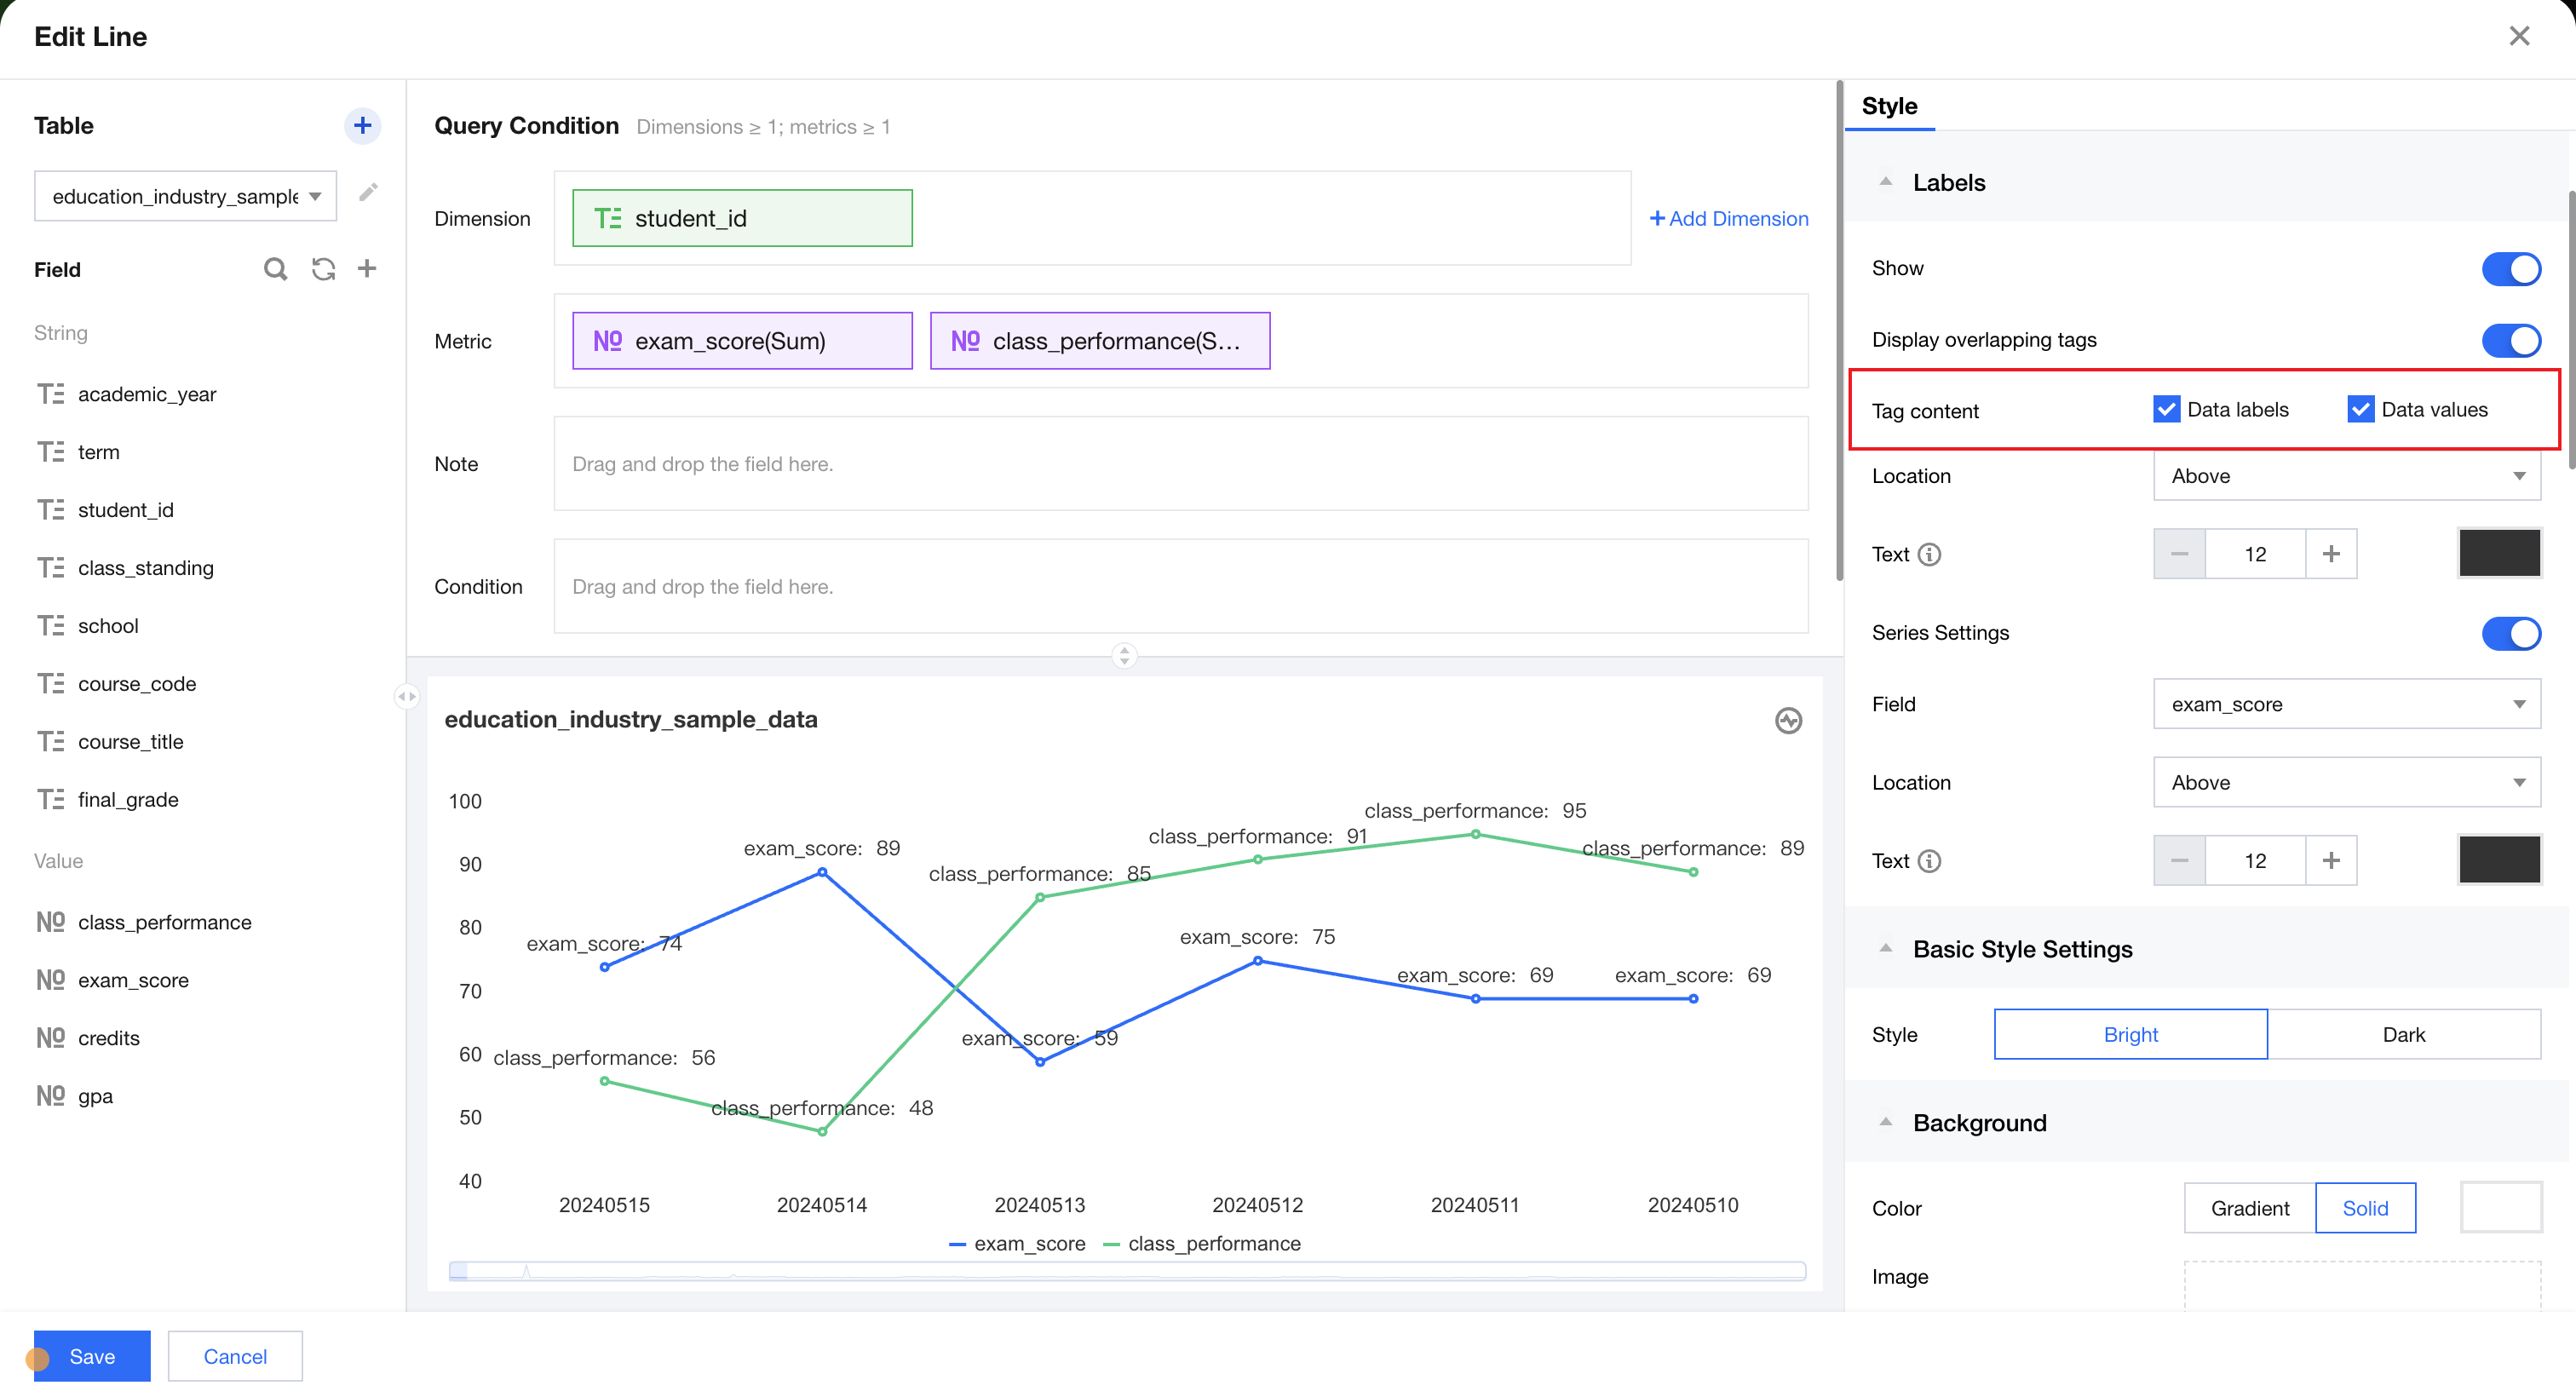
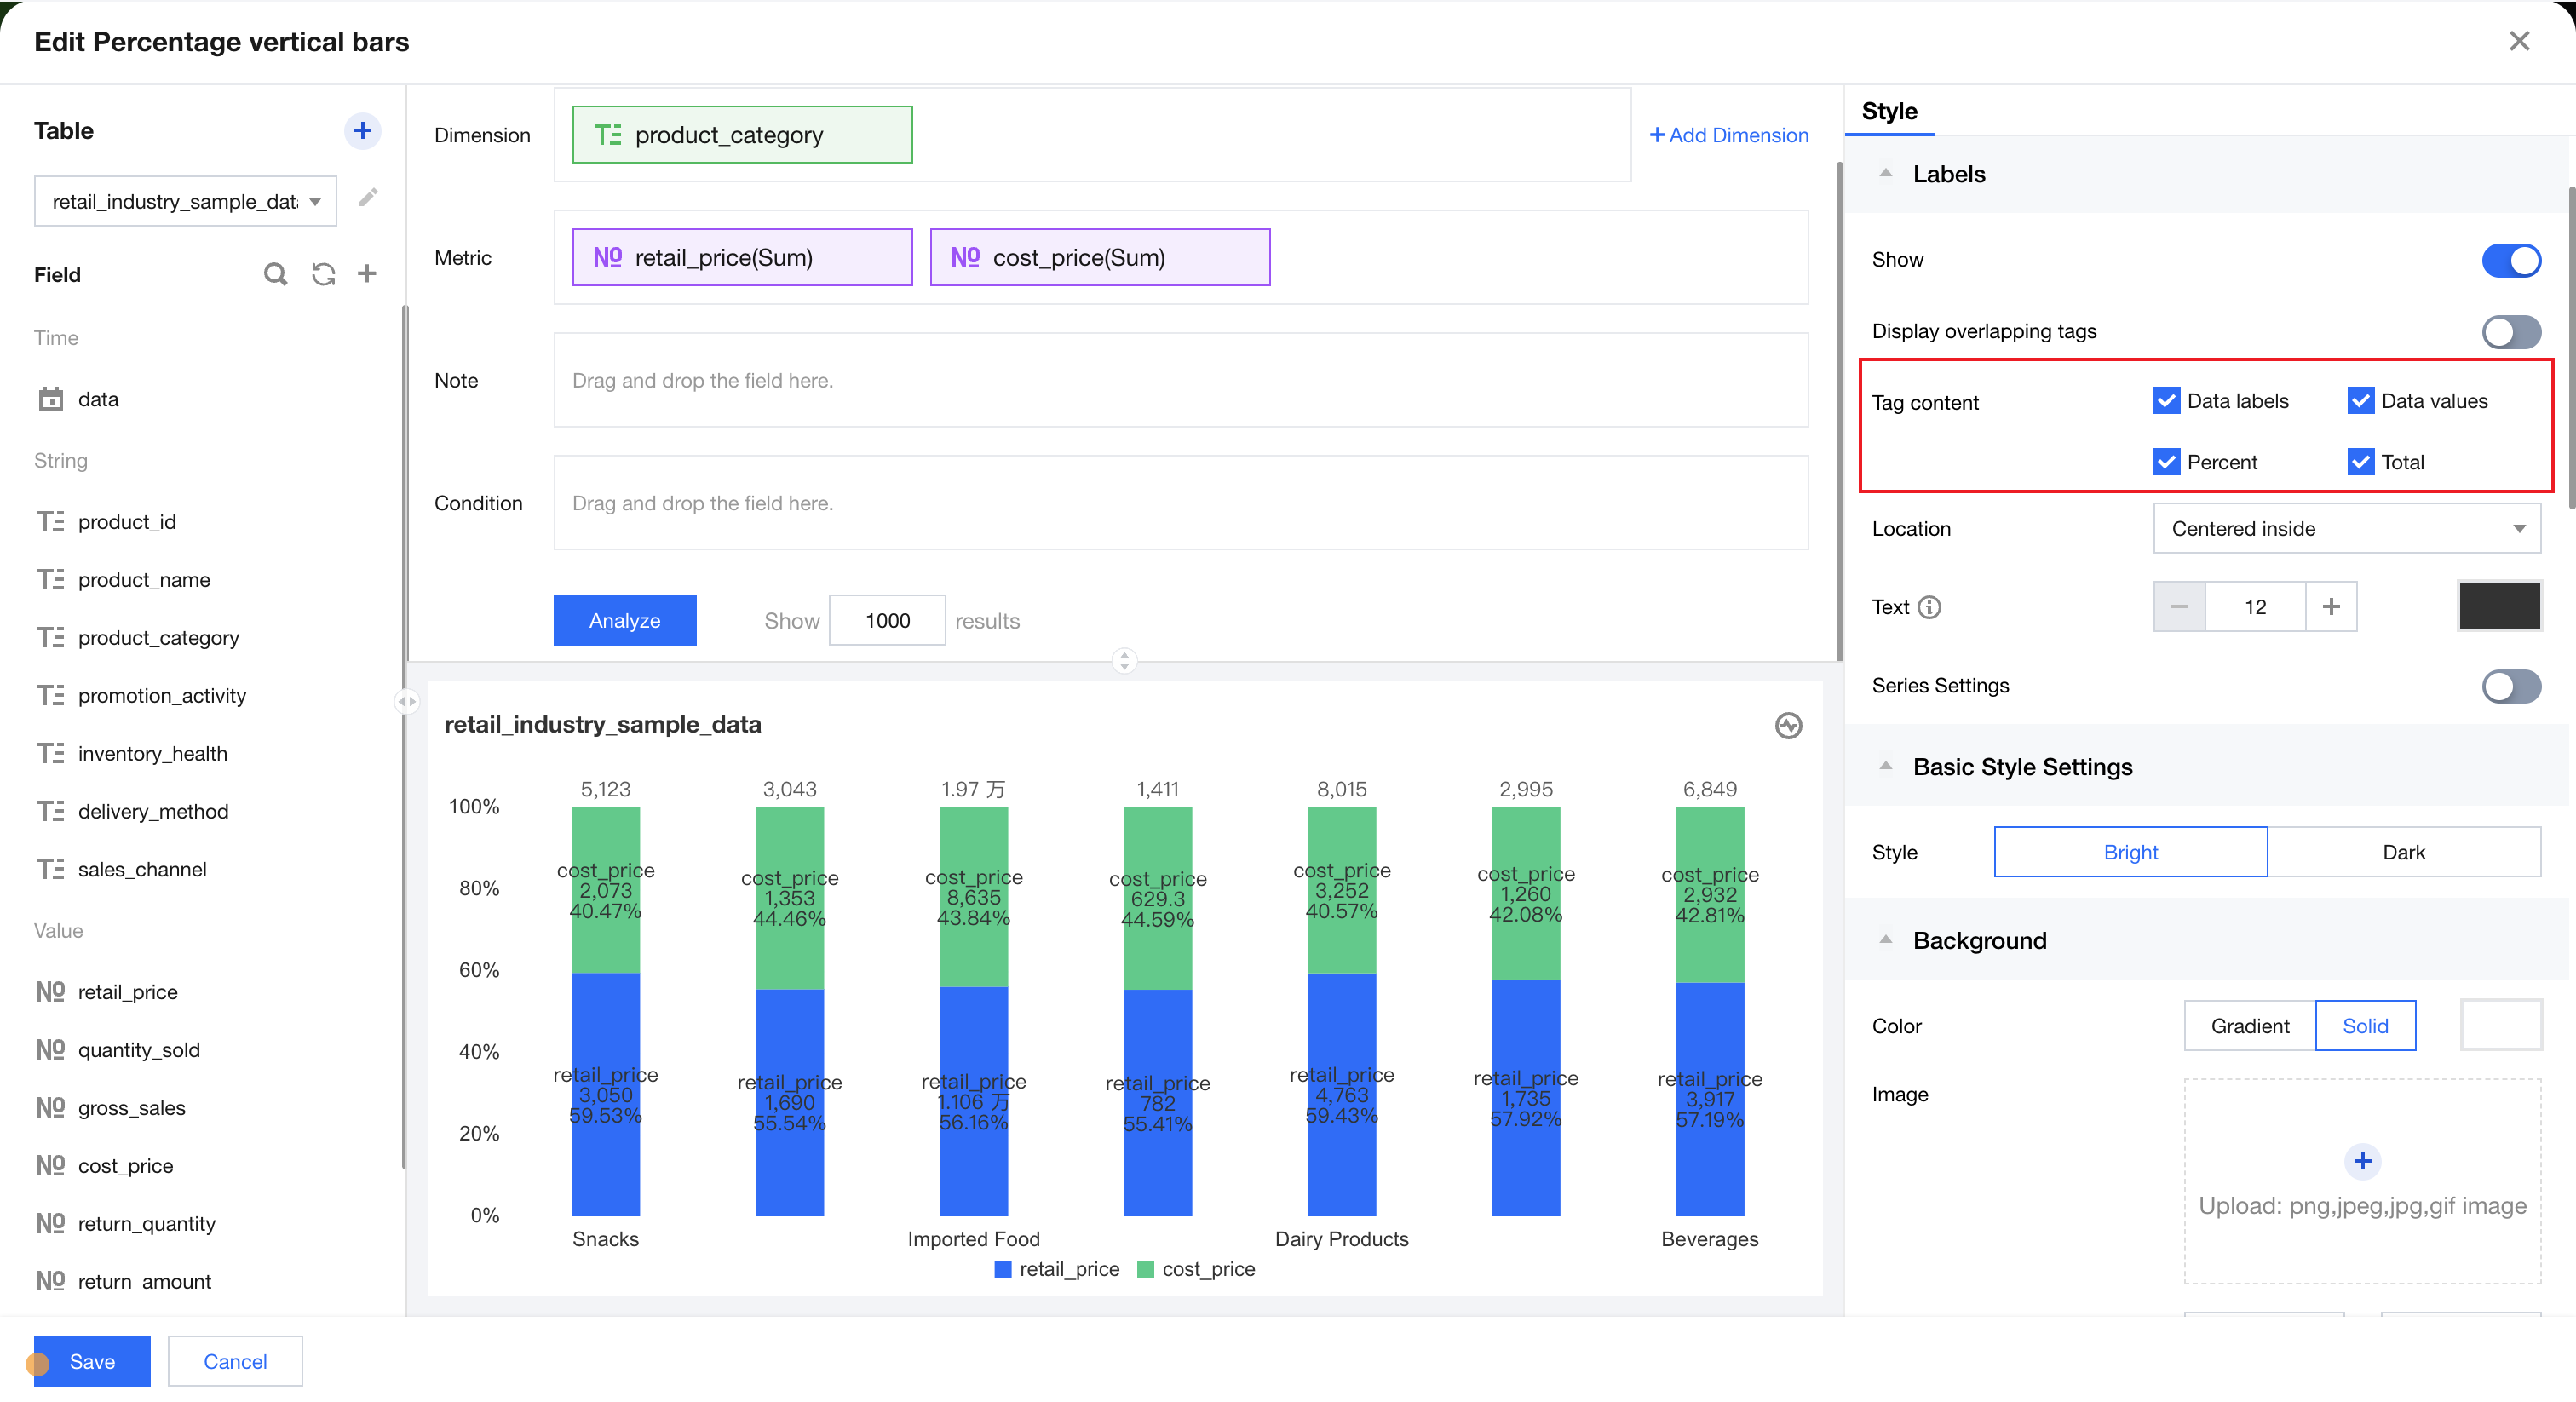
Tag Content
Selected selected tag will display in the chart when tag visibility is turned on. Different components support different tag items, usually including four types: data name, data value, percentage (for percentage class charts), and total (for stack class charts).
Tag Location
Different chart types support different tag position settings, as follows:
Chart Type | Position | Rendering Indication |
Line and area charts | Top, Bottom | 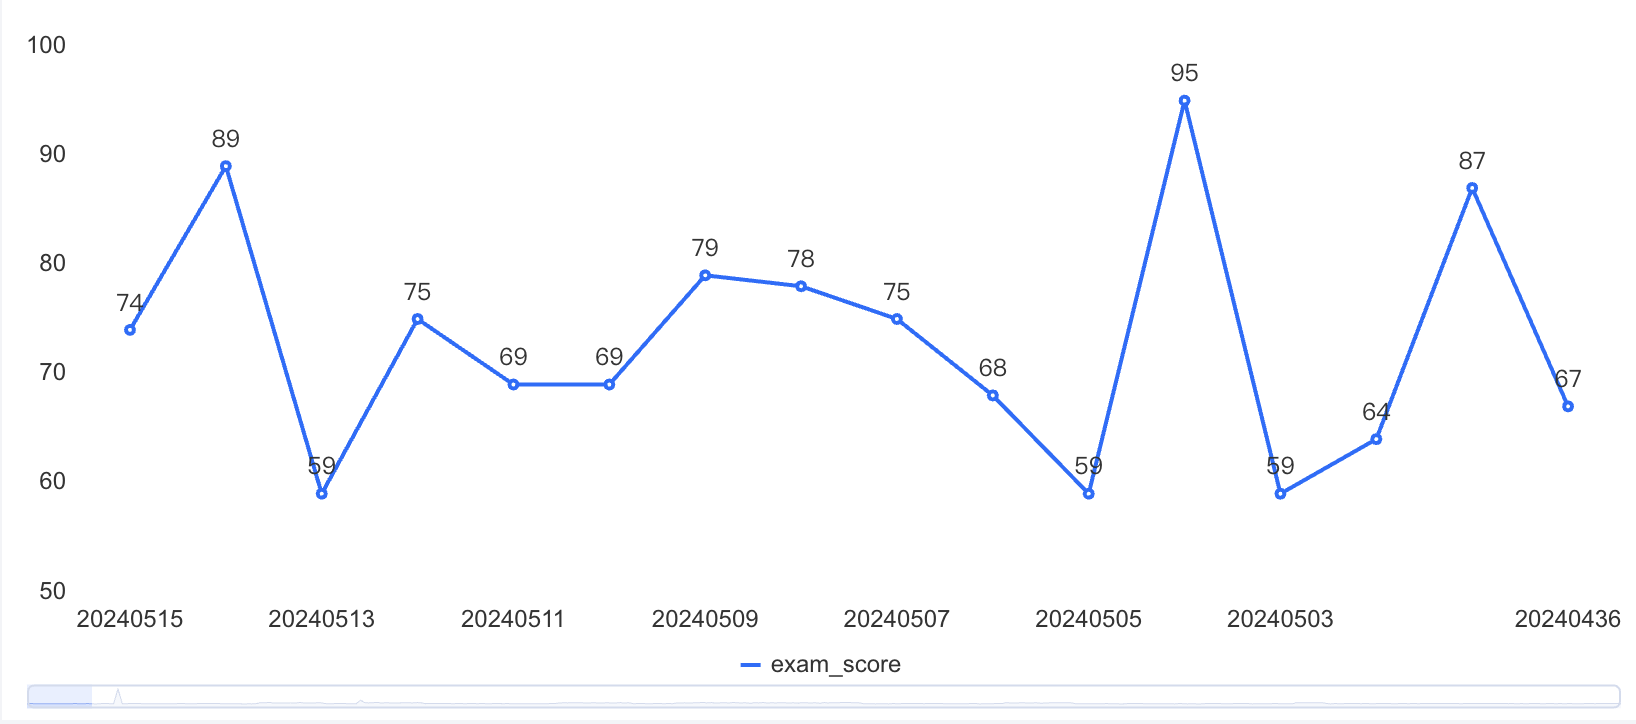 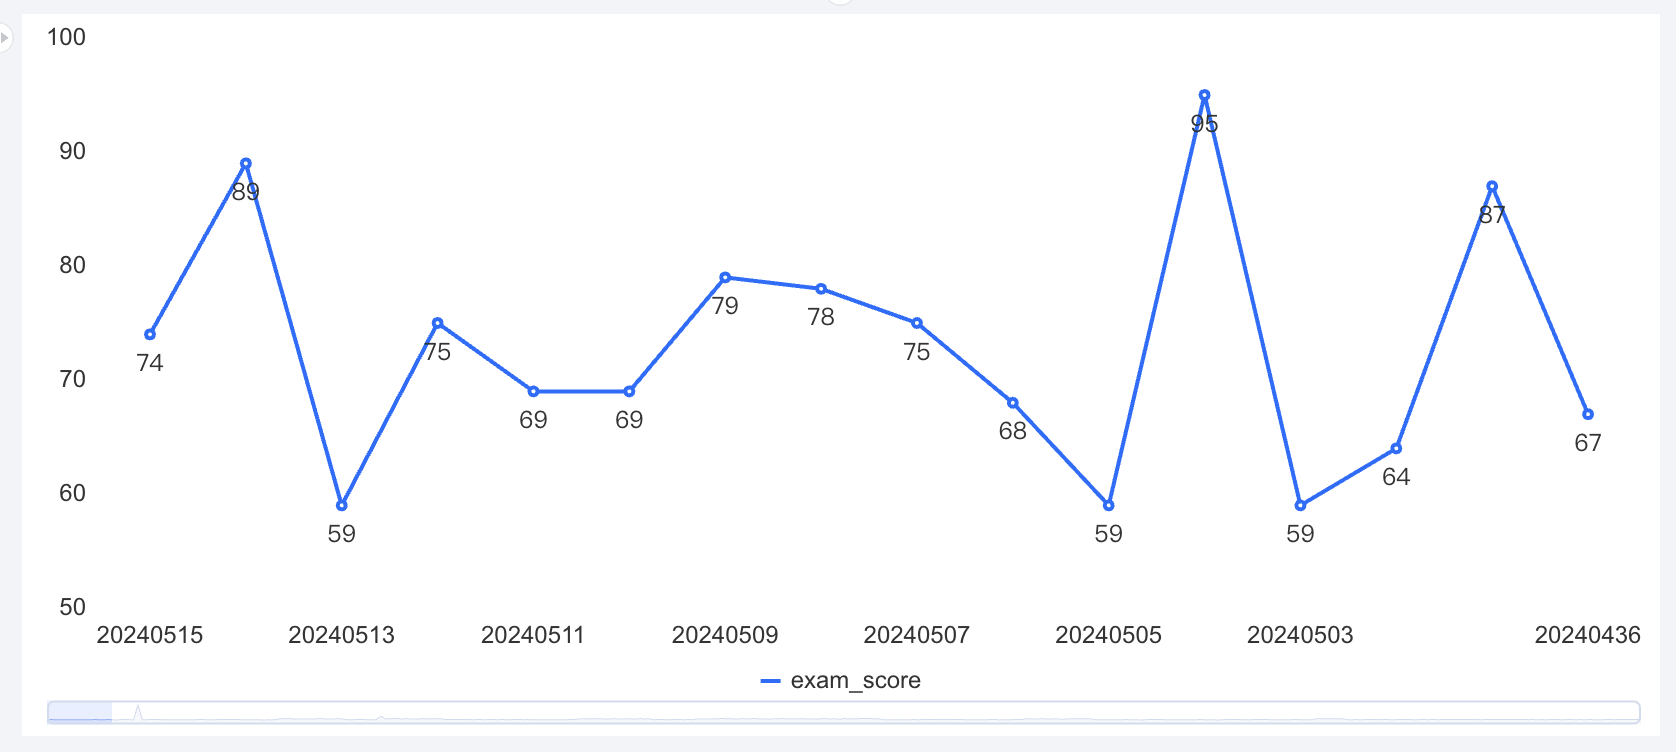 |
Histogram, bar chart | Outside, Inside Top, Inside Center, Inside Bottom | 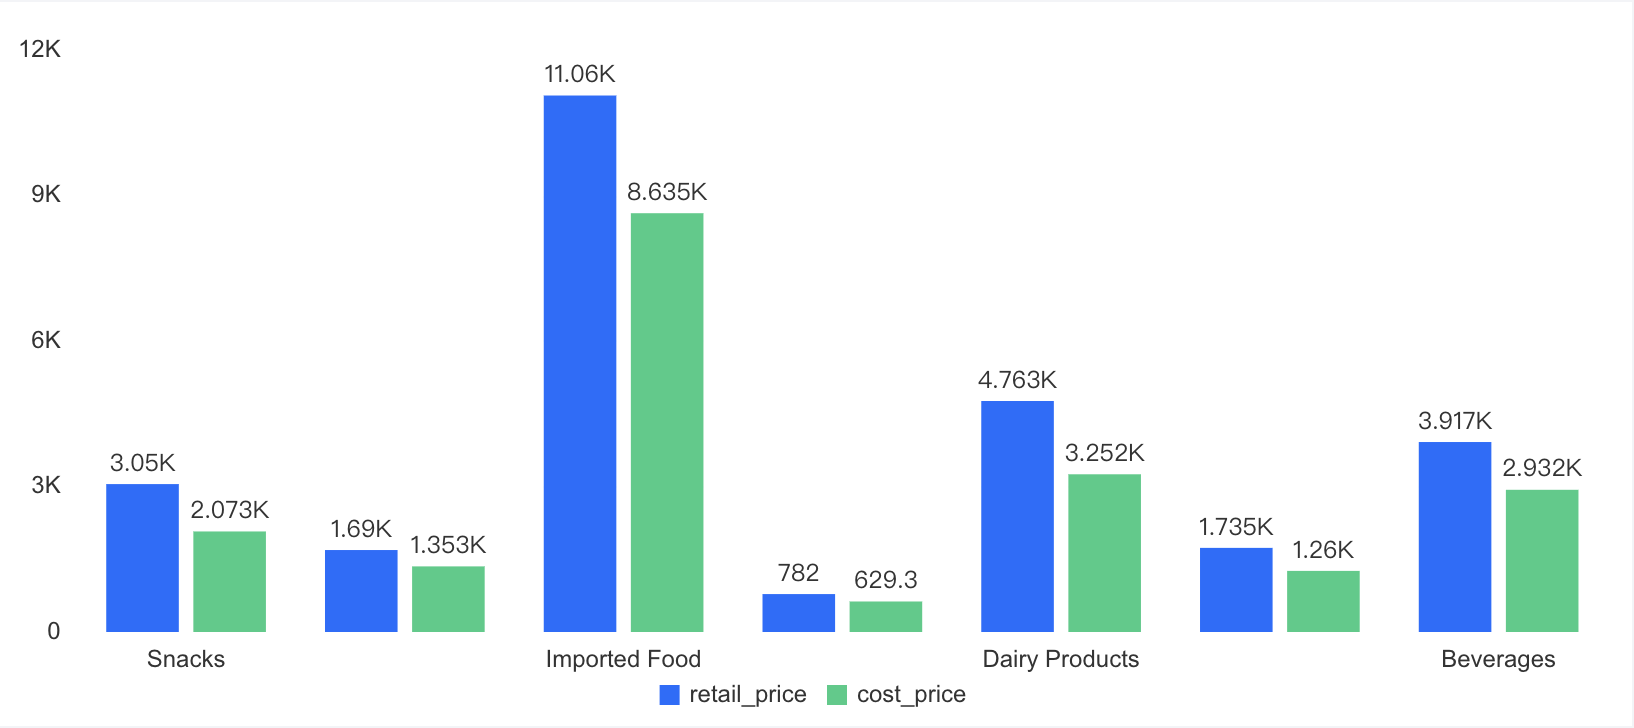 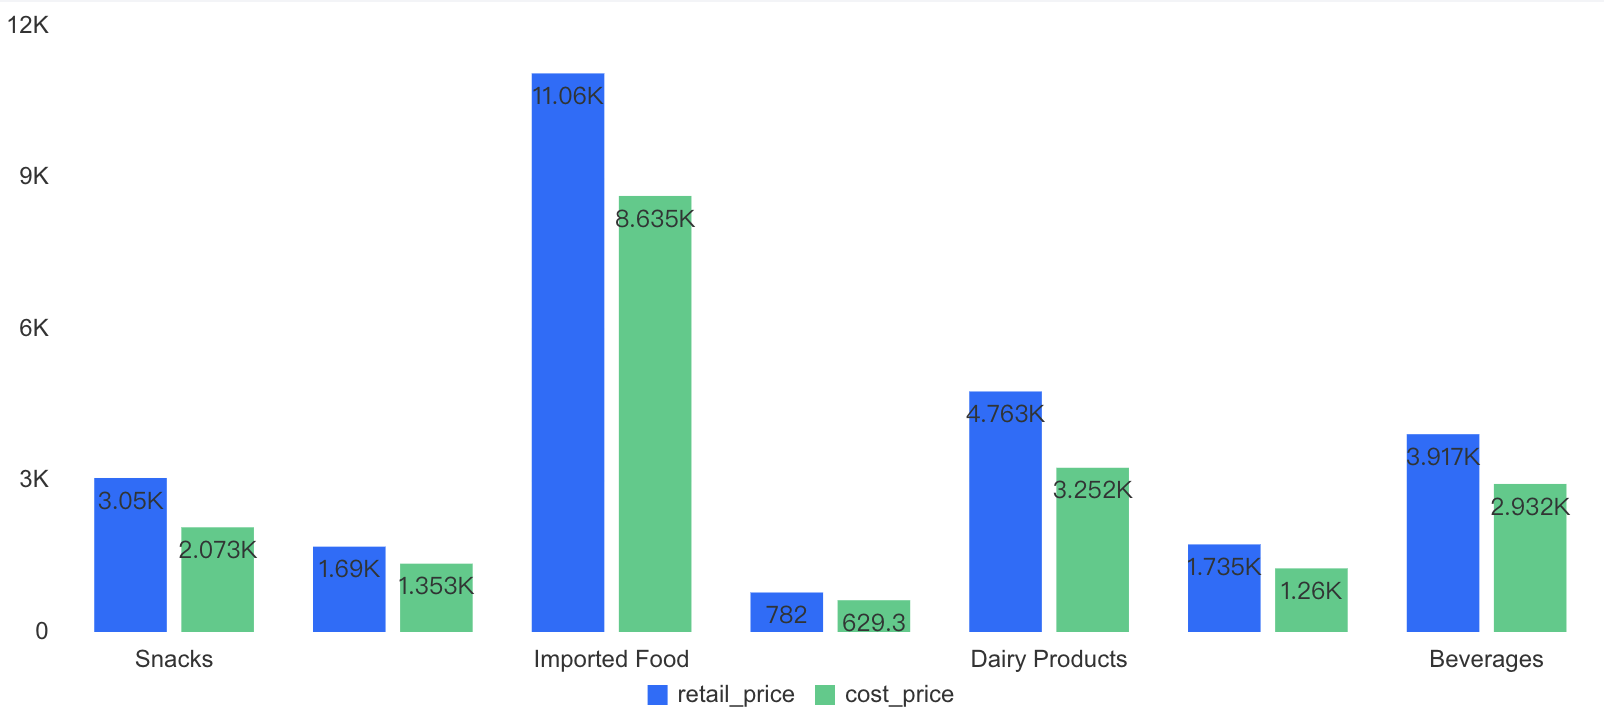 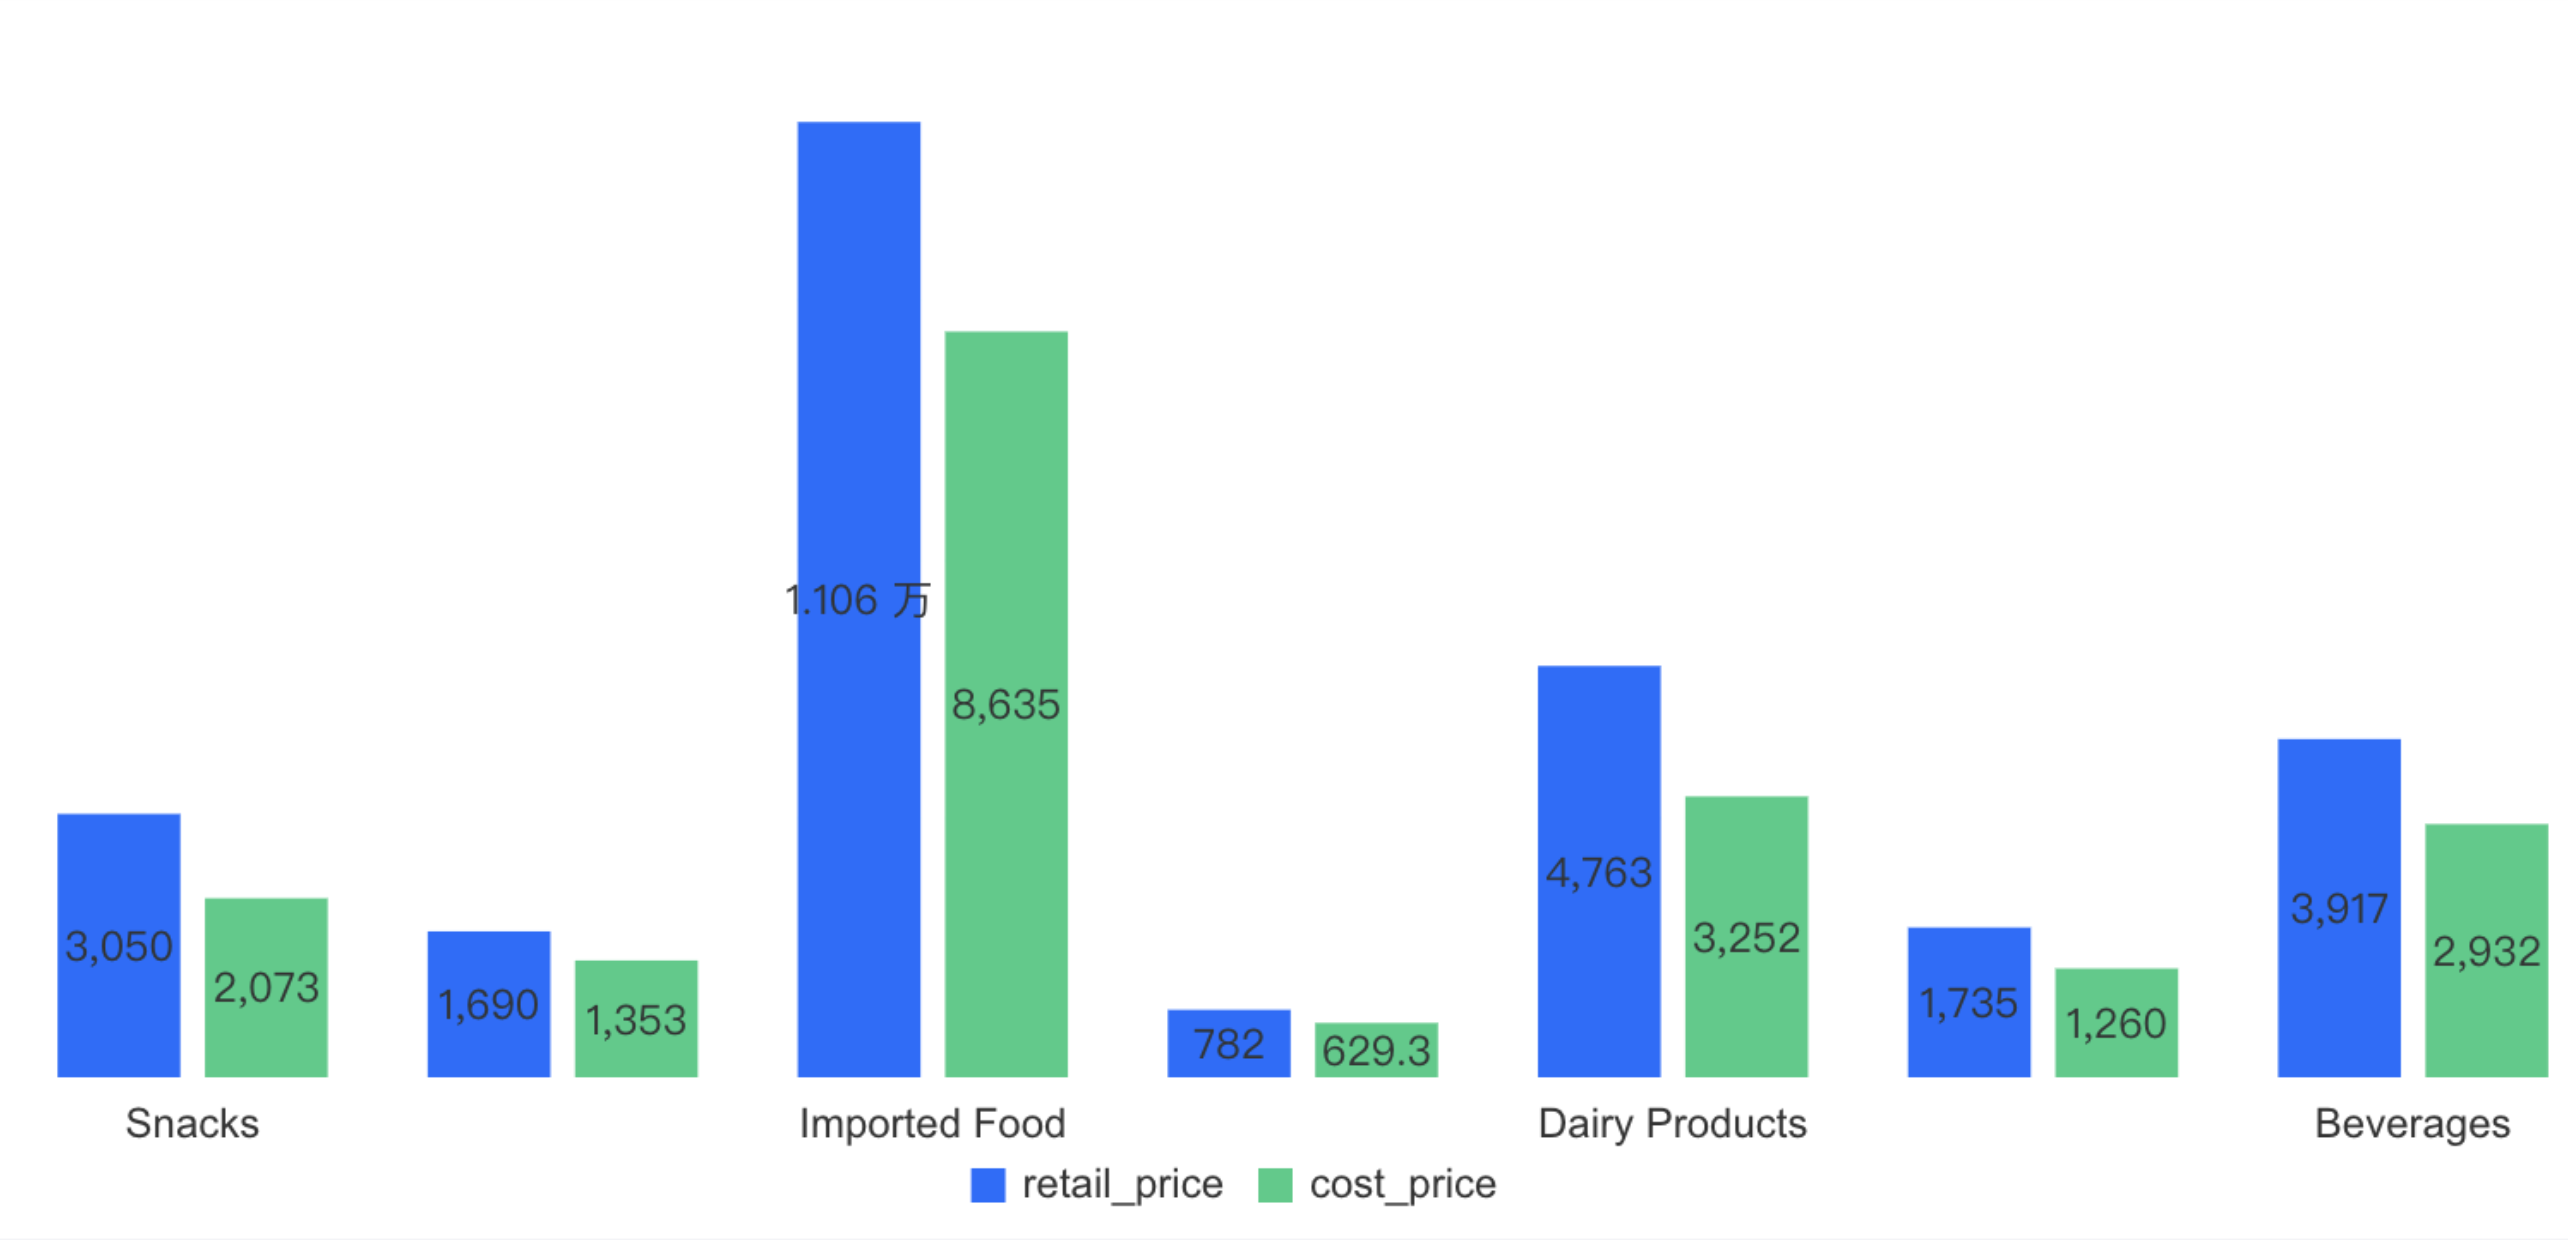 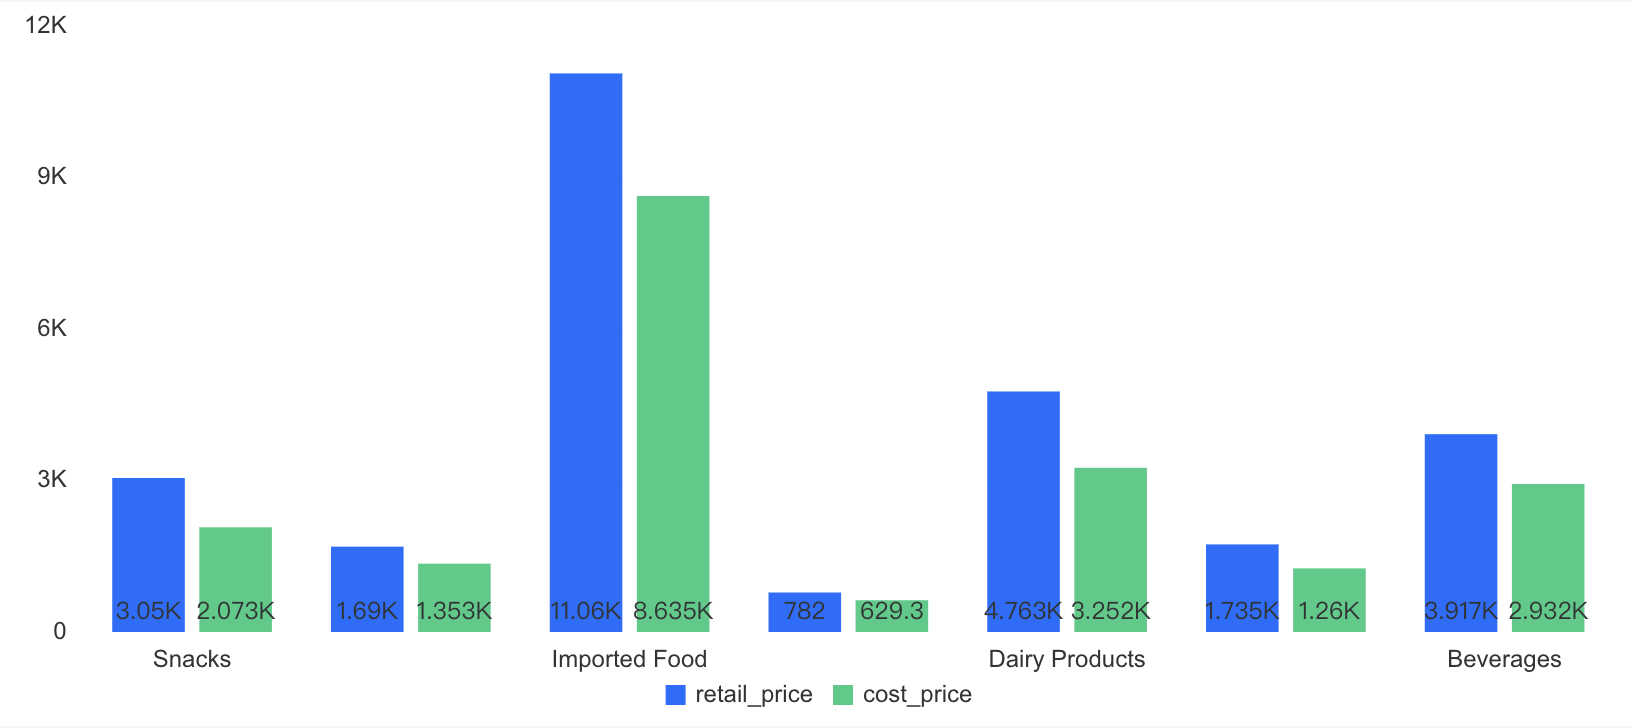 |
Percentage column chart, stacked column chart | Inside Top, Inside Center, Inside Bottom | 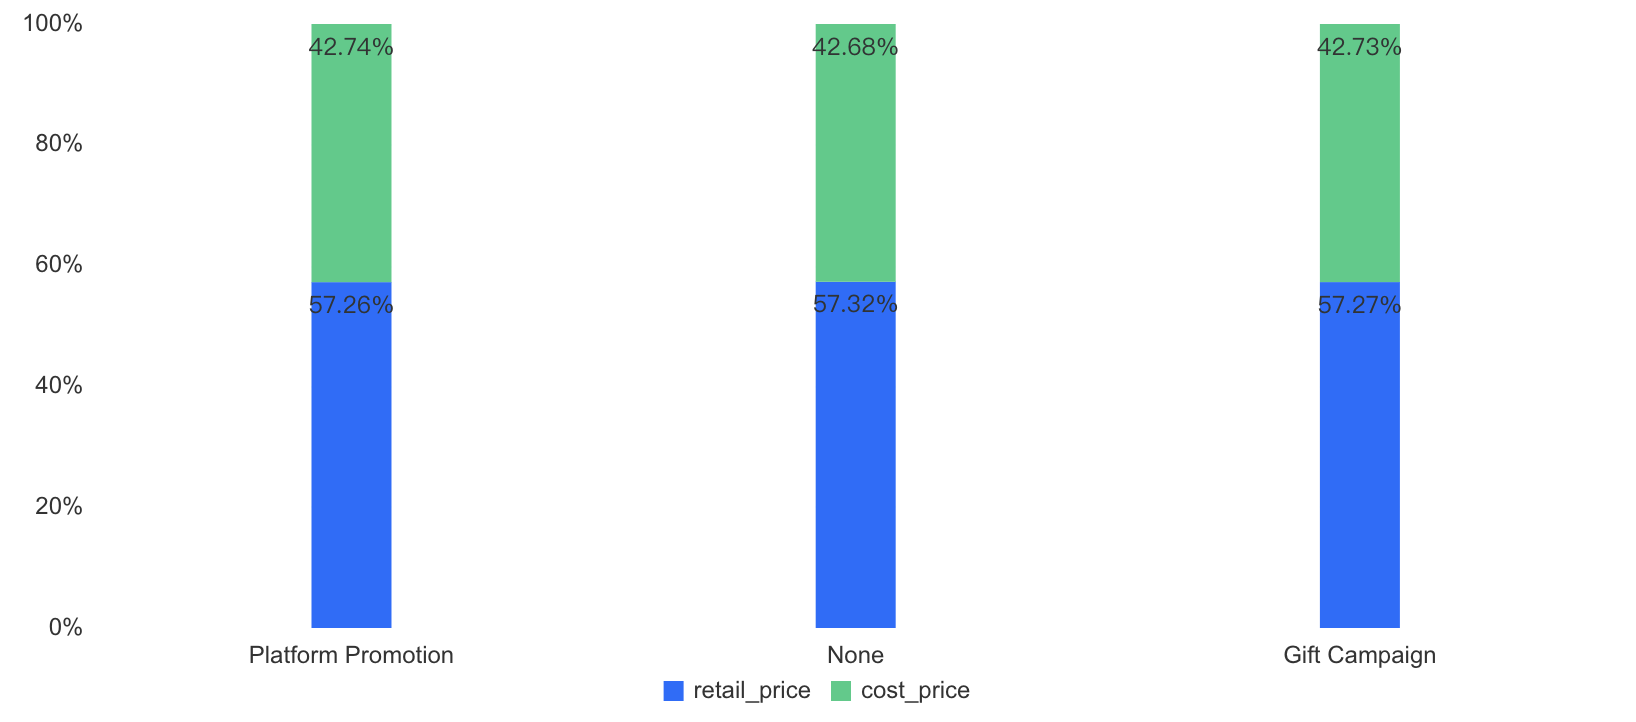 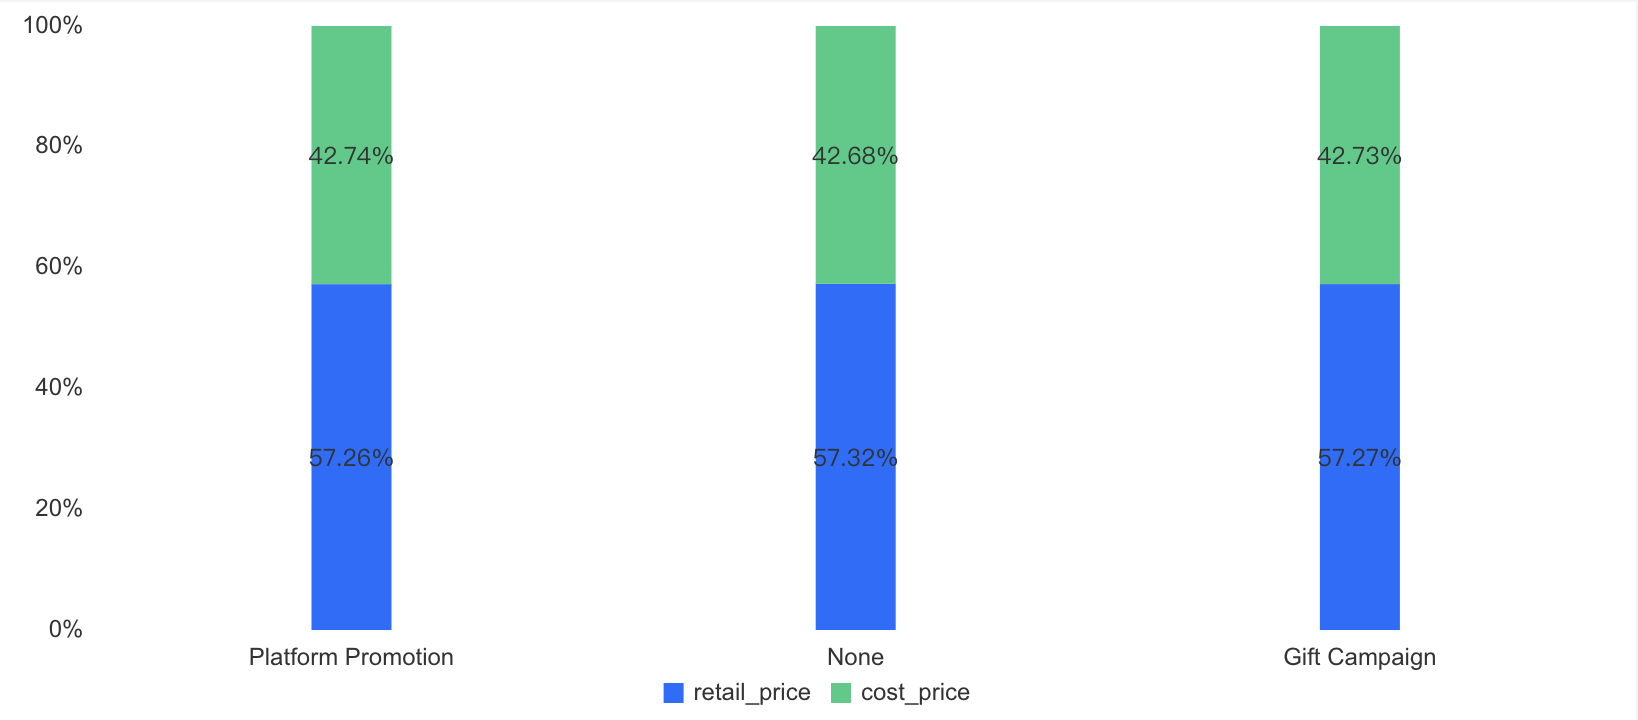 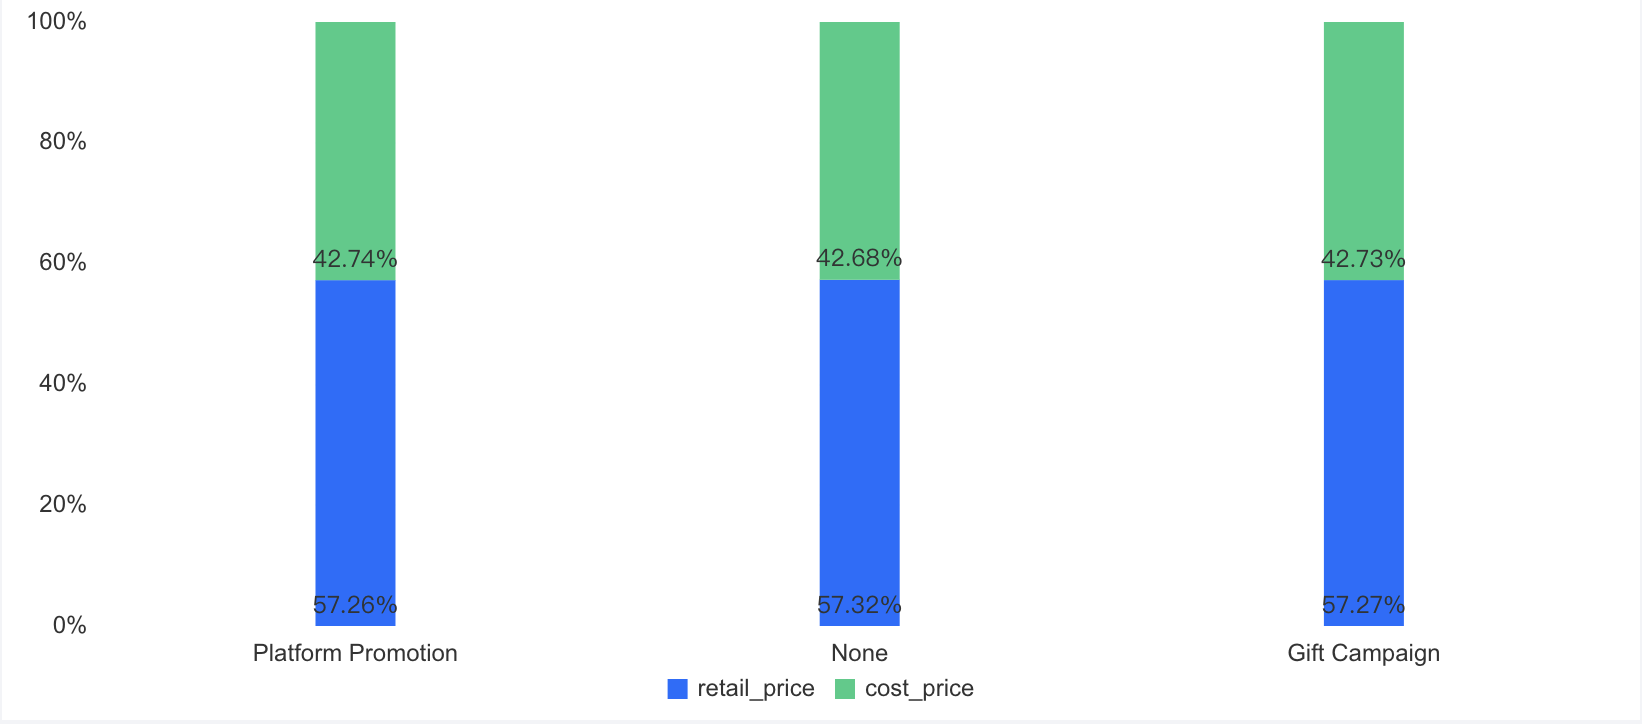 |
Percentage bar chart, stacked bar chart | Inside Left, Inside Center, Inside Right | 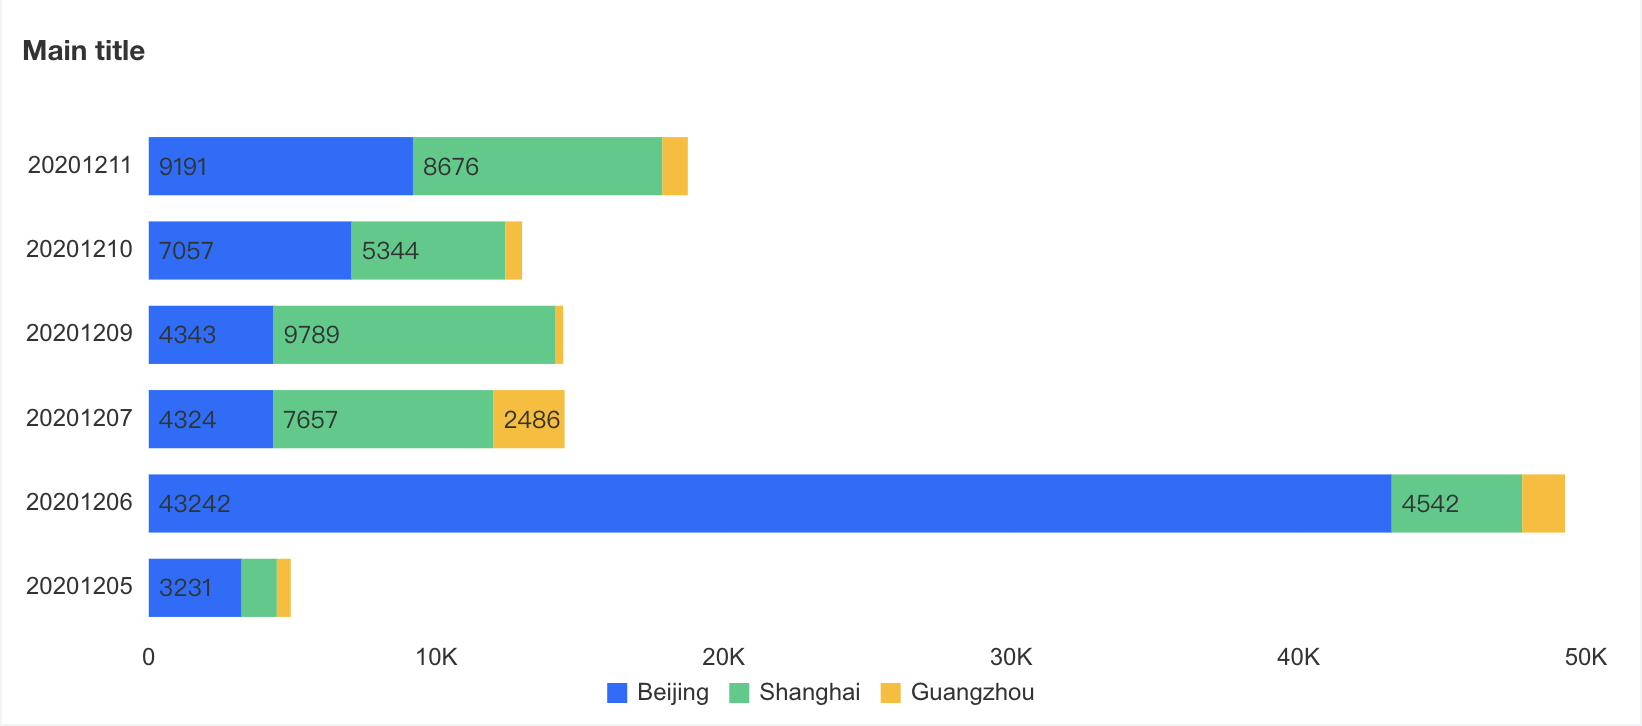 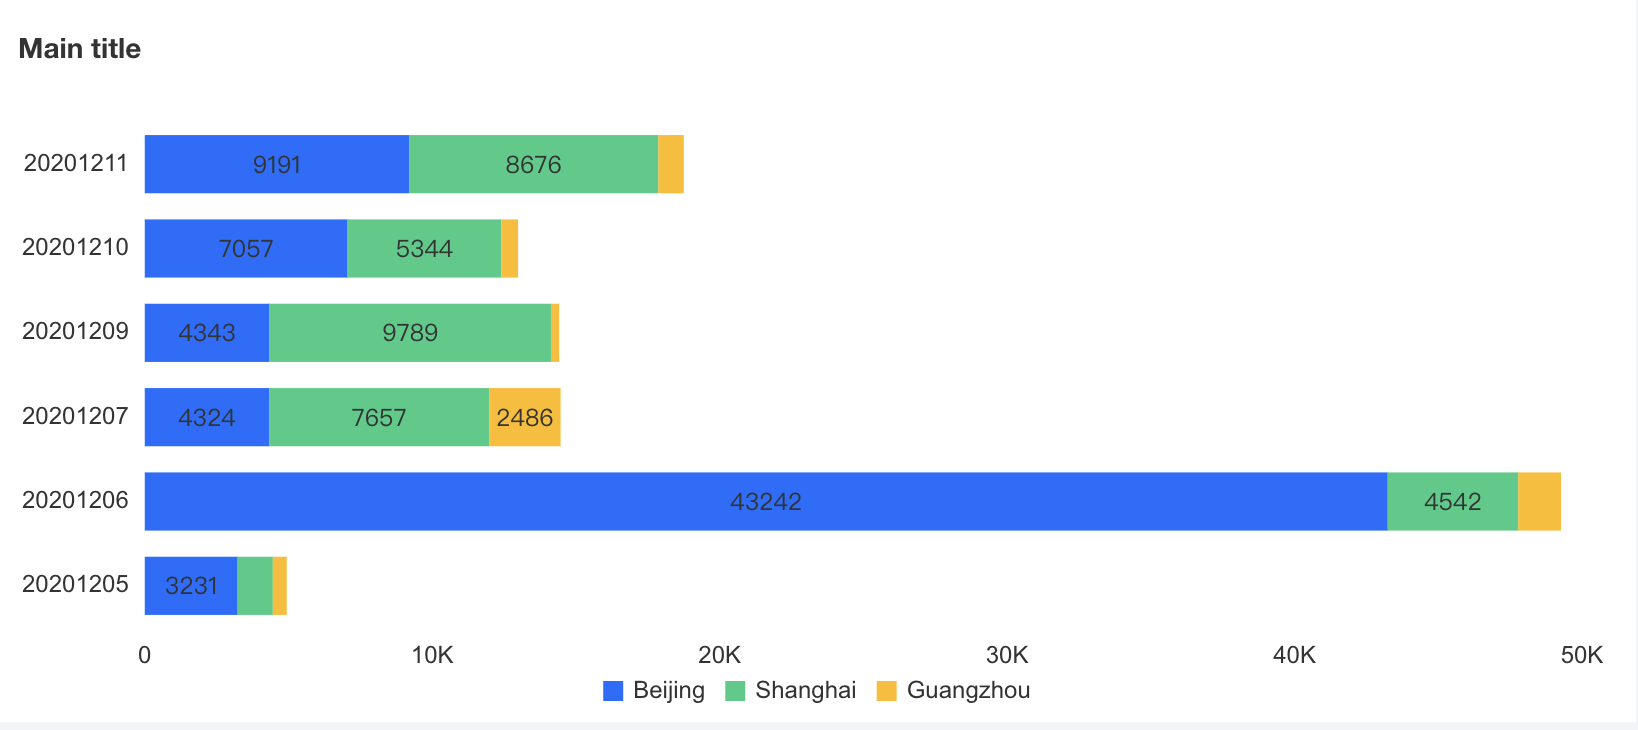 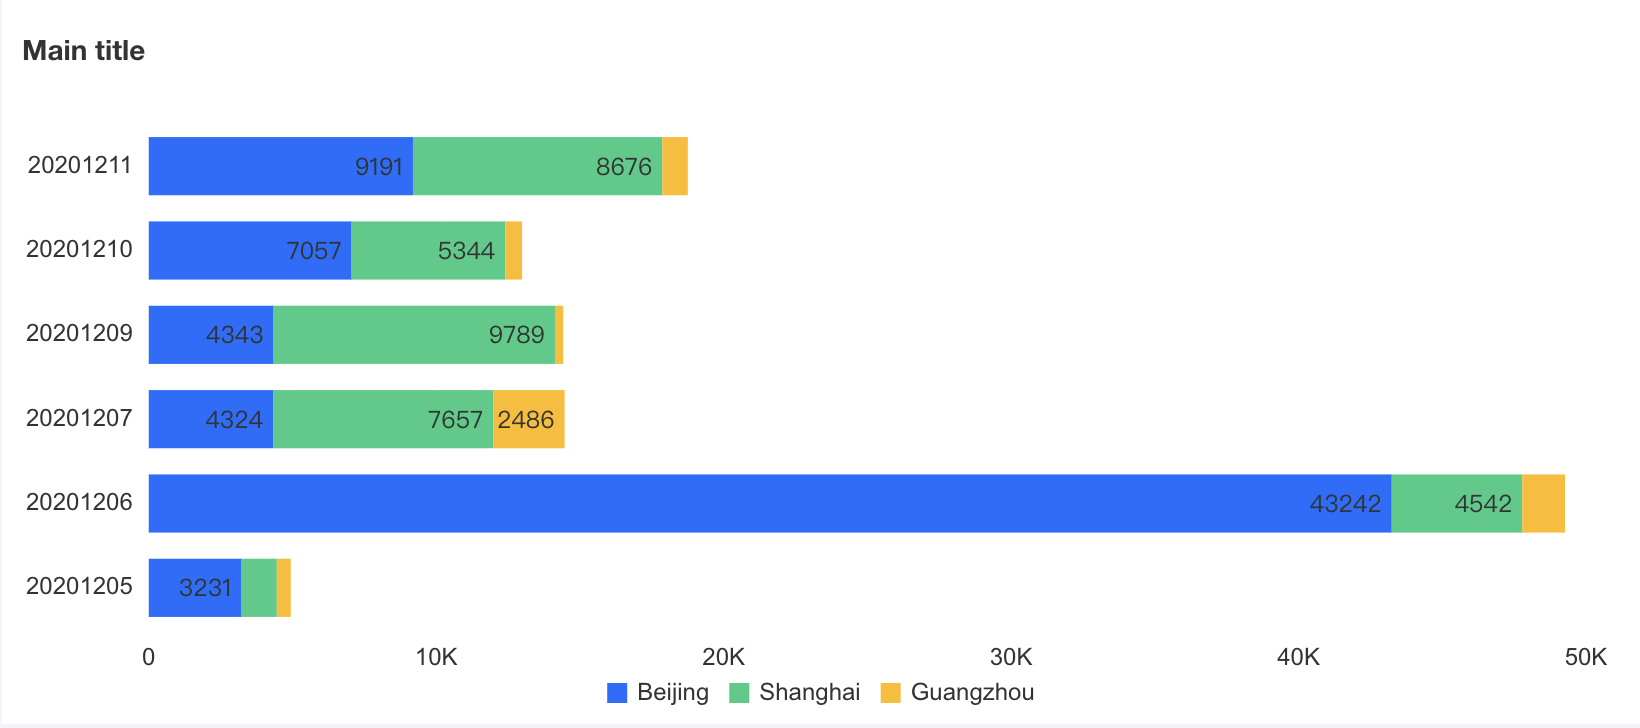 |
Tag Text Style
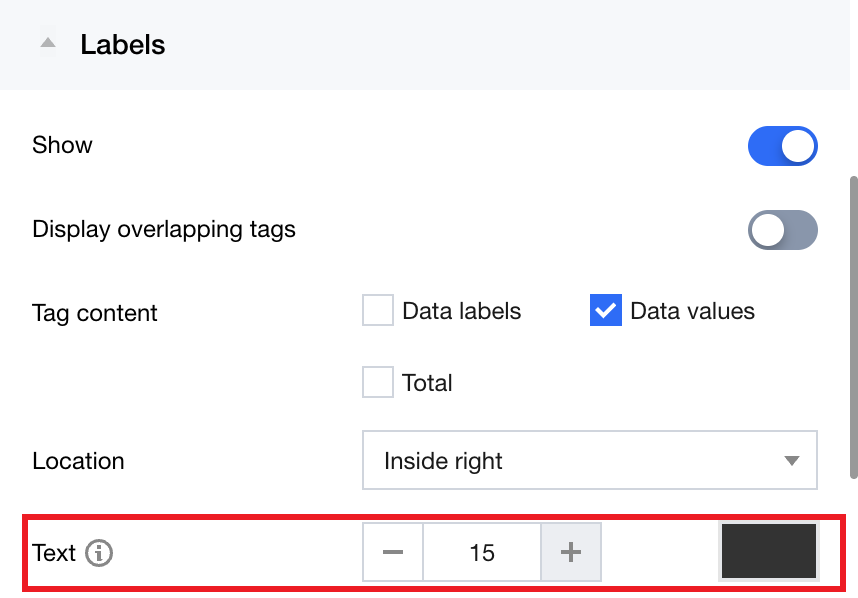
Support adjustments to tag text font size and color.
Series Settings
A chart is normally made up of data series. A series usually corresponds to a field in the dataset. For example, each line in a Line chart is a series, representing the performance of the same metric against different dimension values. Series settings support setting the position and text style individually for each field.
Note: After enabling full tag display, if tags partially overlap, you can also adjust the position and style of corresponding metrics tags individually to optimize the overall display effect.
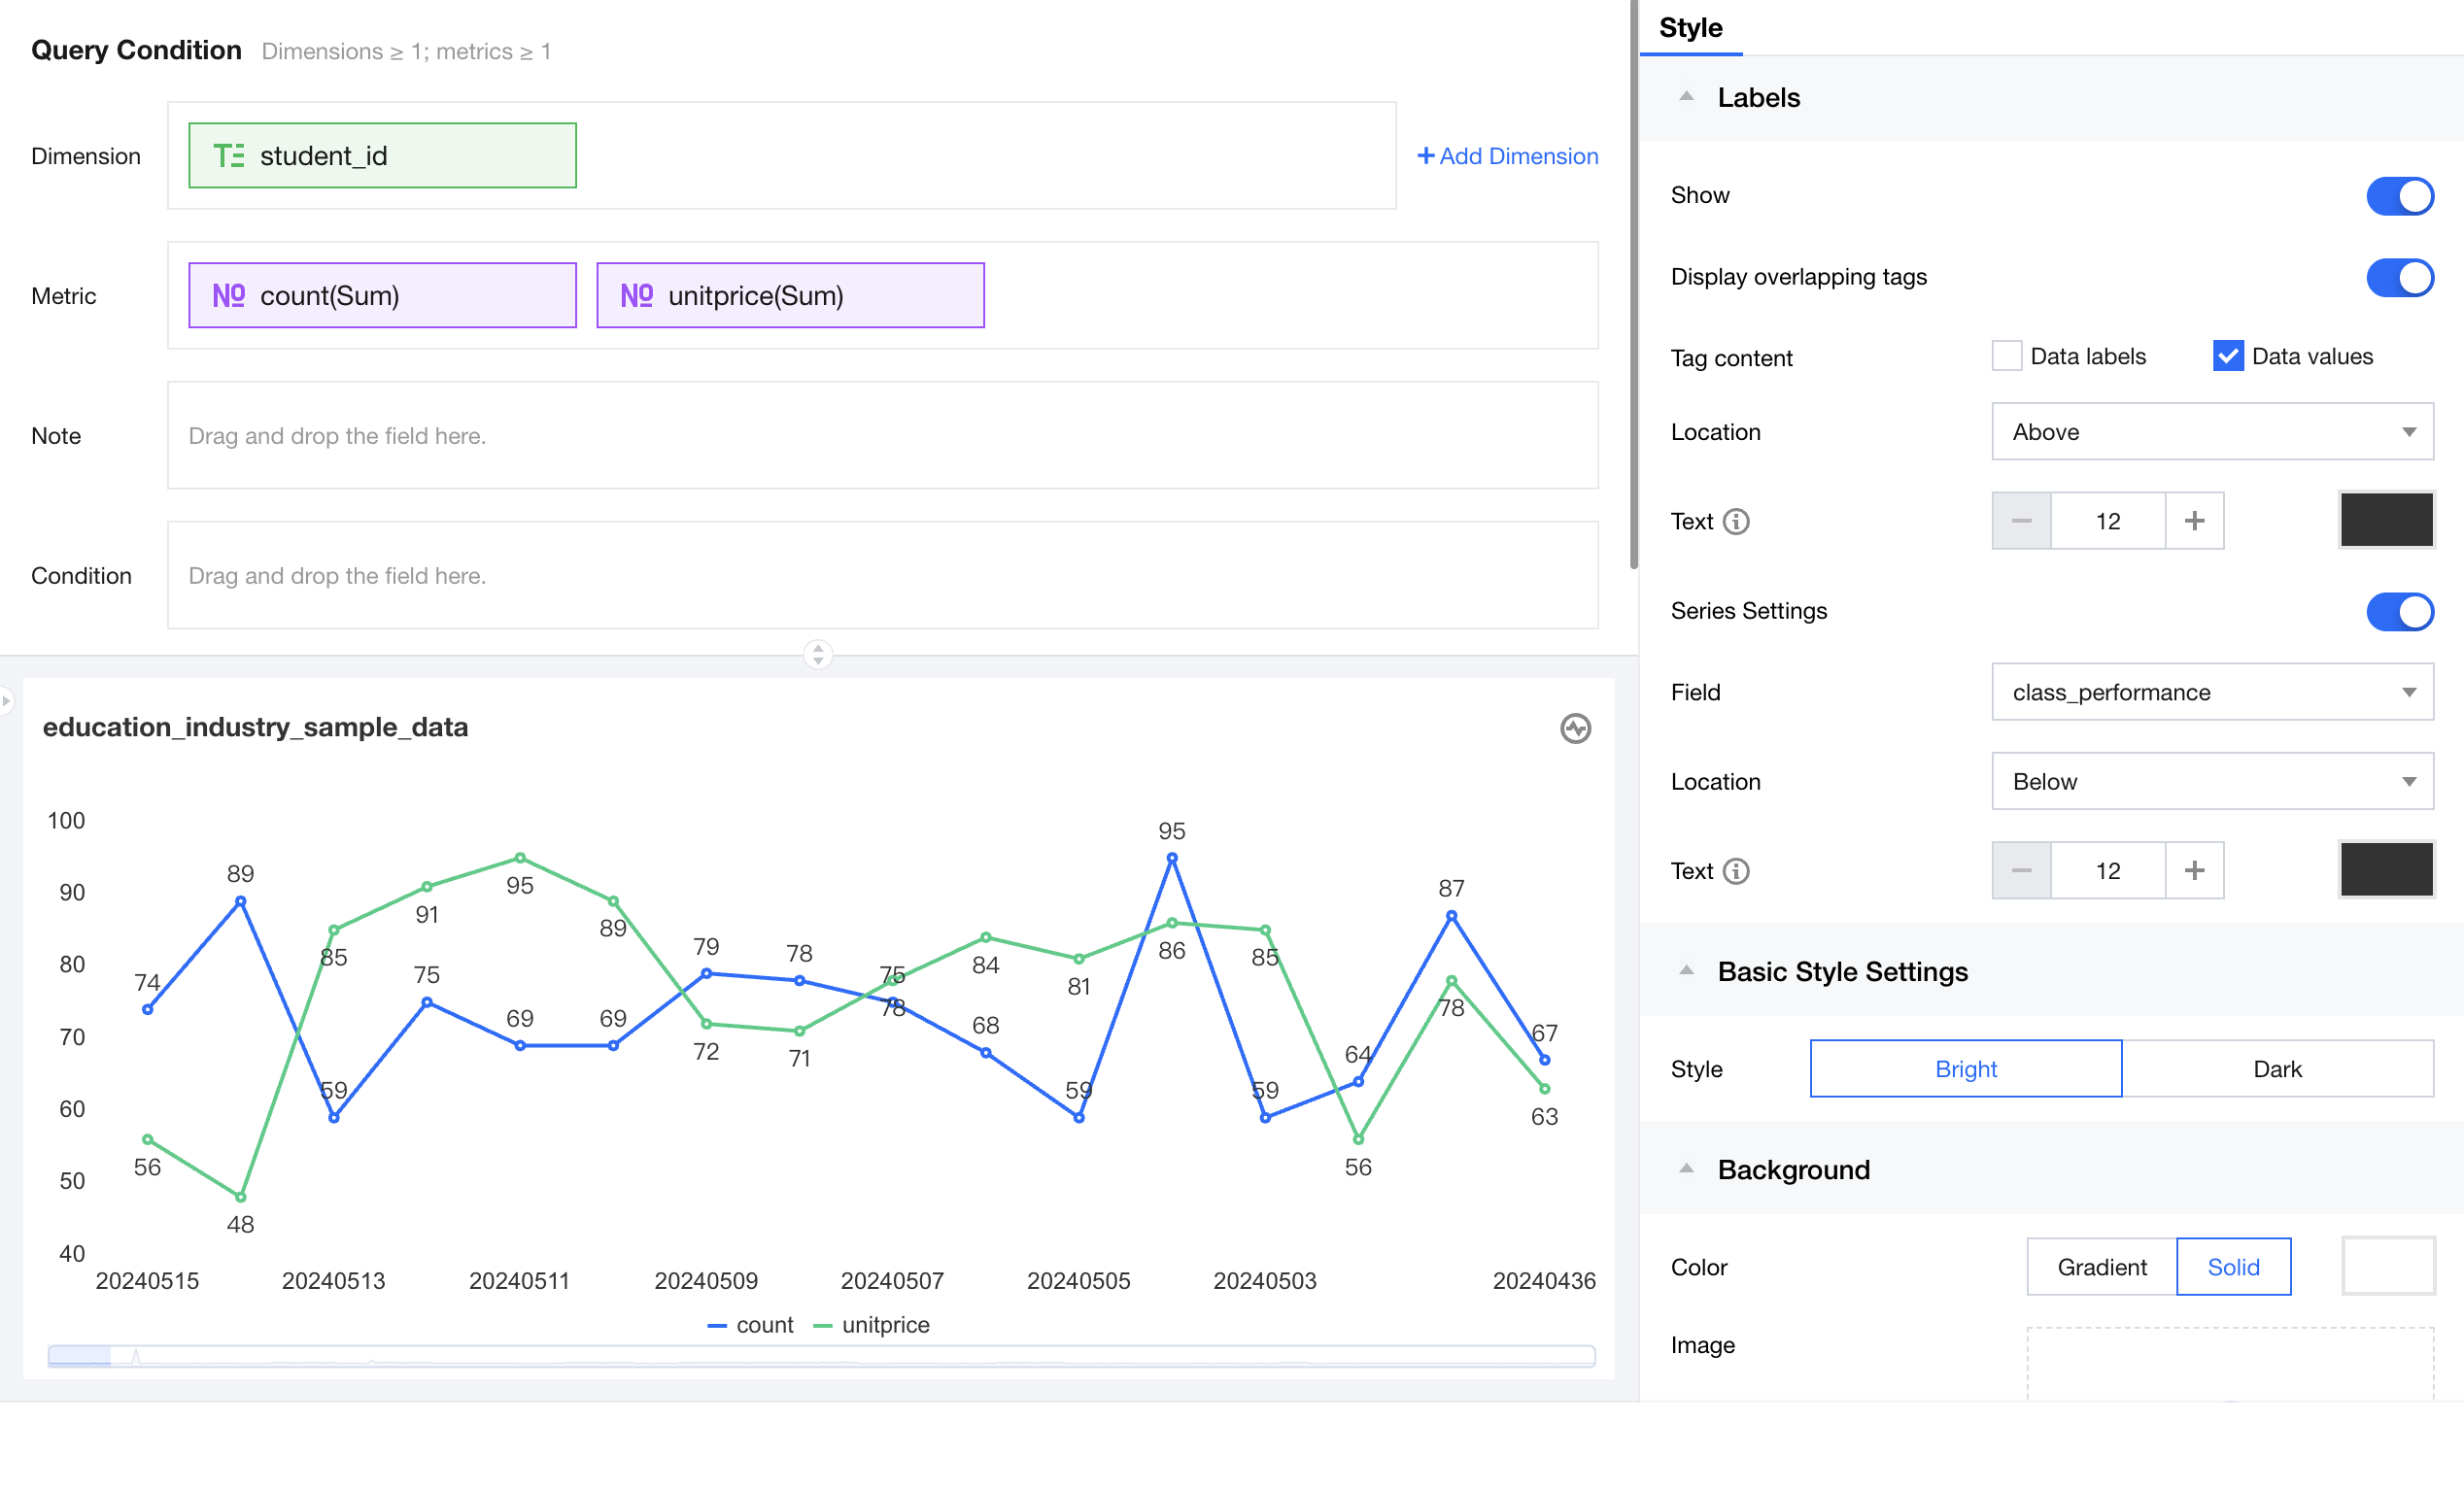
Example: When all default chart tags are displayed, overlap may occur. To address partial tag overlap and optimize the overall display effect, follow the steps below.
Start by selecting the field "unitprice", then adjust the tag position to below or above.
Help and Support
Was this page helpful?
You can also Contact sales or Submit a Ticket for help.
Help us improve! Rate your documentation experience in 5 mins.
Feedback