CLS Assists in Live Stream Troubleshooting
Download
Mode fokus
Ukuran font
Preparation
Purpose
Use Tencent Cloud Log Service (CLS) to ingest and analyze CSS access logs in real time. This enables you to quickly narrow down the root cause of streaming issues across the client, network, CDN, origin, and encoder (push), accelerating troubleshooting and improving operational efficiency.
Recommended Dashboards
How to use
Before running, replace these parameters:
{start_time}, {end_time} usually set via CLS time picker; only add explicit timestamp filters if required.{host} : domain name{streamname}{client_ip}{interval} (e.g., 1 minute / 5 minute — match your CLS syntax)Playback — Overview / Errors
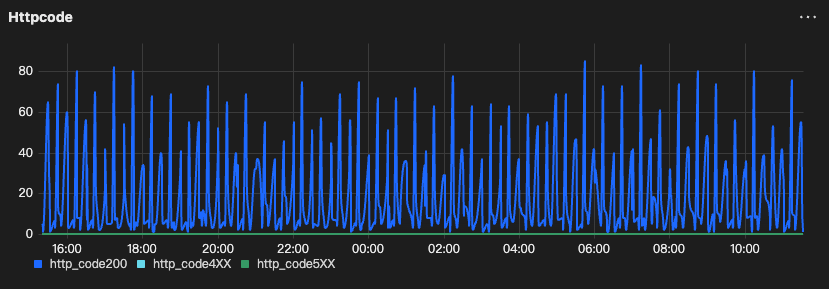
HttpCode Trend (200 vs 4xx vs 5xx)
Goal: Confirm error spike and classify 4xx vs 5xx.
Output: time bucket + counts of 200 / 4xx / 5xx.
type:"lvb"and host:"{host}"and streamname:"{streamname}"| selecthistogram(cast(__TIMESTAMP__ as timestamp), interval 1 minute) as analytic_time,sum(case when http_code = 200 then 1 else 0 end) as http_code200,sum(case when http_code >= 400 and http_code < 500 then 1 else 0 end) as http_code4XX,sum(case when http_code >= 500 then 1 else 0 end) as http_code5XXgroup by analytic_timeorder by analytic_timelimit 1000
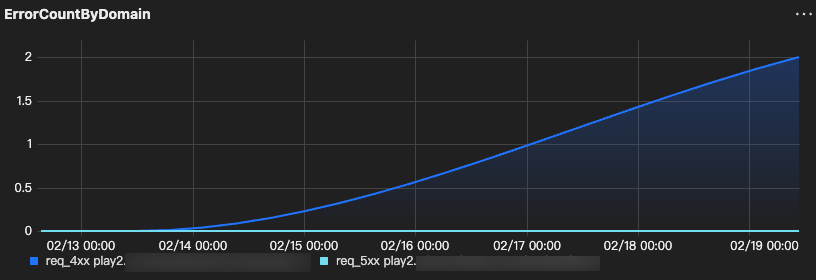
ErrorCountByDomain (req_4xx/req_5xx)
Goal: Find domain outliers.
Output: host + total requests + 4xx/5xx counts.
type:"lvb"| SELECThost,COUNT(*) AS req_total,COUNT_IF(http_code >= 400 AND http_code < 500) AS req_4xx,COUNT_IF(http_code >= 500 AND http_code < 600) AS req_5xxGROUP BY hostORDER BY req_5xx DESC, req_4xx DESCLIMIT 200
Playback — Latency / Loss
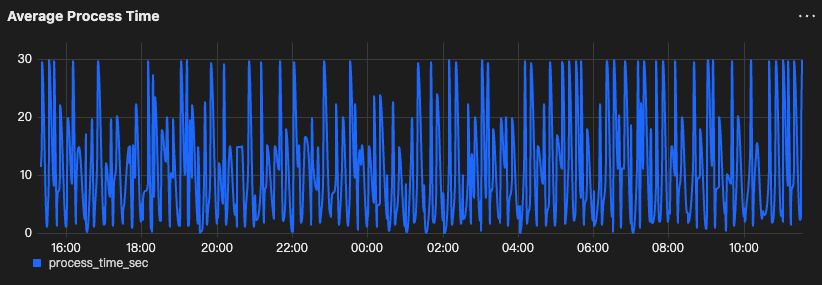
Average Process Time
Goal: Detect processing latency spike.
Output: time bucket + avg/max
process_time (sec).type:"lvb" and host:"{host}" and http_code=200 and streamname:"{streamname}"| select histogram( cast(__TIMESTAMP__ as timestamp),interval 1 minute) as analytic_time,avg(process_time)/1000.0 as process_time_secgroup by analytic_timeorder by analytic_timelimit 1000
RTT Trend
Goal: Detect network latency spike.
Output: time bucket + avg
rttNote:
keep / adjust the unit conversion depending on your field unit (some environments store rtt in ms already).
type:"lvb" and host:"{host}" and http_code=200 and streamname:"{streamname}"| select histogram( cast(__TIMESTAMP__ as timestamp),interval 1 minute) as analytic_time,avg( if(rtt='-', NULL, cast(rtt as double)) )/1000.0 as avg_rtt_msgroup by analytic_timeorder by analytic_timelimit 1000
Loss Rate Trend
Goal: Detect loss spike.
Output: time bucket + avg
lost_ratetype:"lvb"| SELECThistogram(CAST(__TIMESTAMP__ AS timestamp), interval 1 minute) AS time,host,AVG(IF(lost_rate = '-', NULL, CAST(lost_rate AS double))) AS avg_lost_rateGROUP BY time, hostORDER BY timeLIMIT 1000
Playback — Compare / Outliers
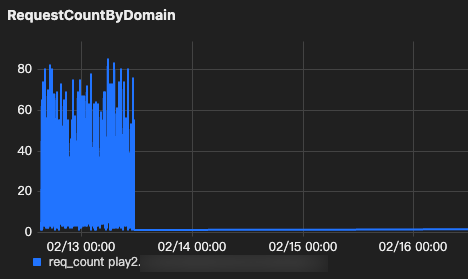
RequestCountByDomain
Goal: Compare traffic across domains.
Output: host +
request_counttype:"lvb"| selecthistogram(CAST(__TIMESTAMP__ AS timestamp), interval 1 minute) AS time,host,count(*) as req_countgroup by time, hostorder by timelimit 1000
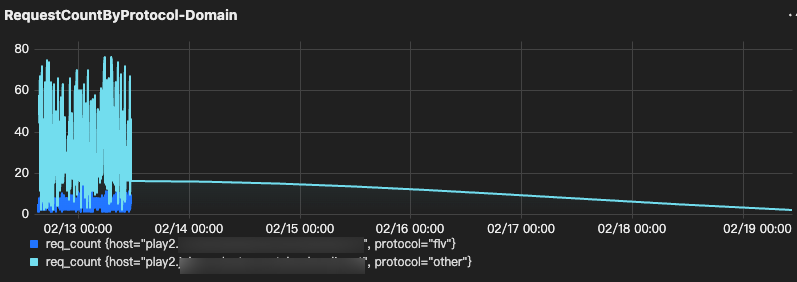
RequestCountByProtocol-Domain
Goal: Identify protocol-specific anomalies per domain.
Output: time bucket + host + protocol + request_count.
Note:
If your field name is not url, replace it (e.g., request_url, uri, path).
type:"lvb"| selecthistogram(CAST(__TIMESTAMP__ AS timestamp), interval 1 minute) AS time,host,casewhen url like '%.flv%' then 'flv'when url like '%rtmp%' then 'rtmp'else 'other'end as protocol,count(*) as req_countgroup by time, host, protocolorder by timelimit 1000
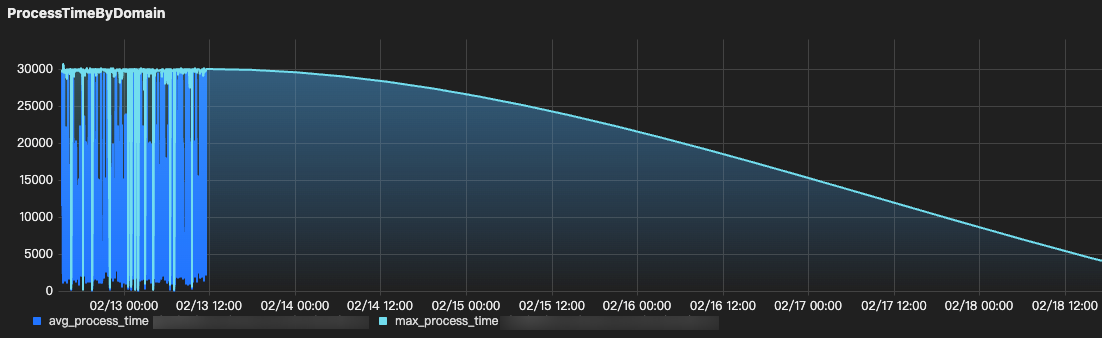
ProcessTimeByDomain
Goal: Compare processing latency across domains.
Output: time bucket + host +
avg/max process_time*| SELECThistogram(CAST(__TIMESTAMP__ AS timestamp), interval {interval}) AS time,host,AVG(process_time) AS avg_process_time,MAX(process_time) AS max_process_timeGROUP BY time, hostORDER BY timeLIMIT 1000
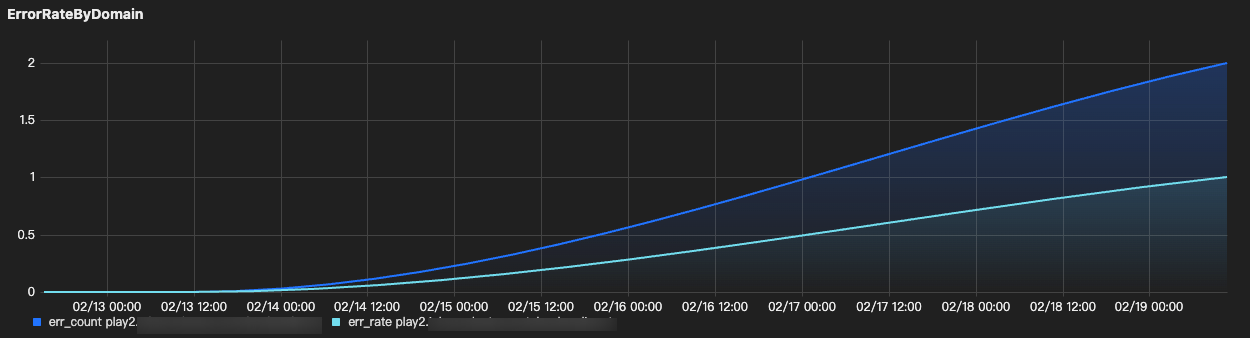
ErrorRateByDomain
Goal: Errors across domains.
Output: time bucket + host + success/error + avg rtt/loss
type:"lvb"| SELECThistogram(cast(__TIMESTAMP__ AS timestamp), interval 1 minute) AS time,host,SUM(IF(http_code >= 400 AND http_code < 600, 1, 0)) AS err_count,SUM(IF(http_code >= 400 AND http_code < 600, 1, 0)) * 1.0 / COUNT(*) AS err_rateGROUP BY time, hostORDER BY timeLIMIT 1000
Playback — Single User
SingleUserQuality (success/latency/loss/errors)
Goal: Evaluate one user’s playback quality.
Output: time bucket + success rate + avg rtt/loss + 4xx/5xx counts
type:"lvb"AND host:"{host}"AND streamname:"{streamname}"AND client_ip:"{client_ip}"| SELECThistogram(CAST(__TIMESTAMP__ AS timestamp), interval {interval}) AS time,client_ip,COUNT(*) AS req_count,ROUND(COUNT_IF(http_code = 200) * 100.0 / COUNT(*), 2) AS success_rate_pct,COUNT_IF(http_code >= 400 AND http_code < 500) AS err_4xx,COUNT_IF(http_code >= 500 AND http_code < 600) AS err_5xx,AVG(IF(rtt = '-', NULL, CAST(rtt AS DOUBLE))) / 1000.0 AS avg_rtt_ms,AVG(IF(lost_rate = '-', NULL, CAST(lost_rate AS DOUBLE))) AS avg_lost_rateGROUP BY time, client_ipORDER BY timeLIMIT 1000
Push — Quality
Note:
The bitrate formulas below assume
{interval} = 1m (60s).If you change
{interval} to 5m, update the divisor from 60 to 300.PushBitrateByStream
Goal: Detect bitrate drops/instability for push streams.
Output: time bucket + bitrate_kbps
*| SELECThistogram(CAST(__TIMESTAMP__ AS timestamp), interval 1 minute) AS time,CONCAT(host, ' | ', streamname) AS host_stream,ROUND(SUM(size) * 8 / 60.0 / 1000, 2) AS bitrate_kbpsGROUP BY time, host_streamORDER BY timeLIMIT 1000
AvgBandwidth_mbps
Goal: Detect uplink bandwidth drops/instability.
Output: time bucket + avg_bandwidth_mbps
*| SELECThistogram(CAST(__TIMESTAMP__ AS timestamp), interval 1 minute) AS time,host,ROUND(SUM(size) * 8 / 60.0 / 1000 / 1000, 3) AS avg_bandwidth_mbpsGROUP BY time, hostORDER BY timeLIMIT 1000
HTTP Status Code Trend (2xx vs 4xx vs 5xx)
Why did 4xx responses spike?
If 403 dominates: what to check
1. Playback authentication or signed URL mismatch.
A 403 often means the playback URL is invalid, expired, or does not match the playback authentication policy.
Verify txSecret / txTime.
Verify the expiration time and server clock.
Verify the domain’s Playback Authentication settings.
If using splicing live streaming, verify the URL signing rule and URL format.
Push & Playback (includes txSecret / txTime usage): See documentation.
Rule for Splicing Live Streaming URLs (URL signing rules/examples): See documentation.
Playback Authentication Configuration: See documentation.
2. Advanced content protection (if enabled)
If you enabled additional protection (e.g., remote token validation), confirm it’s not rejecting requests.
3. Referer or IP-based access control (if enabled)
These often cause 403 spikes after access control policies are enabled or changed.
Referer Configuration: See documentation.
IP Allowlist / Blocklist Configuration: See documentation.
4. Region-based access control (if enabled)
If playback region management is enabled, confirm the affected region is allowed. Region-based policies can cause 403 responses for users in specific locations.
If 404 dominates: what to check (CSS)
1. Confirm the playback URL is correct (domain / app / stream / suffix).
Many 404s are simply caused by an incorrect playback URL (wrong domain, wrong AppName/StreamName, or wrong suffix such as .flv / .m3u8).
2. Confirm the stream is actually live on CSS (push status).
If the stream is not being pushed, or the push has stopped, even a correct playback URL will return 404.
Verify in the console (Stream Management > Live Streams) and/or call DescribeLiveStreamState to check whether the stream is active / inactive / disabled: See documentation.
3. Check whether the stream was interrupted or ended.
A stream interruption or a stopped push can lead to 404 during playback (or 404 after a short delay).
Stream interruption records (console): See documentation.
Stream event API (push/interruption events): See documentation.
4. For HLS: determine whether 404 happens on .m3u8 or on .ts segments.
This split is critical because the root causes are different:
404 on .m3u8, most likely the stream is not live / does not exist / the path is incorrect.
404 on .ts, the client is requesting segments that are not present for the requested playback position (commonly due to a stale playlist/proxy caching, or seeking outside the available segment window).
HLS splits the stream into 5–10s segments and manages them via M3U8 playlists: See documentation.
If rewind/replay is required, use Time Shifting (CSS saves TS segments and allows specifying playback time via M3U8 parameters; the time range can be up to 6 hours). See documentation.
5. If Origin Server (origin-pull mode) is enabled
If the playback domain is configured with origin-pull, a 404 may actually mean the stream/resource is missing on the origin side.
Why did 5xx responses spike?
1. Confirm whether Origin Server (origin-pull mode) is enabled. Most 5xx spikes in playback are upstream/origin-related when origin-pull is on.
2. Identify which 5xx code dominates (500 vs 502 vs 503 vs 504) Different 5xx codes usually point to different upstream failure modes.
3. Correlate 5xx with latency and scope (blast radius)
Break down 5xx by host / streamname / url and check whether it correlates with higher processing time (upstream slowness often precedes 504/5xx).
4. If 503/504 aligns with traffic surge, confirm capacity/readinessLarge spikes may require advance coordination (otherwise you’ll chase symptoms).
Latency (mostly HTTP 200)
Why is latency high even though most requests return HTTP 200?
If protocol choice dominates, likely cause: You’re using HLS (M3U8), which naturally has higher latency (often 10–30s).
If you need low latency, switch playback to LL-HLS / WebRTC (based on platform support).
If you must use HLS, reduce segment settings (may increase stutter): See documentation.
We already use HTTP-FLV/RTMP, but latency is still high. What should we change?
Loss (mostly HTTP 200)
Why does playback stutter/freeze even though most requests return HTTP 200?
1. If
lost_rate dominates, likely cause: Viewer-side packet loss / unstable downstream network (lost_rate is only valid when type=leb).2. In CLS playback logs, filter
type=leb, then trend lost_rate and rtt3. Break down by
prov / isp / server_region to see whether loss is concentrated in a specific region/ISP.If loss is region/ISP-specific: move impacted viewers to LEB (WebRTC) for better weak-network resilience. See documentation.
If you need smoother playback under fluctuating bandwidth: enable Adaptive Bitrate (HLS/WebRTC only). See documentation.
If all viewers stutter (not region-specific): treat it as upstream-side (low upstream FPS / upstream congestion) and reduce bitrate/resolution or stabilize uplink. See documentation.
Compare / Outliers
Only one region looks abnormal while others remain normal. What should we check?
If a single region dominates (errors / latency / stalling), likely causes:
Playback domain acceleration region mismatch (traffic coming from a region not covered).
Region allow/block policy enabled (playback region management).
Protocol-specific issue limited to that region (blocked protocol / fallback behavior).
1. Acceleration region mismatch (domain-level).
Check the playback domain “Acceleration Region” configuration.
If the abnormal user region is outside the accelerated region, playback can fail or behave unexpectedly.
Region Configuration: See documentation.
Service Region: See documentation.
2. Region allow/block (most common “only one region breaks” config)
Check whether “Access Control by Region” (playback region management) is enabled.
Verify the abnormal region isn’t blocked / not included.
3. Protocol-specific impact
If the abnormal region correlates with one protocol (e.g., only HLS or only FLV), validate protocol enablement & player behavior:
Is the protocol blocked on the domain?
Is the player auto-falling back to another protocol in that region/device?
Blocking Playback by Protocol: See documentation.
Single User
Only one user reports buffering/latency/errors, but overall dashboards look normal. How do we verify and isolate?
1. Confirm it’s isolated:
2. In CLS Real-Time Log Analysis, filter by client_ip and the exact time range; review http_code.
If using LEB, also review rtt and lost_rate (LEB-only fields; type=leb).
3. Decision
High
rtt / lost_rate + mostly 200 → likely client network quality issue (Wi-Fi/ISP/route).Repeated 4xx/5xx -> follow the main RCA logic but scoped to that user (client_ip filter)
Push
Push bitrate drops / stream disconnects / upstream looks unstable. Is it uplink/network or encoder/config?
1. If push instability dominates, likely cause: Uplink congestion/packet loss, or encoder overload/misconfig causing bitrate/FPS fluctuations.
2. Check: Confirm whether the stream is active / inactive / forbidden around the incident window. See documentation.
3. Pull push-side metrics per stream and trend them: video bitrate / video FPS / audio bitrate / codec / client IP. See documentation. Field reference documentation.
4. If uplink/network suspected (bitrate drops + reconnects / instability): reduce push bitrate, stabilize uplink; upstream bandwidth too low can cause congestion. See documentation.
5. If encoder/config suspected (bandwidth looks stable but bitrate/FPS unstable): tune encoder settings; keep bitrate reasonable (Tencent suggests < 4 Mbps to avoid push lag). See documentation.
6. If uplink is lossy/long-distance: switch push protocol to SRT or RTMP over SRT for better loss resistance.
RTMP over SRT: See documentation.
SRT resilience example: See documentation.
Bantuan dan Dukungan
Apakah halaman ini membantu?
Anda juga dapat Menghubungi Penjualan atau Mengirimkan Tiket untuk meminta bantuan.
masukan