Filter data in all charts on the dashboard by specifying the field value. If statistics is enabled in the index configuration of the log topic for the filter field, the field value can be automatically obtained as a list item.
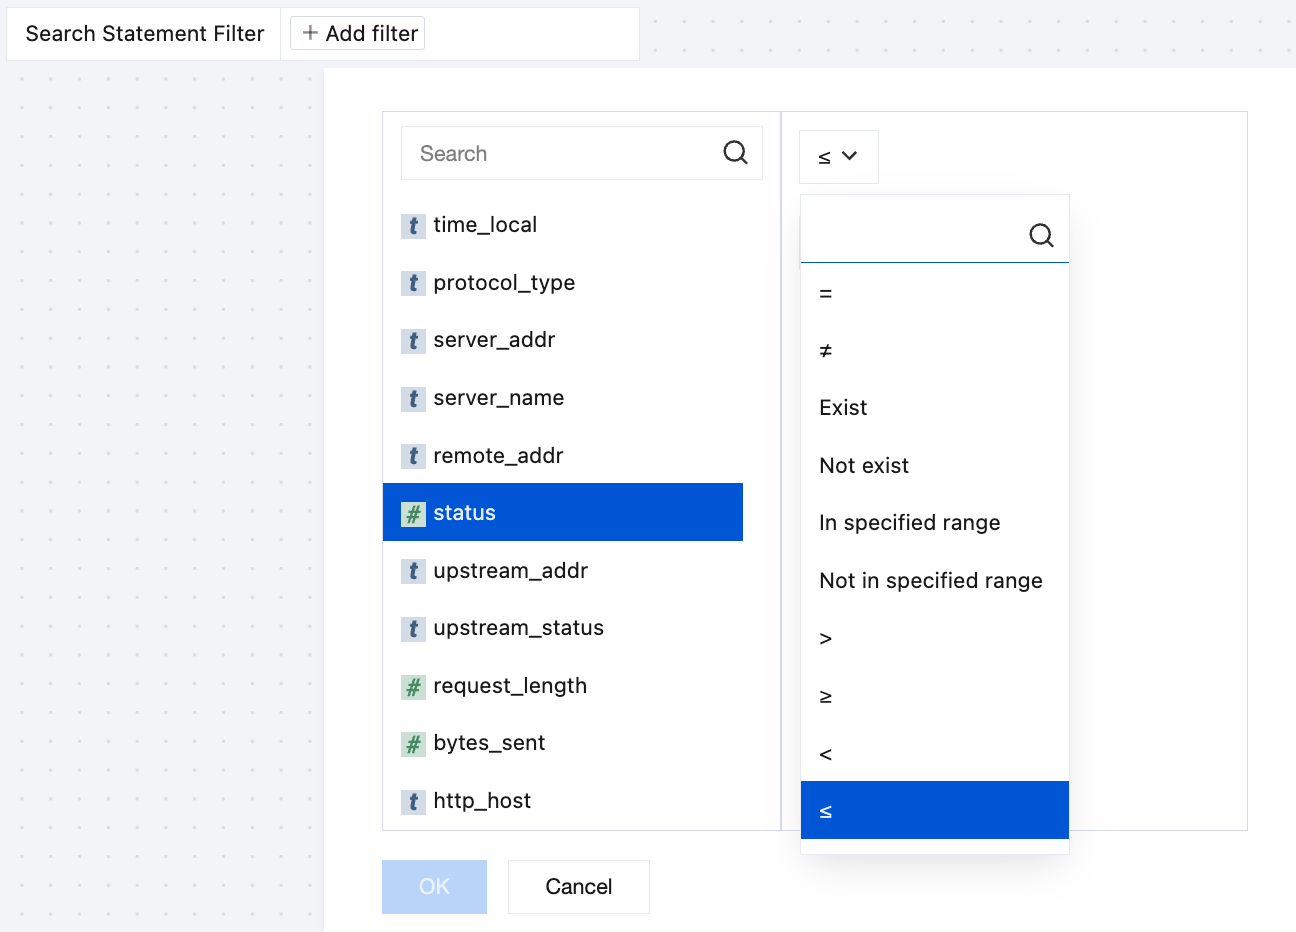
Filter data in all charts on the dashboard by entering a search statement, that is, add a filter in the query statement of the charts.Filter by search statement includes filter by range, NOT, and full text.
A data source variable enables batch switching data sources of the charts on the dashboard. It is applicable to scenarios such as applying a dashboard to multiple log topics and comparing data in blue and green on the dashboard.
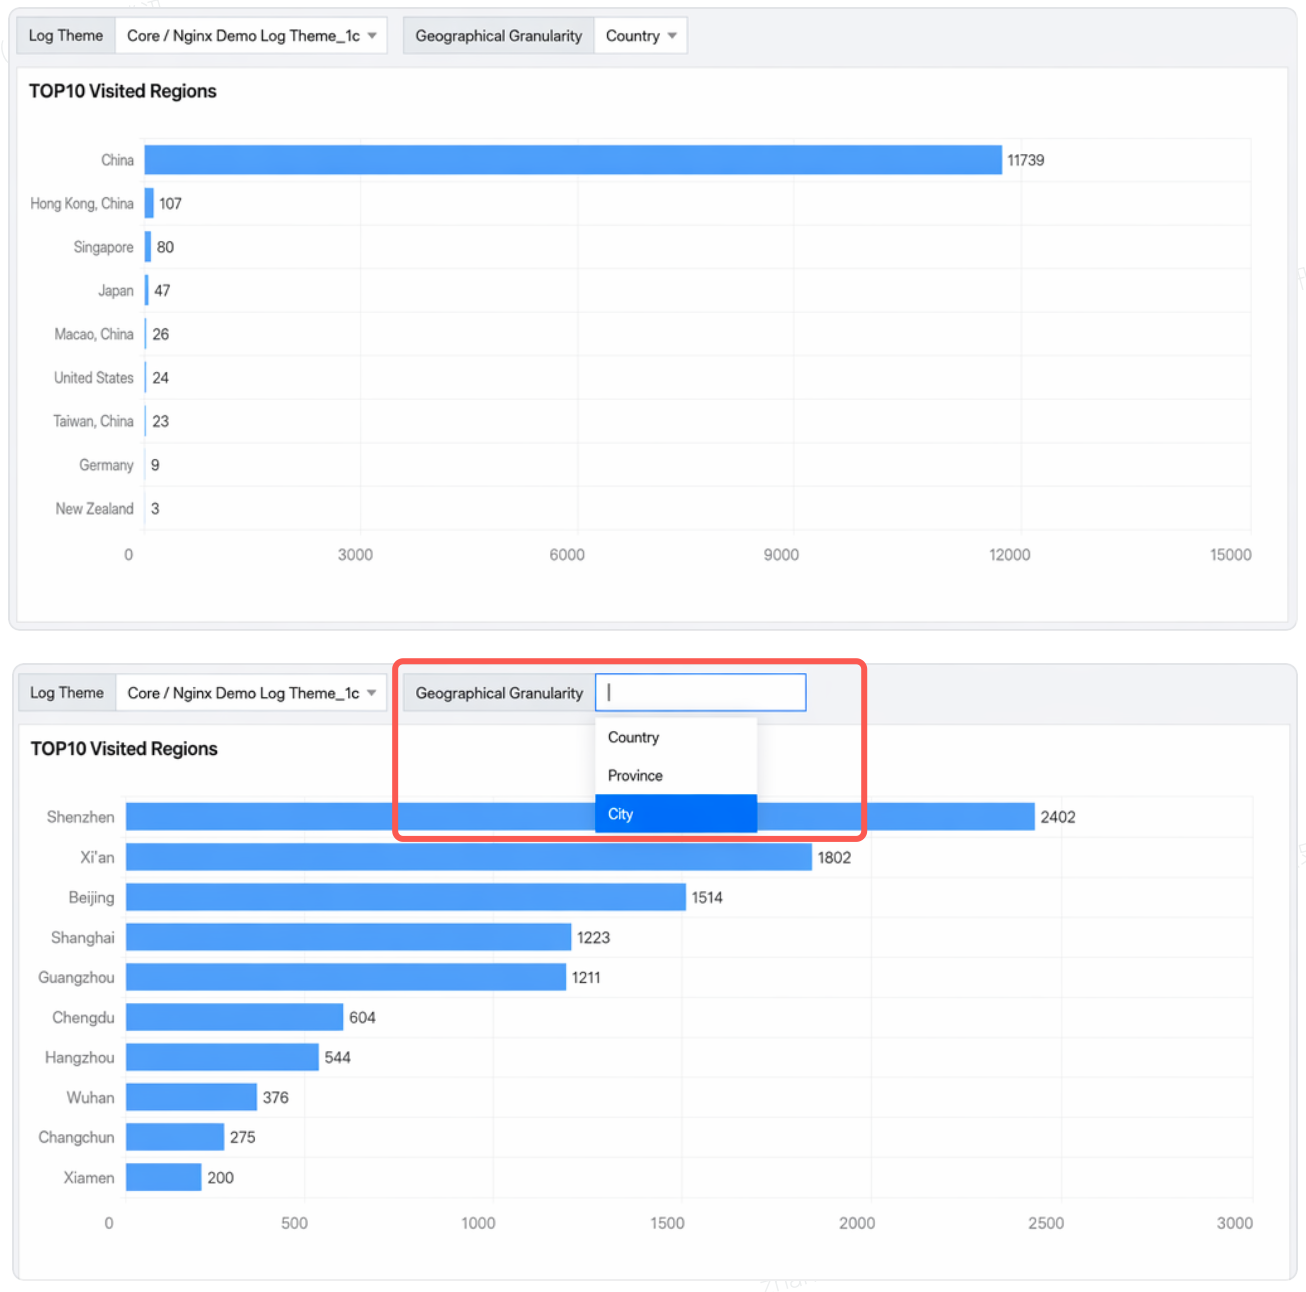
A custom variable can be set to a static input or a value from a dynamic query and applied to search statements, titles, and text charts for quick batch statement modification.
System preset variables can be directly referenced in statements without configuration, automatically replacing the corresponding fields in the statements. They are applicable in scenarios requiring adaptive time granularity and automatic obtaining of the current time range.
2. On the left sidebar, click Dashboard > Dashboard List to enter the dashboard management page.
3. Click the ID/name of the dashboard to be operated, click Edit, and go to the dashboard details page.
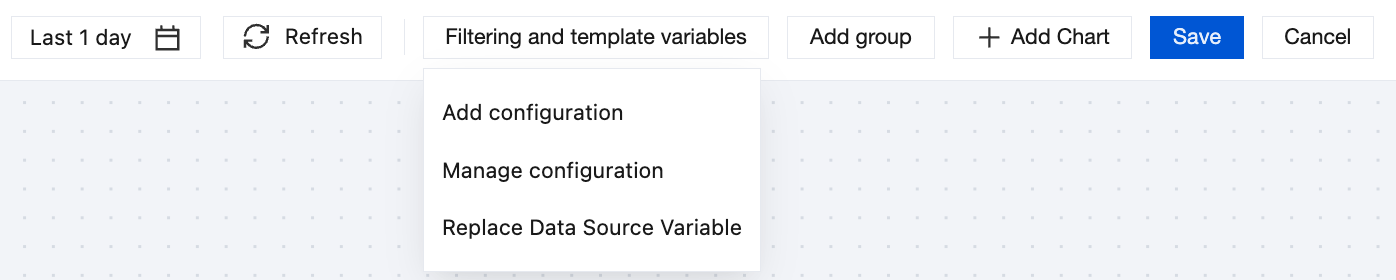
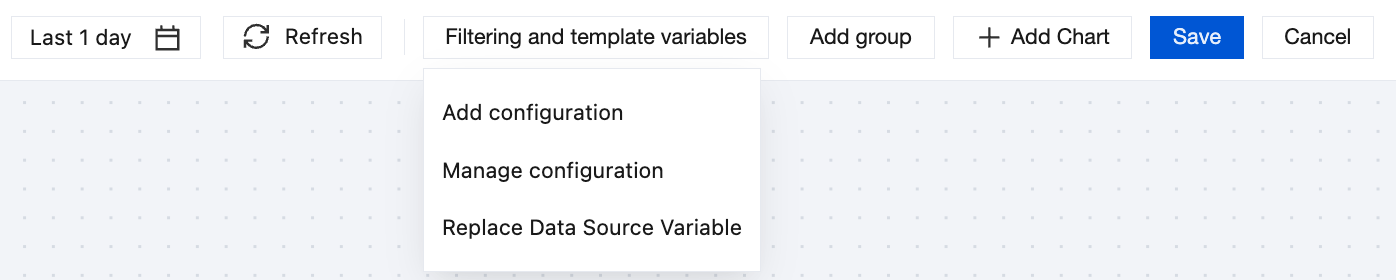
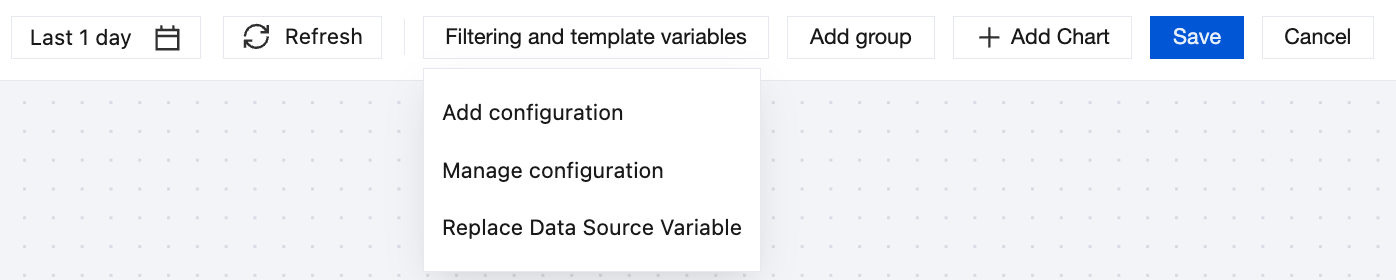
4. Click Add configuration at the top to enter the settings page.
5. In the pop-up window, configure the filter in the drop-down list and click OK.
Form Element
Description
Type
Different types correspond to different configuration items and application scenarios. Here, select **Filter in the drop-down list**.
Filter Alias
It is the filter name displayed on the UI, which is optional. If it is left empty, the filter field will be used automatically.
Log type
It is the log topic to which the filter field belongs.
Filter field
It is the object field to be filtered.
Dynamic options
After it is enabled, the filter field value will be obtained automatically as the filter option.
Cascading Filter
Select the parent filter field to which the current filter field is cascaded. After configuration, only filter items that meet the parent filter condition will be displayed. Common examples include fields with cascading relationships, such as country and province.
Static options
A static option is optional, needs to be added manually, and will be always displayed. You can configure its alias.
Default Filter
(Optional) Used to configure default filter items when the dashboard is initially viewed.
Default Filter Method
Used to configure the default filter mode for the filter when the dashboard is viewed. You can select Include or Exclude. Include is used by default.
Multiple items
After it is enabled, multiple filters can be selected as the filter condition.
6. Return to the dashboard details page, click Add Filter, and select a filter item. The dashboard data will be refreshed to show the filtered content, and you can switch between including or excluding the filter item.
7. After the configuration is complete, click Save.
2. On the left sidebar, click Dashboard > Dashboard List to enter the dashboard management page.
3. Click the ID/name of the dashboard to be operated, click Edit, and go to the dashboard details page.
4. Click Add configuration at the top to enter the settings page.
5. In the pop-up window, set the information of the filter by search statement and click Submit.
Form Element
Description
Type
Different types correspond to different configuration items and application scenarios. Here, select Filter by search statement.
Filter name
The name of the filter, which should be unique and cannot be duplicated.
Filter alias
(Optional) The display name of the filter on the interface.
Log Topic
The log topic from which the filter field is sourced.
Mode
The input mode for search statements, supporting both interactive mode and statement mode.
Default filter
(Optional) Used to configure default filter items when the dashboard is initially viewed.
6. Return to the dashboard details page, click Add Filter, and select a filter item. The dashboard data will be refreshed to show the filtered content.
Search statement filter supports: more diverse filtering methods, such as range filtering, NOT filtering, and full-text search.
7. After the configuration is complete, click Save.
2. In the left sidebar, choose Dashboard > Dashboard List to go to the dashboard management page.
3. Click the ID/name of the dashboard to be operated, click Edit, and go to the dashboard details page.
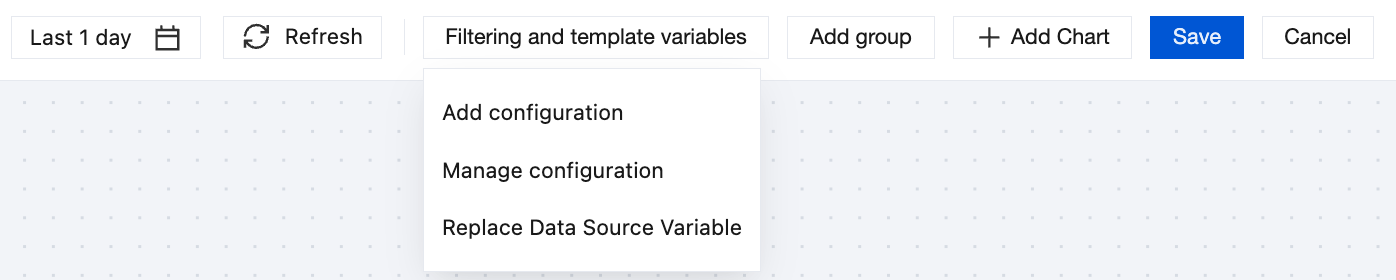
4. Click Filters & Variables at the top, select Add Filter & Variable, and open the settings page.
5. In the pop-up dialog box, enter the template variable information and click OK.
Form Element
Description
Type
The category of the variable. Different categories correspond to different configuration items and application scenarios. Select Data Source Variable here.
Variable Name
The name of the variable used in search statements. Only letters, digits, and _ are supported.
Variable Alias
(Optional) The display name of the variables on the dashboard. If left empty, the variable name will be used by default.
Data Source Type
The type of the data source. You can select Log Topic, Metric Topic, or Cloud Product Monitoring.
Data source Scope
The scope of selectable topics. The default value is All. You can select Custom Filter to set filter conditions and view only the topics that meet the conditions.
Default log Topic
The data source used by default when a user views the dashboard.
6. Return to the dashboard details page, and click
> Edit in the upper right corner of the chart.
Notes:
If there are no charts on your dashboard, add charts.
7. When editing a chart, locate Data Source, select Data Source Variable, and then choose the newly created data source variable.
8. Return to the Dashboard Details page. Click the data source variable dropdown list at the top to switch to a different log topic. The charts using this variable will automatically update their data source.
2. In the left sidebar, choose Dashboard > Dashboard List to go to the dashboard management page.
3. Click the ID or name of the dashboard to be operated to go to the dashboard details page.
4. Click Filters & Variables at the top, select Add Filter & Variable, and open the settings page.
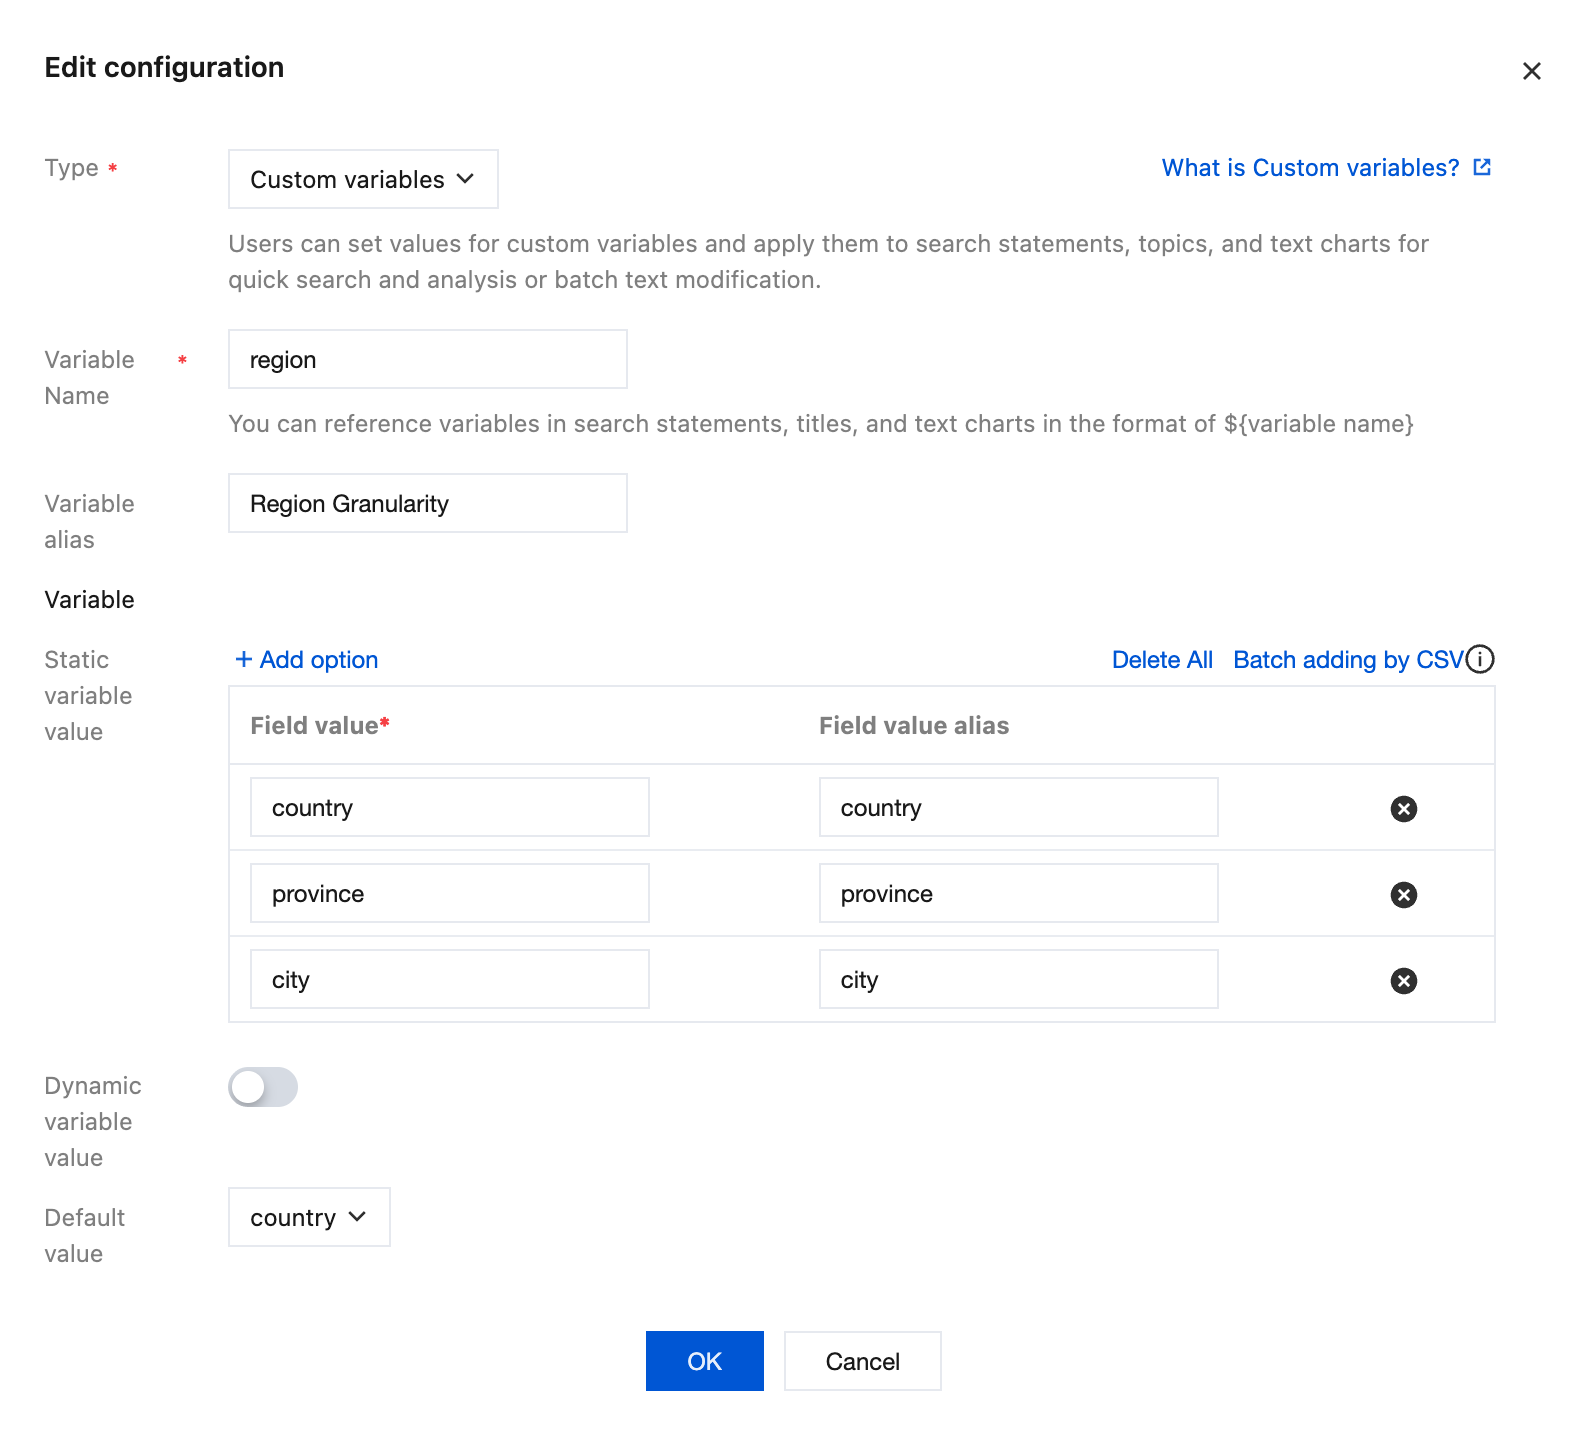
5. In the pop-up dialog box, enter the Custom Variable information and click OK.
Form Element
Description
Type
The category of the variable. Different categories correspond to different configuration items and application scenarios. Select Custom Variable here.
Variable Name
The name of the variable used in search statements. Only letters and digits are supported. A variable is referenced in the format of ${variable name}.
Variable Alias
(Optional) The display name of the variables on the dashboard. If left empty, the variable name will be used by default.
Static variable value
Manually add static variable values. These values will be displayed permanently and support alias configuration.
Dynamic variable value
After enabling this option, you can select log topics and metric topics.
Select a log topic as the variable source: Enter a search and analysis statement, and use the search and analysis results as the optional variable values. For example, to automatically query the values of the remote_addr field in logs as options, the query statement is: * | select remote_addr group by remote_addr limit 100. For syntax, see Syntax Rules.
Select a metric topic as the variable source: The variable can be a metric name, a dimension of a metric, or a dimension value, and can be configured as needed.
Default Value
(Required) The variable value used by default.
6. Return to the dashboard details page, and click
> Edit in the upper right corner of the chart.
Notes:
If there are no charts on your dashboard, add charts.
7. On the Search Statement tab of Edit Chart, insert the created custom variable ${interval} to replace the original text.
8. Click Apply to Dashboard.
9. Go back to the dashboard details page, click the Time Granularity drop-down list at the top, and change the time granularity. Then, you can see that the charts inserted with the variable change accordingly.
System Predefined Variables
System preset variables can be used directly in dashboards without configuration.
Time Granularity Variables
When a time granularity variable is applied to a statement, it is automatically adapted to different time granularities based on the selected time range and replaced in the statement. Usage is as follows:
Variable
Description
Format after variable substitution
${__interval}
The variable automatically adapts to different time granularities based on the time range, and does not specify a unit for the time granularity.
10s, 15m, 2h, and so on (default format)
10 second, 15 minute, 2 hour, and so on (when the histogram function is used)
Example:
Log topic: Perform time series analysis using the histogram function.
Metric topic: Calculate the average rate of change per second for metrics.
rate(MetricName{label=~".*"}[${__interval}])
Time Duration Variables
When a time range variable is applied to a statement, it is automatically calculated based on the selected time range to determine the length of the selected time period and is then replaced in the statement. Usage is as follows:
Variable
Description
Format after variable substitution
${__range}
Automatically calculates the length of the selected time based on the selected time range.
10s, 150s, 300s, and so on
${__range_s}
Automatically calculates the length of the selected time based on the selected time range, with the unit specified as seconds (s) and the result presented without the unit.
10, 150, 300, and so on
${__range_ms}
Automatically calculates the length of the selected time based on the selected time range, with the unit specified as milliseconds (ms) and the result presented without the unit.
10000, 150000, 300000, and so on
Example:
Metric topic: Count the PV for the selected time range.
sum_over_time(ReqCount{label=~".*"}[${__range}])
Metric topic: Count the QPS for the selected time range.
Why does a configured data source variable not take effect or take effect only on some charts?
A data source variable does not apply directly to all charts on the dashboard. It applies only to those charts that use it on the chart editing page.
A data source variable does not directly take effect for all charts in the dashboard, but only takes effect for the charts that use this variable on the chart editing page.
Examples
Analyzing the performance metrics of different application APIs on the dashboard (filter in the drop-down list)
Requirement
Log topic A stores NGINX access logs of an application, and you are to use the dashboard to view the throughput, number of error requests, and response time of the entire application and a specified API. The following is the sample log information:
body_bytes_sent:1344
client_ip:127.0.0.1
host:www.example.com
http_method:POST
http_referer:www.example.com
http_user_agent:Mozilla/5.0
proxy_upstream_name:proxy_upstream_name_4
remote_user:example
req_id:5EC4EE87A478DA3436A79550
request_length:13506
request_time:1
http_status:201
time:27/Oct/2021:03:25:24
upstream_addr:219.147.70.216
upstream_response_length:406
upstream_response_time:18
upstream_status:200
interface:proxy/upstream/example/1
Solution
1. Create a dashboard.
2. Create three charts (sequence diagrams) based on the application performance metrics. The corresponding query statements are as follows:
Throughput
* |select histogram( cast(__TIMESTAMP__ as timestamp),interval 1 minute) as analytic_time, count(*) as pv group by analytic_time order by analytic_time limit 1000
Number of error requests
http_status:>=400|select histogram( cast(TIMESTAMP as timestamp),interval 1 minute) as analytic_time, count(*) as pv_lost group by analytic_time order by analytic_time limit 1000
Average response time
* |select histogram( cast(TIMESTAMP as timestamp),interval 1 minute) as analytic_time, avg(request_time) as response_time group by analytic_time order by analytic_time limit 1000
3. Add a filter in the drop-down list.
Type: Filter in the drop-down list
Display Name: API name
Log Topic: Log topic A
Select field: interface
4. Go back to the dashboard details page, and you can see this variable on the top of the page.
If API Name is not specified, data is not filtered, and the charts on the dashboard display all data, that is, the overall performance metrics of the application.
If API Name is specified, all charts on the dashboard use the specified API as the filter condition to filter data and display the performance metrics of the API.
Viewing the production and test environment performance metrics on the dashboard separately (data source variable)
Requirement
An application has a production environment and a test environment, and logs are collected to Log topic A (production environment) and Log topic B (test environment). Therefore, during application development, testing, and Ops, you need to pay attention to the performance metrics of the two environments.
Default Log Topic: Log topic A (production environment)
3. Add charts.
In the Log Topic drop-down list, select Use Data Source Variable and select the ${env} variable created in the previous step. Then, charts will use the value of the variable as the data source, that is, Log topic A (production environment).
4. Repeat Step 3 to add other charts.
5. Go back to the dashboard details page, click the data source variable Application Environment at the top of the page, and switch the log topic in the drop-down list of the variable. Then, the charts that use the variable will switch the log topic accordingly.