The chart interaction feature supports triggering interactive events by clicking on values in the chart, such as jumping to a specified URL, opening a search and analysis page, opening a dashboard page, or adding filter conditions.
2. In the left sidebar, go to Search and Analysis or Dashboard to create a statistical analysis chart.
3. In the chart configuration, select Interaction Event and add the relevant interaction. The following variables can be referenced:
Variable Reference Range
Variable
Description
Current chart
${__meta.topicId}
Log topic of current chart data.
Current chart
${__meta.startTime}
Start time of current chart data.
Current chart
${__meta.endTime}
End time of current chart data.
Current chart
${__meta.region}
Region of the log topic for the current chart.
Current row
${__row.fieldname}
Value of the fieldname field in the clicked row. (Fieldname is the name of the referenced field.)
Current column
${__field.name}
Name of field in the clicked column.
Current value.
${__value.raw}
Current value, referenced in raw format.
Current value.
${__value.text}
Current value, referenced as a string.
Current value.
${__value.numeric}
Current value, referenced in numeric format.
Operation Example
Open External URL
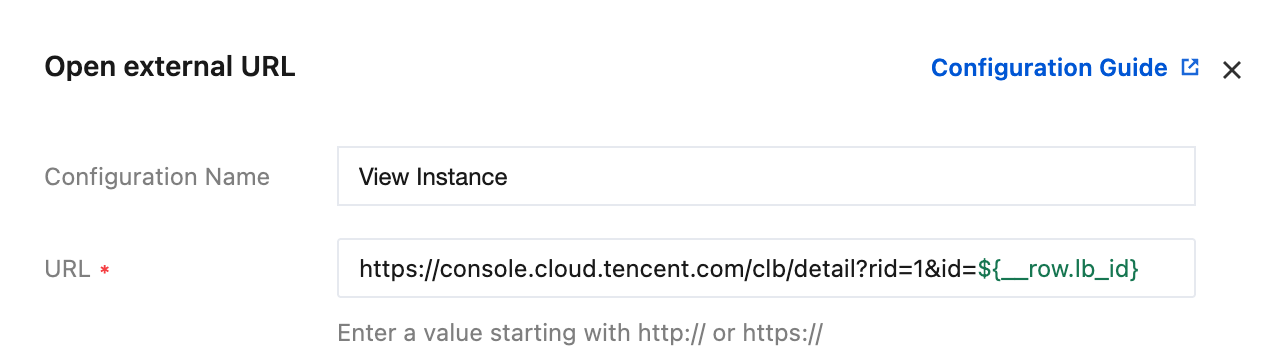
Scenario: Analyze the CLB access log dashboard to identify the CLB instance with the highest failure rate, and navigate to the corresponding CLB instance to view instance details and make configurations.
In the TOP10 Instance Request Failure Rate (%) chart, choose Interaction Event > Open External URL. The ${__row.lb_id} in the URL to navigate to is a variable, which is configured as follows:
After configuration, click the corresponding lb_id to navigate to the instance details page.
Searching for Other Log Topics
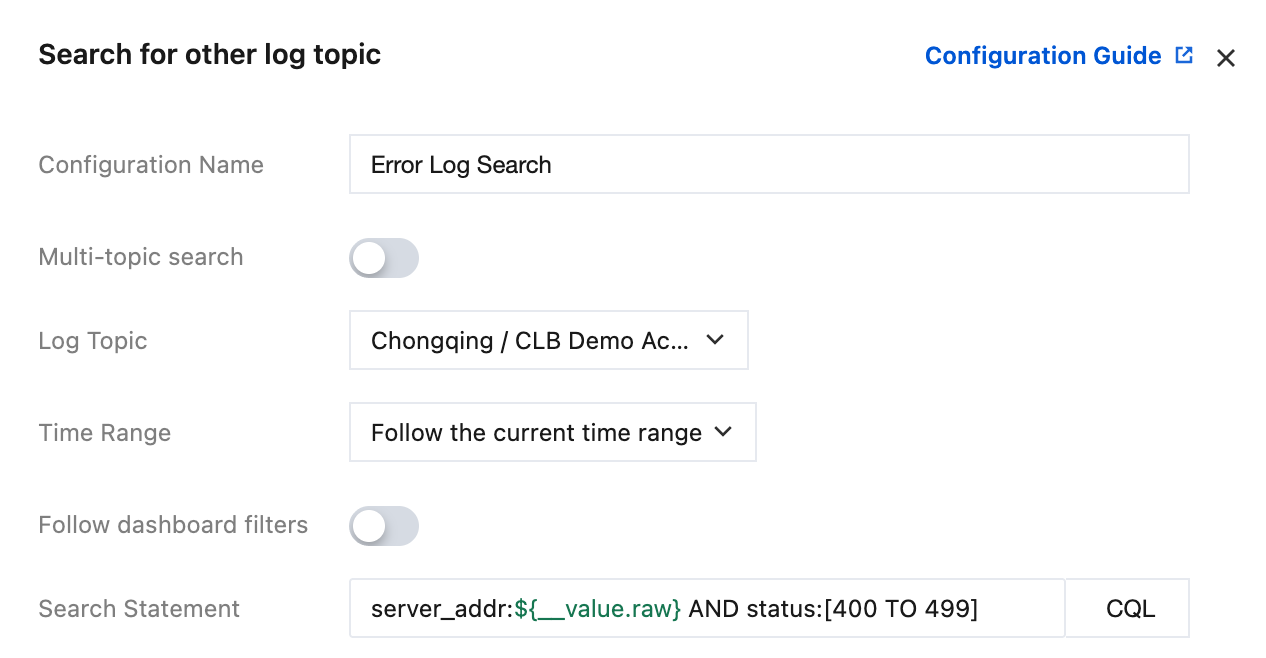
Scenario: The TOP error rates for server IP addresses have been identified. When an IP address with a high error rate appears, navigate to the search and analysis page to view logs for that IP address where the status code is 4XX.
In the chart, configure Interaction Event> Search For Other Log Topic, choose to use the current log topic, and configure the search statement as shown in the following figure:
server_addr:${__value.raw} AND status:[400 TO 499]
Click the target IP address to automatically open the search page and display the search results.
Adding to Filter
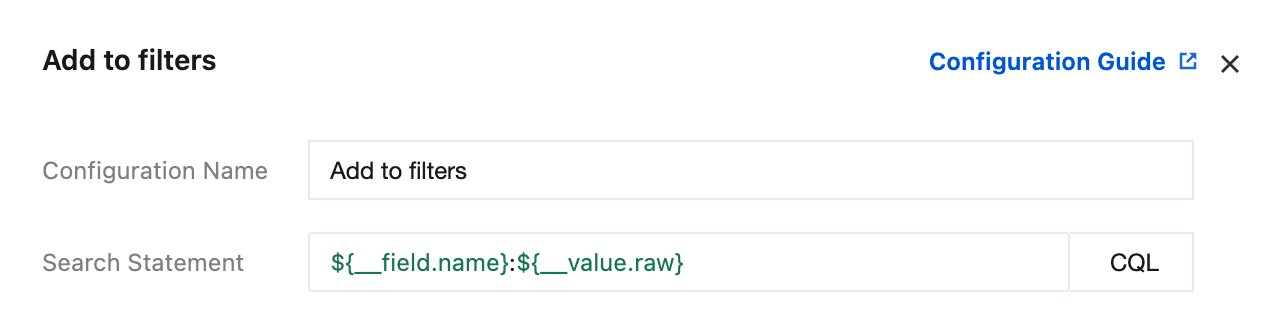
Scenario: When viewing log content in a table, you can click any field to add it to the filter, facilitating drilling down during browsing. Configure the Add to Filter feature as follows:
${__field.name}:${__value.raw}
After configuration, you can click any field value to add it to the filter.
Opening a Dashboard
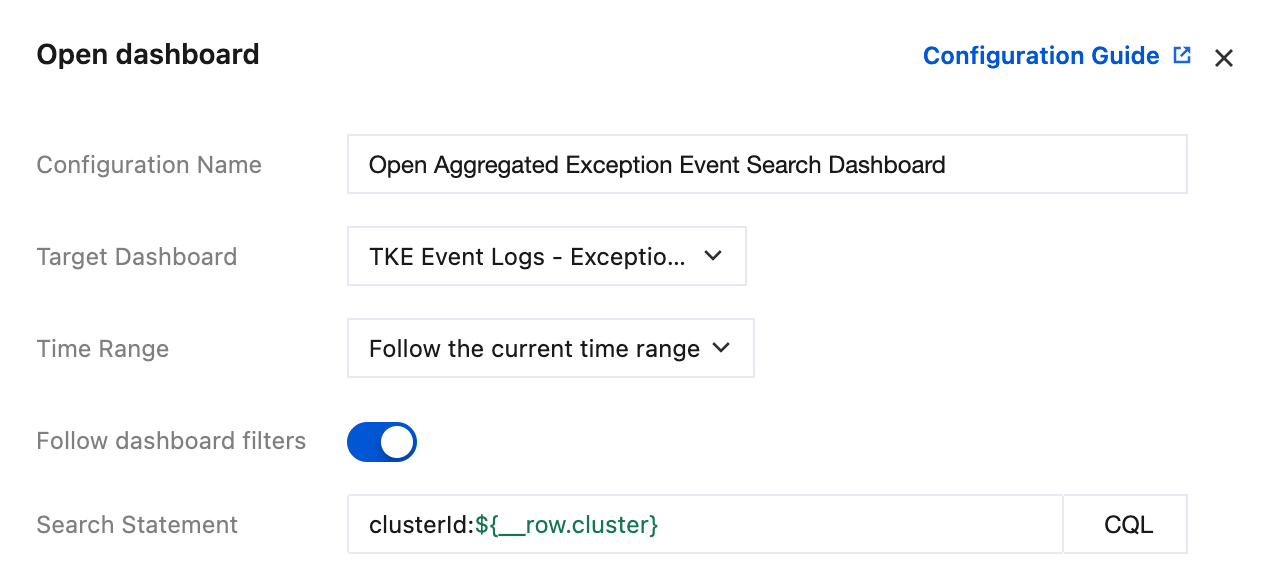
Scenario: View the "Overview" dashboard to identify the cluster with the highest number of errors. Then, using that cluster ID as a filter, open the "Abnormal Event Aggregation Search and Analysis" dashboard to view details. Configure as follows:
clusterId:${__row.cluster}
After configuration, click the corresponding cluster field. This action will navigate to and open the Abnormal Event Aggregation Search and Analysis dashboard, where the metrics for that cluster are already filtered.