Network Probe Analysis Practice
Download
Modo Foco
Tamanho da Fonte
This document presents a practical tutorial case that uses the Network Detection and Analysis Application to solve real-world problems.
Case 1: Intermittent High Latency Fault Location for a Game's North American Server
Background
A game server in the US region experienced intermittent high latency issues. This triggered a CLS alarm, which showed that the ICMP latency (Ping) from the two probe points in Hong Kong (China) and Shanghai to the game server in Los Angeles surged from an average of 150ms to over 400ms, and the packet loss rate jumped from <1% to 15% - 25%. This affected players connecting from Mainland China and Hong Kong (China) to the data center in Los Angeles, USA.
Core Challenges
Rapid and precise root cause identification and recovery.
Solution
Integrate the network detection application with CLS and configure real-time network quality alarms to promptly identify issues. When an alarm is triggered, quickly locate the problem using the network quality analysis dashboard. The process is as follows:
1. Monitoring Integration: Integrate the CLS network detection application to enable network quality probing and data collection. For details, see Using Network Detection and Analysis.
2. Configure Alarms: Metrics for each network link are collected. An alarm is triggered when any of the following thresholds is met: connection failure rate greater than 5%, network latency greater than 400ms, or packet loss rate greater than 5%. The alarm notification displays the corresponding server and client information for the link that triggered the alarm. For detailed operations, see Configuring Alarm Policies. The alarm statement is configured as follows:
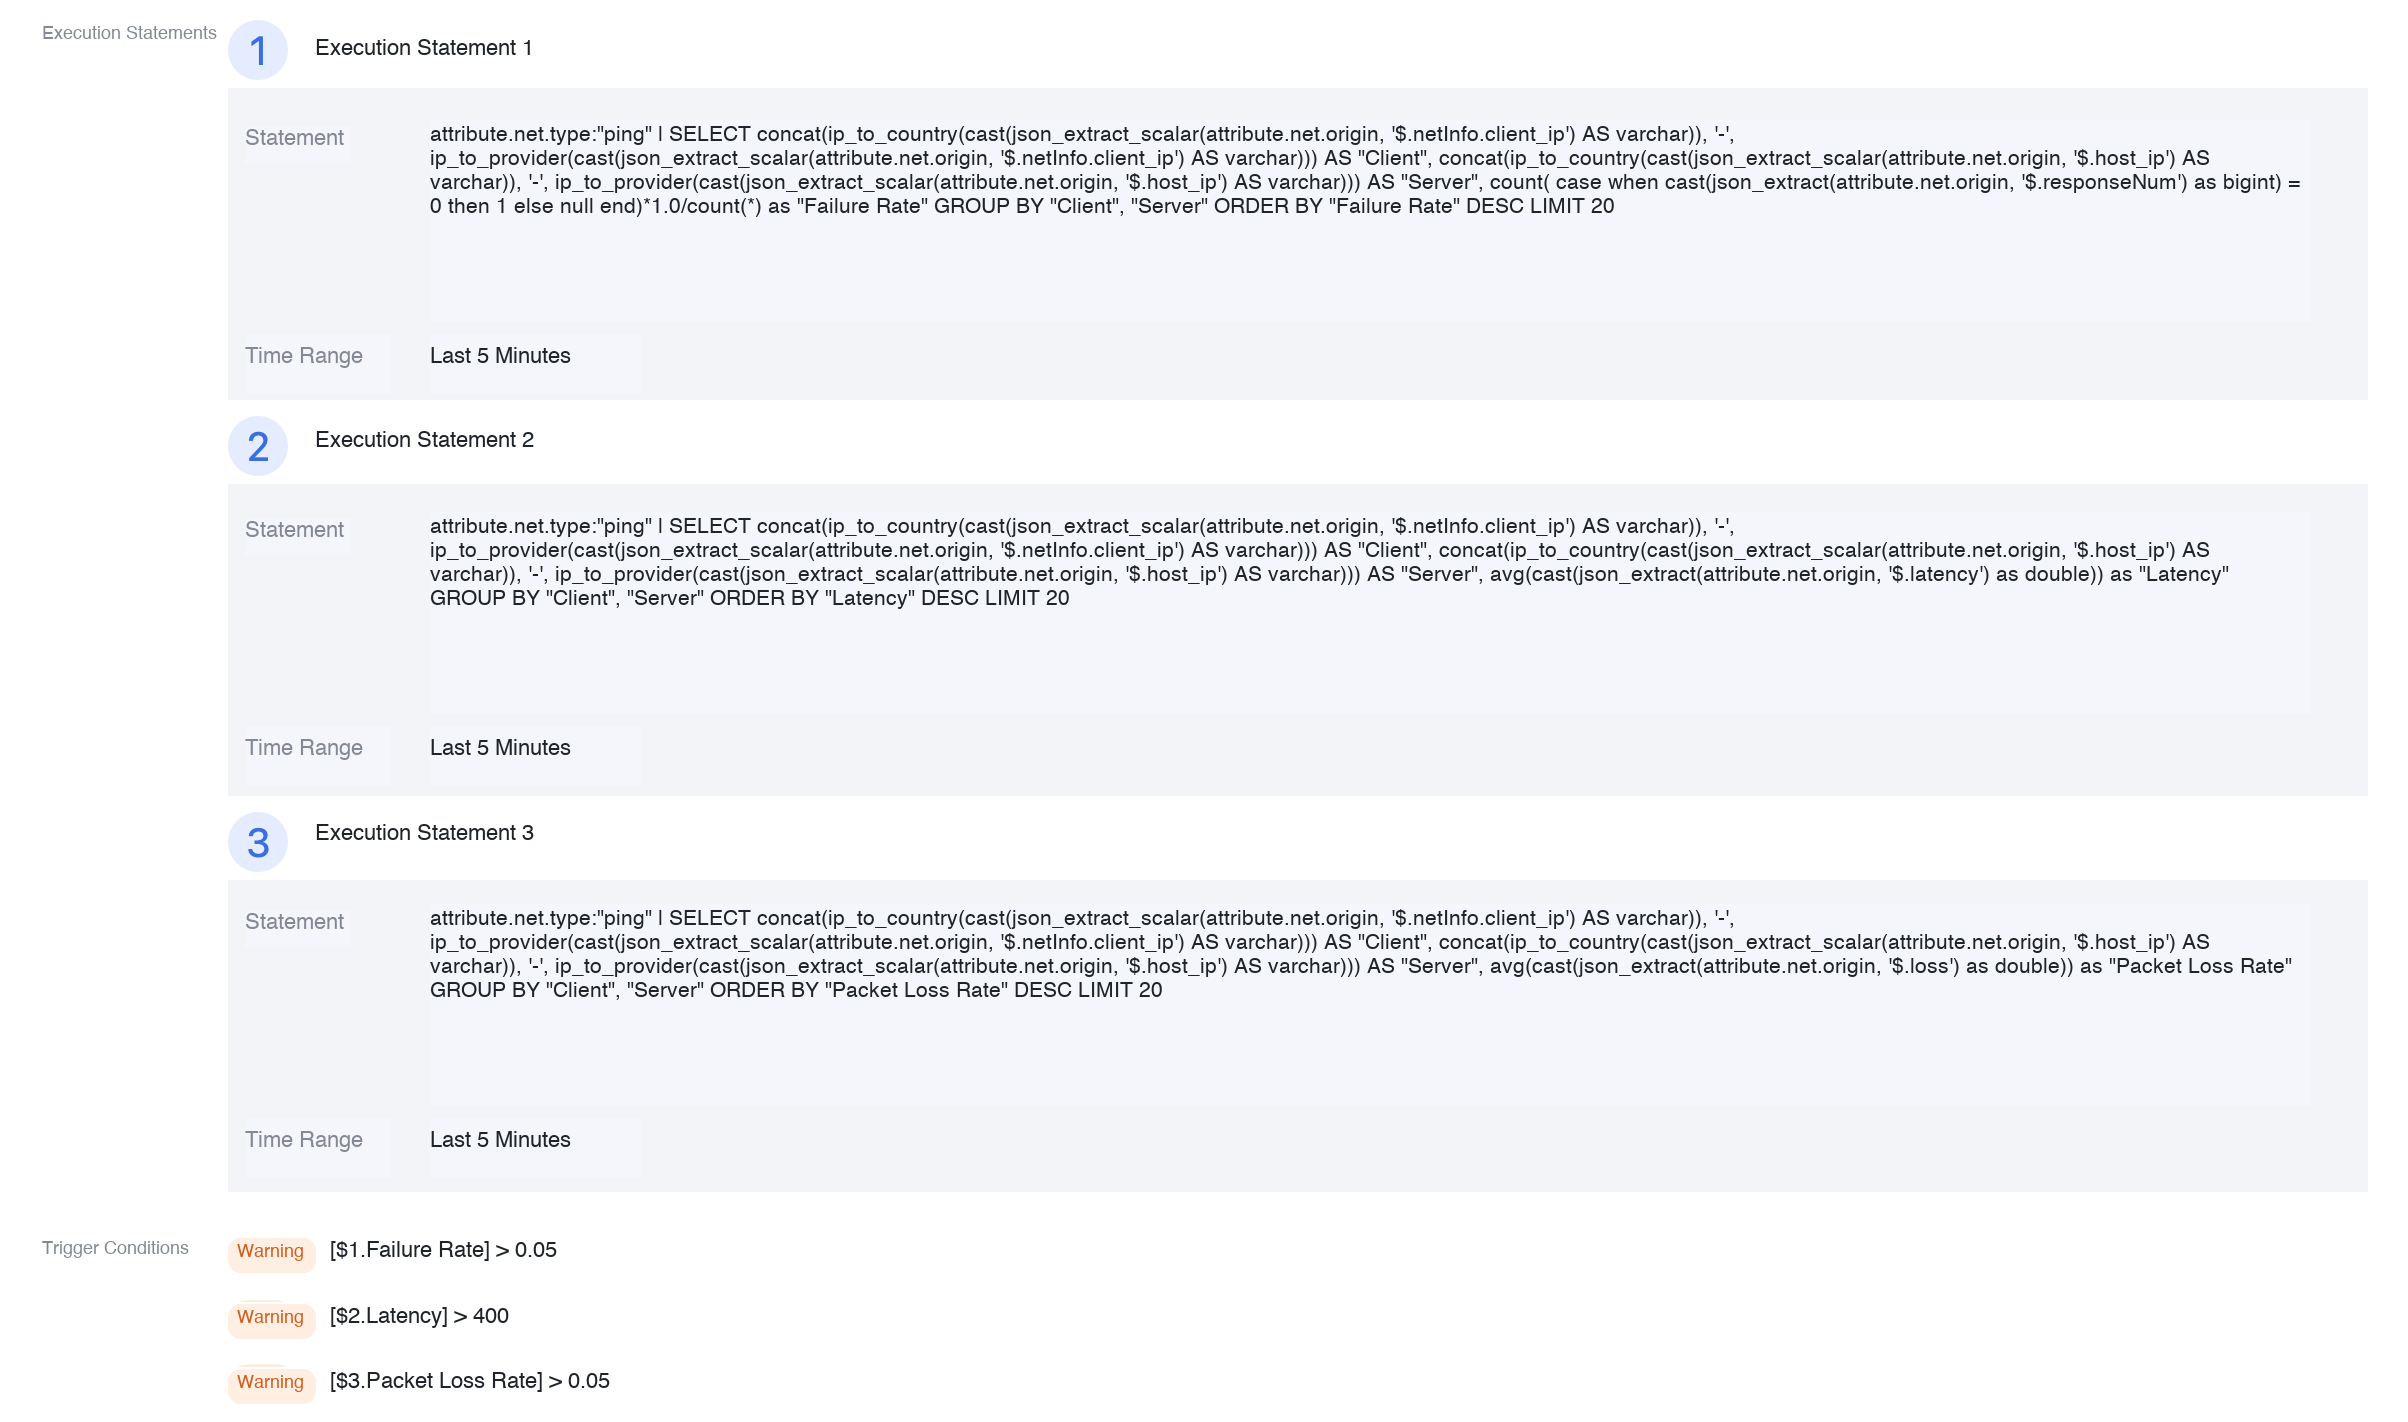
The connection failure rate is monitored, with the threshold set to greater than 0.05 (5%).
attribute.net.type:"ping" | SELECT concat(ip_to_country(cast(json_extract_scalar(attribute.net.origin, '$.netInfo.client_ip') AS varchar)), '-', ip_to_provider(cast(json_extract_scalar(attribute.net.origin, '$.netInfo.client_ip') AS varchar))) AS "Client", concat(ip_to_country(cast(json_extract_scalar(attribute.net.origin, '$.host_ip') AS varchar)), '-', ip_to_provider(cast(json_extract_scalar(attribute.net.origin, '$.host_ip') AS varchar))) AS "Server", count( case when cast(json_extract(attribute.net.origin, '$.responseNum') as bigint) = 0 then 1 else null end)*1.0/count(*) as "Failure Rate" GROUP BY "Client", "Server" ORDER BY "Failure Rate" DESC LIMIT 20
Network latency is monitored, with the threshold set to greater than 400 (400ms).
attribute.net.type:"ping" | SELECT concat(ip_to_country(cast(json_extract_scalar(attribute.net.origin, '$.netInfo.client_ip') AS varchar)), '-', ip_to_provider(cast(json_extract_scalar(attribute.net.origin, '$.netInfo.client_ip') AS varchar))) AS "Client", concat(ip_to_country(cast(json_extract_scalar(attribute.net.origin, '$.host_ip') AS varchar)), '-', ip_to_provider(cast(json_extract_scalar(attribute.net.origin, '$.host_ip') AS varchar))) AS "Server", avg(cast(json_extract(attribute.net.origin, '$.latency') as double)) as "Latency" GROUP BY "Client", "Server" ORDER BY "Latency" DESC LIMIT 20
The packet loss rate is monitored, with the threshold set to greater than 0.05 (5%).
attribute.net.type:"ping" | SELECT concat(ip_to_country(cast(json_extract_scalar(attribute.net.origin, '$.netInfo.client_ip') AS varchar)), '-', ip_to_provider(cast(json_extract_scalar(attribute.net.origin, '$.netInfo.client_ip') AS varchar))) AS "Client", concat(ip_to_country(cast(json_extract_scalar(attribute.net.origin, '$.host_ip') AS varchar)), '-', ip_to_provider(cast(json_extract_scalar(attribute.net.origin, '$.host_ip') AS varchar))) AS "Server", avg(cast(json_extract(attribute.net.origin, '$.loss') as double)) as "Packet Loss Rate" GROUP BY "Client", "Server" ORDER BY "Packet Loss Rate" DESC LIMIT 20
3. Analysis and Diagnosis:
After an alarm is triggered, first check the alarm notification. You will find that the exceptions are primarily concentrated on the links from the Chinese mainland and Hong Kong (China) to the United States.
Open the Network Quality Analysis_PING Analysis Dashboard and the Network Quality Analysis_TCP Analysis Dashboard. At the top, filter for a server country of the United States and a client country of China. You will observe high PING latency and severe packet loss. Looking at TCP, connections are successful, but the connection time is highly unstable (200ms-800ms). This confirms that the issue affects the TCP protocol layer, not just ICMP rate limiting.
Open the Network Quality Analysis_MTR Analysis Dashboard and drill down to analyze each hop of the link. View the MTR Probe Result Details, select any abnormal record, and click View Details. The following information can be observed:
For hops 1 - 5 (the local carrier network), both latency and packet loss are normal.
Hop 6: The traffic enters the China Telecom international gateway (IP address belonging to 202.97.*.*).
For hops 7 - 9, when the packets pass through the 202.97.*.* series of nodes, the packet loss rate surges to 20% - 30%, and the average latency jumps from 50ms to 300ms.
After hop 10 (entering the network within the United States): The packet loss rate is reduced to below 1%, but the baseline latency has been elevated due to congestion in the preceding segment.

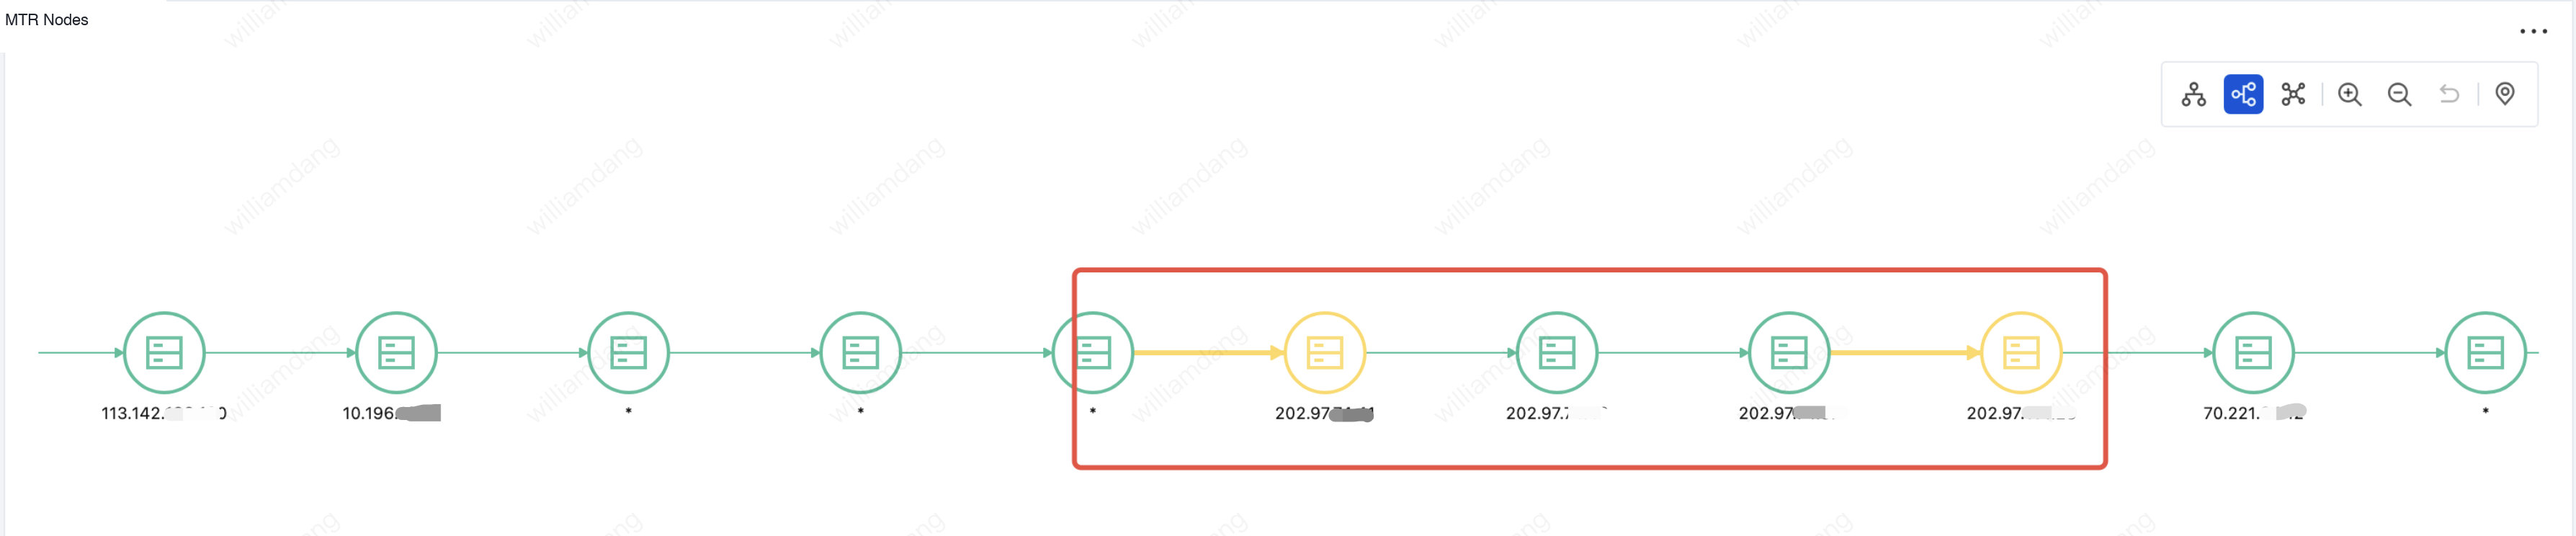
4. Root Cause Identified: The fault points are highly concentrated at the international backbone egress nodes of China Telecom towards North America. This period coincided with the peak evening internet usage in China, compounded by the weekend gaming peak in the western United States, leading to congestion on the cross-border link.
Case 2: Improving FPS Game Experience via PING Analysis
Background
A certain first-person shooter game deploys battle servers across multiple data centers globally. Players are assigned to different servers for matches based on matching rules. Because network latency directly impacts operational responsiveness and gaming experience, players must be prioritized for assignment to low-latency battle servers based on real-time network quality.
Core Challenges
Traditional static allocation or policies based solely on geographic proximity struggle to adapt to dynamic fluctuations in network conditions, such as regional network congestion or unstable cross-border links. This can cause players to persistently experience high latency, which impacts fairness and the gaming experience.
Solution
Integrate the CLS network detection application to continuously monitor and analyze the latency of links from players in various regions to different battle servers. Based on this data, dynamically adjust the matching policy to optimize the overall network experience. The case practice process is as follows:
1. Monitoring Integration: Integrate the CLS network detection application to enable network quality probing and data collection for the "player-server" link. For details, see Using Network Detection and Analysis.
2. Analysis and Diagnosis: In the Network Quality Analysis_PING Analysis Dashboard, view the latency of each link and server load in real time. In this case, it was found that Chinese players are currently assigned to servers in four regions. Among these, the link latency to servers in Russia is generally higher than 200ms, while servers in France exhibit low latency and also lower load during the same period.
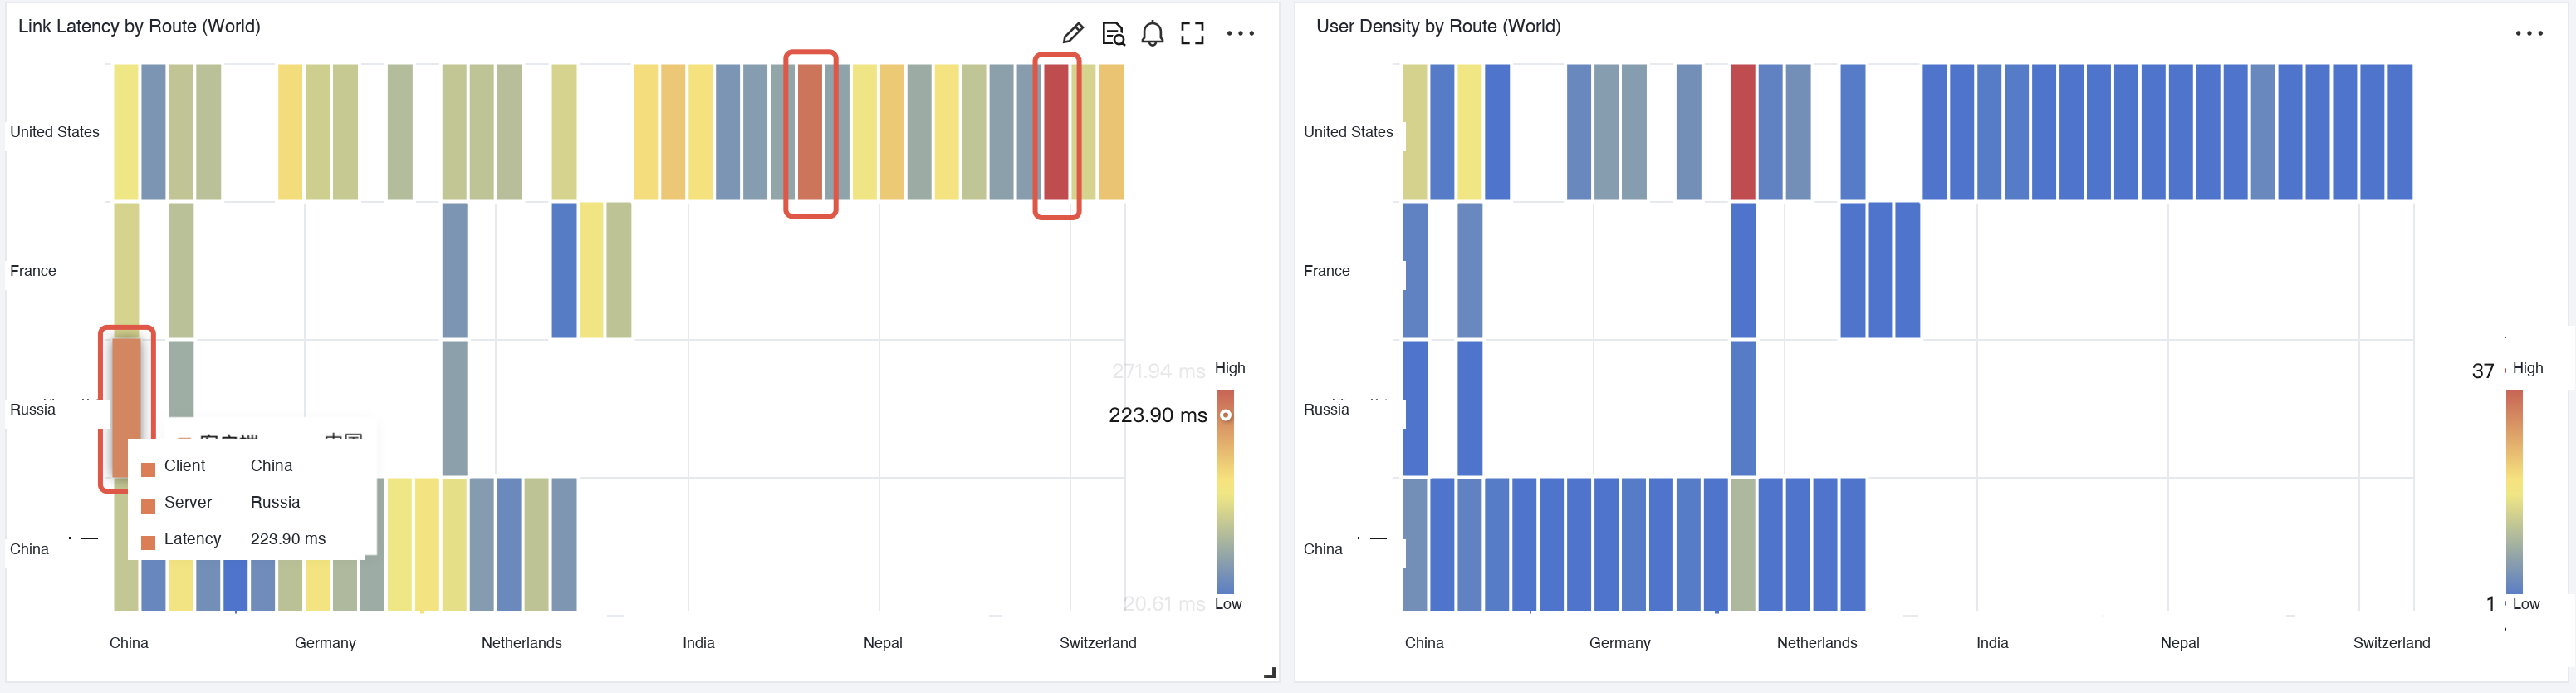
3. Policy Tuning: Based on data insights, adjust the matching rules. During international matches, prioritize assigning Chinese players to servers in France and significantly reduce the allocation priority for servers in Russia. This quickly directs players to a better-performing link.
Implementation Results
Through the aforementioned data-driven dynamic scheduling, high-latency links are effectively avoided, the average network latency for affected players is significantly reduced, and the smoothness and fairness of the gaming experience are enhanced.
Ajuda e Suporte
Esta página foi útil?
Você também pode entrar em contato com a Equipe de vendas ou Enviar um tíquete em caso de ajuda.
comentários