Using Network Detection Analysis
Download
Modo Foco
Tamanho da Fonte
This document describes how to create a network probing analysis application in the CLS console and how to collect and analyze network probing data by integrating the SDK.
Prerequisites
Operation Steps
Step 1: Creating a Network Detection Analysis Application
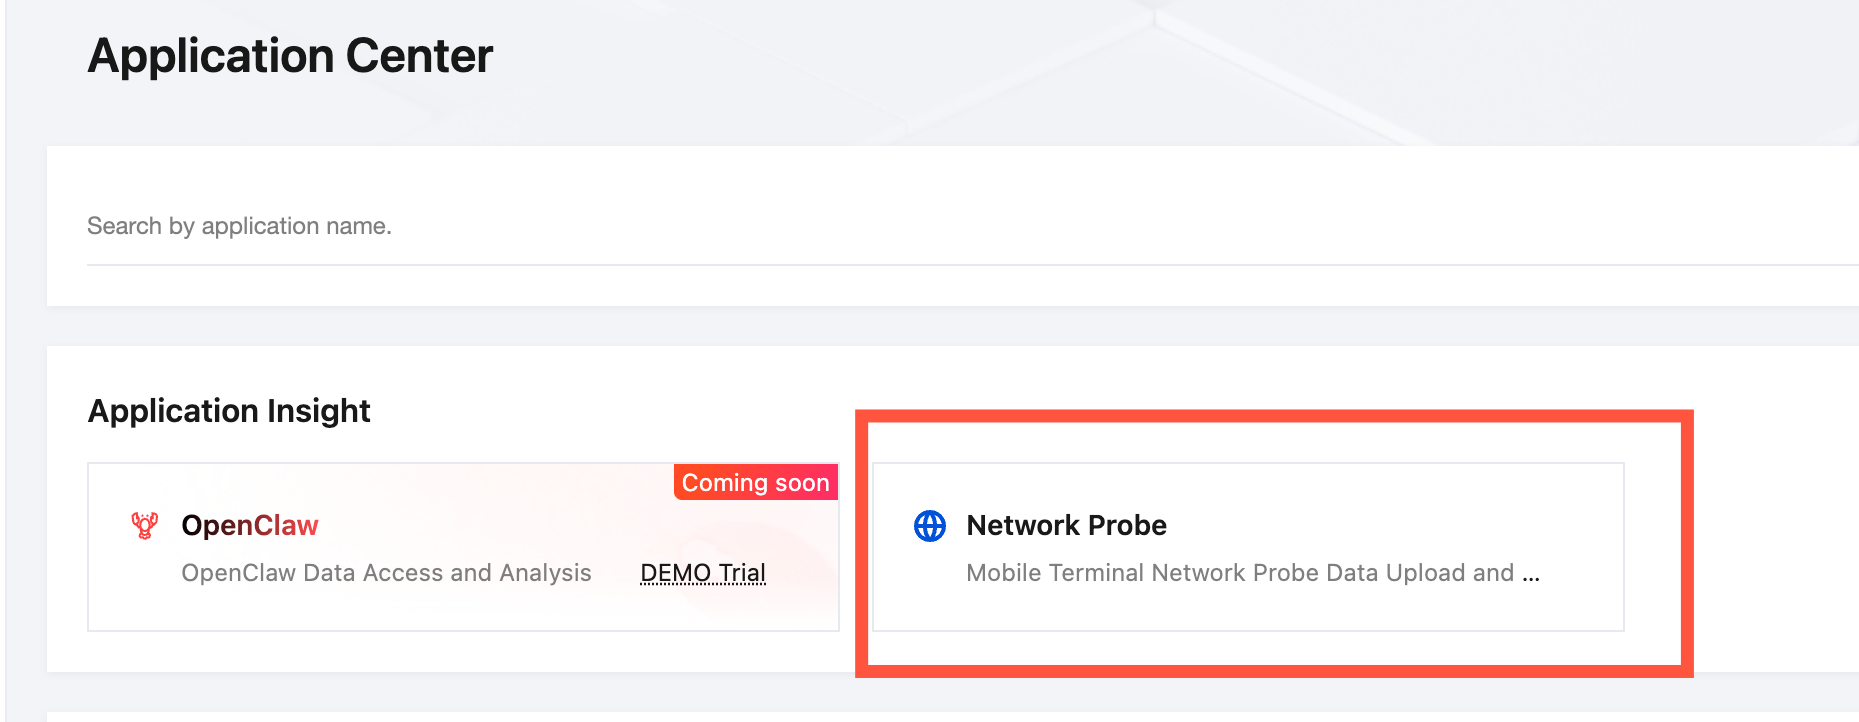
1. Log in to the CLS console, and then select Application Center in the left sidebar.
2. Under the Application Insight category, select Network Probe.
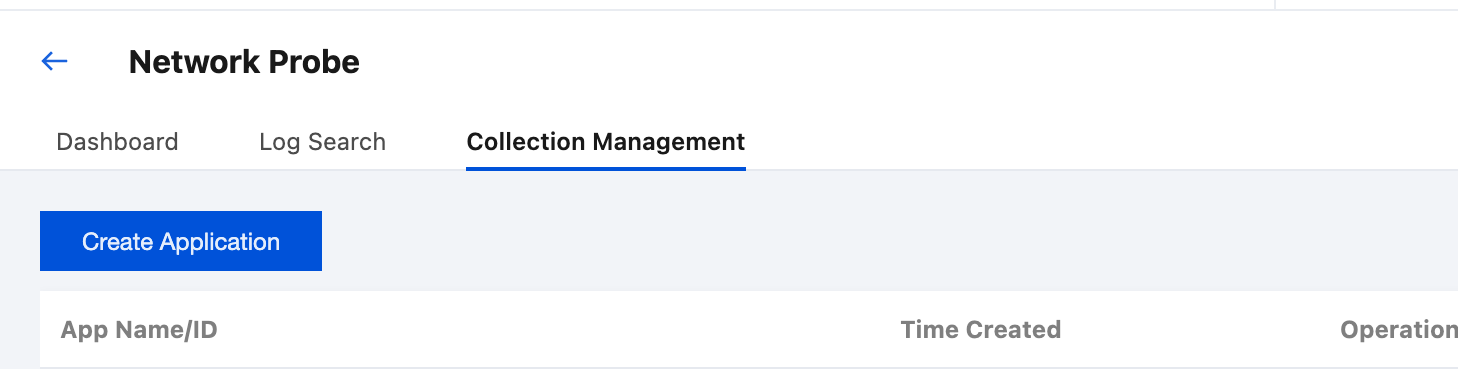
3. Go to the Collection Management tab, and then click Create Application.
4. Enter the relevant configurations.
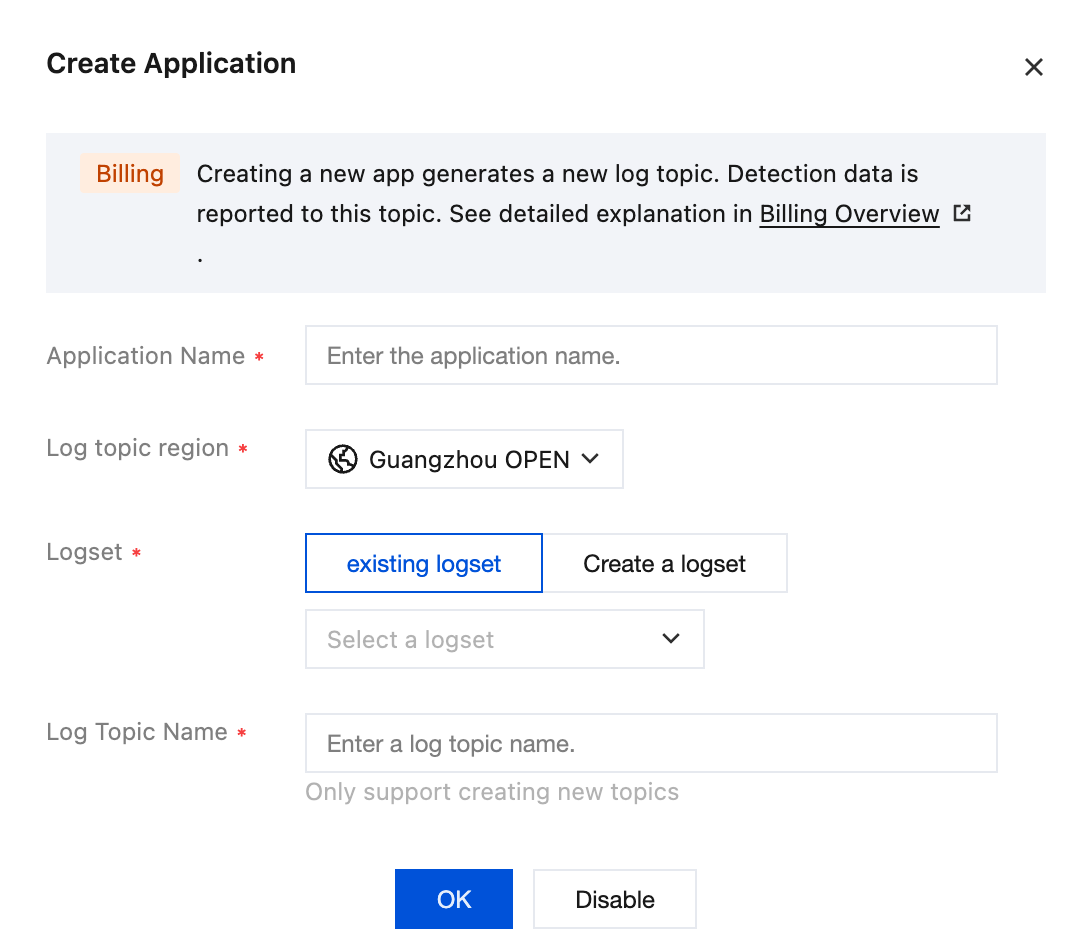
Parameter | Required | Description |
Application Name | Yes | Custom application name, unique within the region, cannot contain the character `. |
Log Topic Region | Yes | Select the region to which the application's topic belongs. |
Logset | Yes | Select an existing logset or create a new one. |
Log Topic Name | Yes | Enter the log topic name, and the system will automatically create a dedicated topic. |
5. Click OK to complete the application creation.
Step 2: Obtaining the Application Key
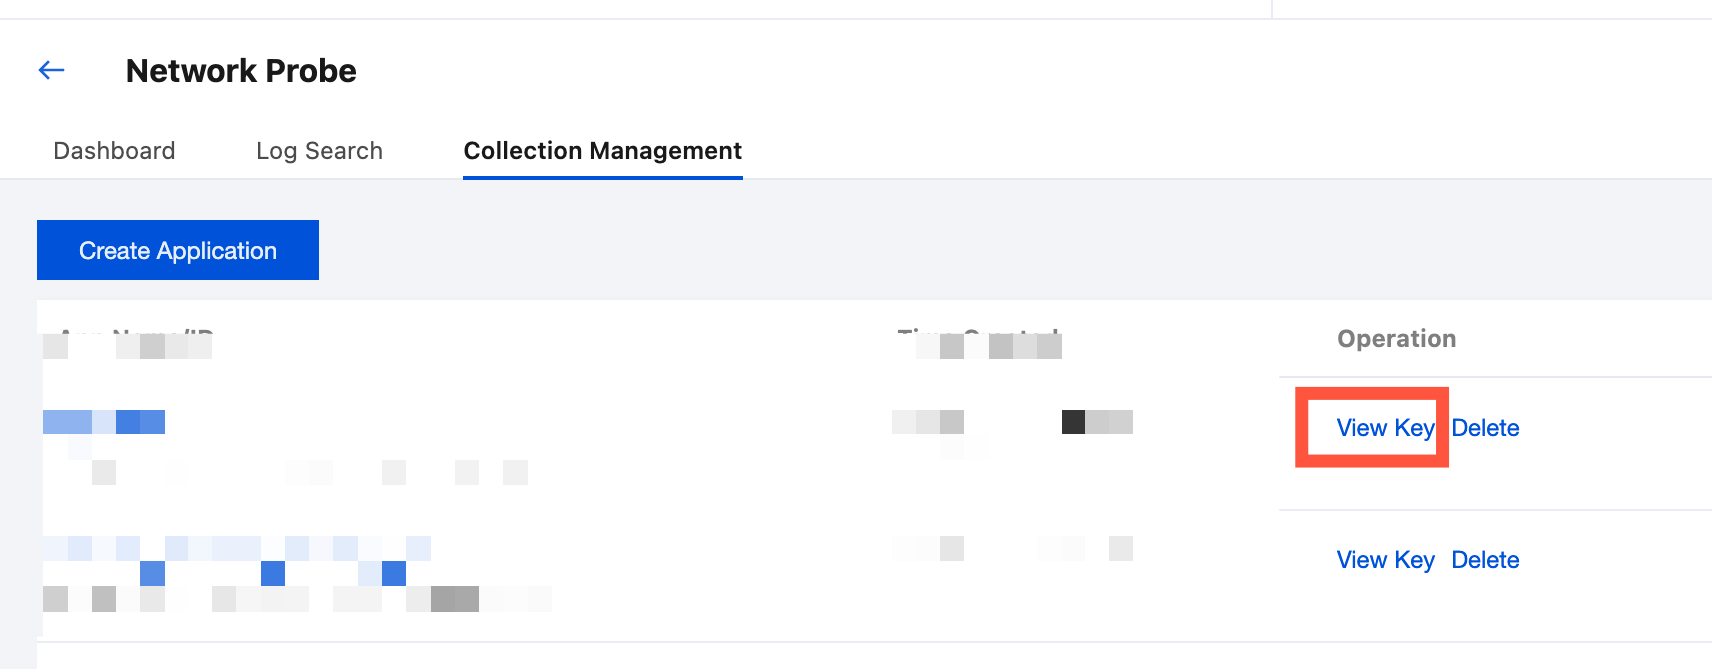
1. In the application list, locate the target application, and then click View Key in the Operation column.
2. You can copy the application Token in the pop-up window.
Note:
The application Token is a required parameter for SDK initialization. Securely store it to prevent exposure.
Step 3: Integrating the SDK Plugin
Integrate the SDK plugin into your target App. For SDK usage instructions, see SDK Plugin Usage Instructions. The plugin currently supports mobile SDKs for both Android and iOS.
Step 4: Verifying Data Reporting
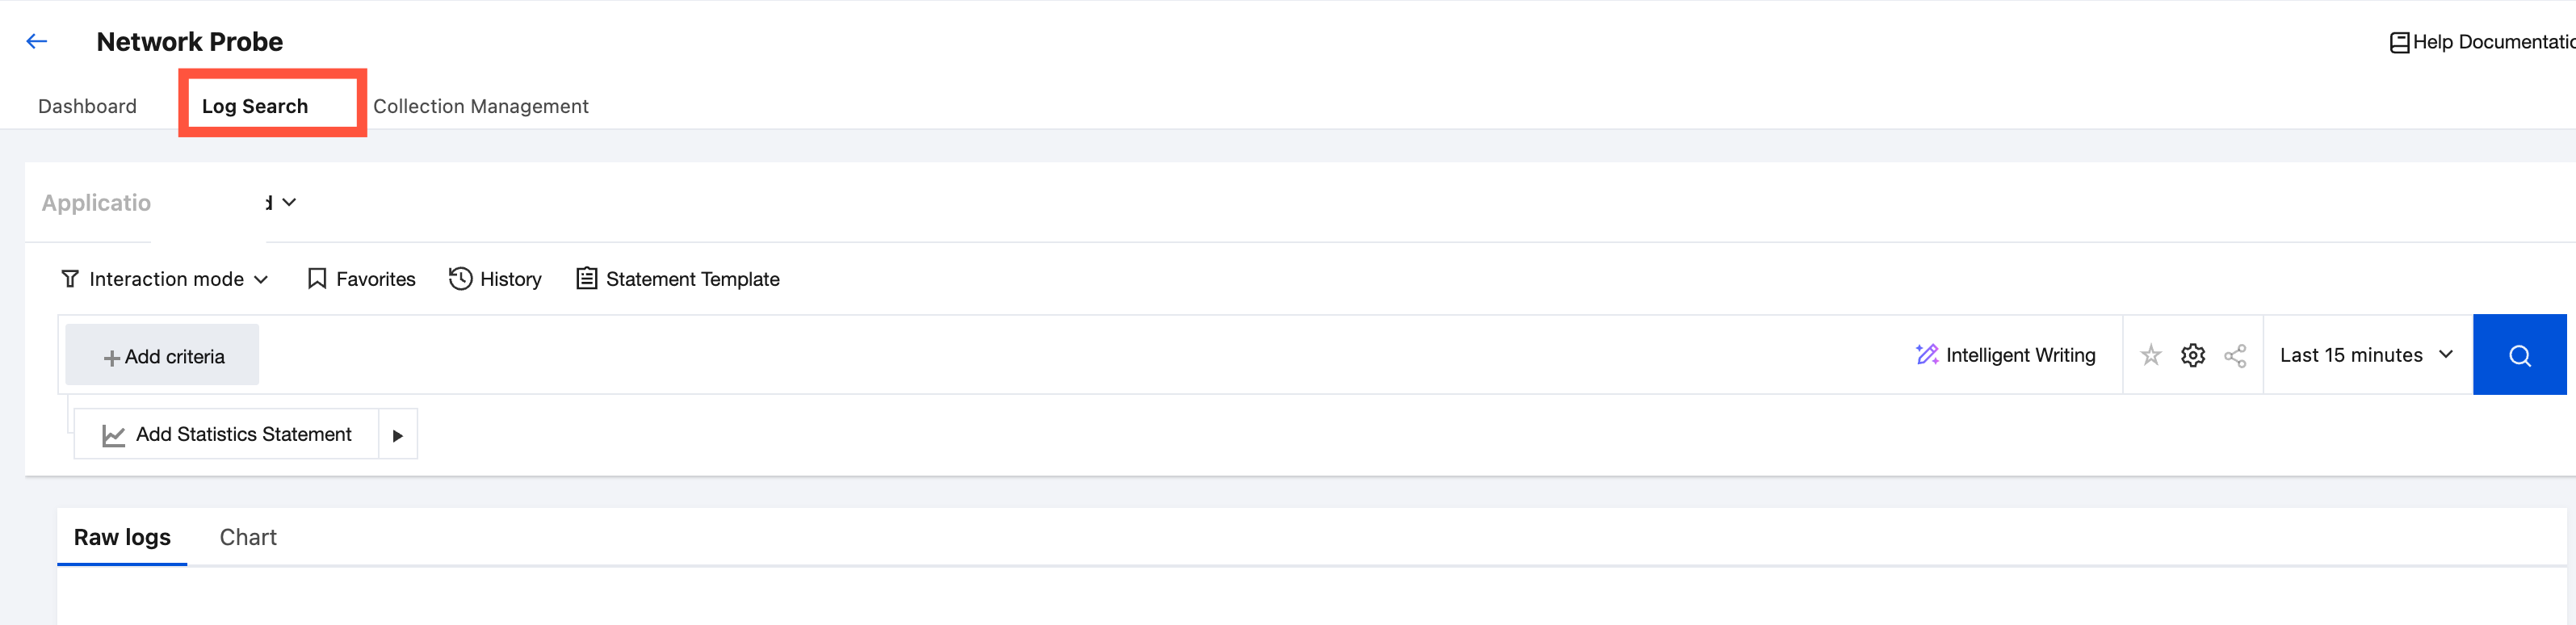
After the SDK is integrated, start the App and trigger network probing to verify whether data is reported normally. Click Log Search and select the corresponding application to check whether network probing logs are written.
Step 5: Viewing Analysis Reports
1. On the application details page, select the Dashboard Tab.
2. View the system-preconfigured analysis reports. Currently, six preconfigured dashboards are supported.
Dashboard Name | Description | Demo Environment |
Network Detection Analysis_Overview Dashboard | An overall overview of network quality, including core metrics such as detection success rate, average latency, and packet loss rate. | |
Network Detection Analysis_PING Analysis | Provides detailed analysis of PING detection, supporting viewing by dimensions such as region and ISP. | |
Network Detection Analysis_TCP Analysis | Detailed analysis of TCP Ping detection | |
Network Detection Analysis_MTR Analysis | Analyzes MTR routes and displays the network path and per-hop latency. | |
Network Detection Analysis_DNS Analysis | Detailed DNS resolution analysis | |
Network Detection Analysis_HTTP Analysis | Detailed HTTP detection analysis, showing the time consumption distribution of each stage. |
Ajuda e Suporte
Esta página foi útil?
Você também pode entrar em contato com a Equipe de vendas ou Enviar um tíquete em caso de ajuda.
comentários