Distributed Cache provides an error log feature. This feature allows you to view error records generated by an instance while running commands, helping you quickly locate client request exceptions and troubleshoot command execution failures. This document guides you on how to view, search, and export error logs on the console.
Scenarios
The error log feature records error information generated by an instance while running commands. This information includes the execution time, client IP address, command content, and returned error result, helping you quickly reconstruct the error context and identify the root cause of the failure. Typical use cases are as follows:
Troubleshooting Client Request Exceptions: When your business code reports an error while writing to or reading from Redis, you can view the client IP address and returned error message of the failed command in the error logs. This helps you quickly determine whether the issue is related to code logic or data format.
Batch Error Statistics and Root Cause Analysis: Filter error logs by time range and aggregate them by command type and node ID. This helps identify whether errors are concentrated on a specific node or for a specific command type, assisting in root cause localization.
Command Compatibility Verification: Before a version upgrade or migration, check whether there are any incompatible command errors in the historical error logs. This allows you to assess compatibility risks in advance.
Feature List
Error Log Query: This feature allows you to filter logs by time range and keywords to view detailed records of failed command executions.
Error Log Export: This feature allows you to export query results to an Excel file for offline analysis and archiving.
Error Information Traceback: Each error record contains the execution time, client IP address, command, command details, returned result, and node ID, fully reconstructing the context when the error occurred.
Use Limits
Limit
Description
Product Version
The Memcached edition does not support the error log feature.
Log retention period
Error logs are retained for 15 days.
Query Time Range
Error logs within any time period in the last 15 days can be queried. Narrowing the time range is recommended to improve query speed.
Export Quantity
The maximum number of entries per export is 10,000. Export the excess portion in multiple batches.
Prerequisites
A Tencent Cloud Distributed Cache instance has been created.
2. In the upper-right corner of the instance list, select the target region.
3. In the instance list, click the target instance ID to go to the Instance Details page.
4. Select the Log Center tab, and then select the Error Log sub-tab.
Step 2: Query Error Logs
1. On the Error Log sub-tab, configure the following filter criteria:
Time Range: Select the time period to query. You can customize the start and end times, but the time span must not exceed 15 days.
Keyword Search: Enter keywords in the search box. This feature supports precise queries based on command, client IP address, or command details. Separate multiple conditions with the Enter key.
2. Click Query, and the system will return a list of matching error logs.
Note:
If query results are returned slowly, narrow the time range or add keyword filters to improve query efficiency.
Step 3: View Error Log Fields
Query results are displayed in a list format, with each record containing the following fields:
Field Name
Description
Execution Time
The specific timestamp of command execution failure, accurate to the second, used to locate the moment the error occurred, align it with business logs and monitor curves for time synchronization, and reconstruct the fault timeline.
Client IP Address
The IP address of the client that initiated the request, used to locate the business or application node where the error originated and determine whether the error is concentrated on a specific caller.
Command
The type of Redis command that triggered the error, such as incr, get, set, and so on, used to quickly identify which type of operation failed.
Command Details
The complete content of the command, including the Key and specific parameters, which can be used to reconstruct the operation context, locate the involved data objects, and determine whether the error is related to a specific Key or parameter.
Reply
The error message returned by Redis after a command execution failure, such as ERR value is not an integer or out of range, is the key basis for determining the cause and type of the error.
Node ID
The identifier of the node that generated this error. In a cluster architecture, this field can be used to distinguish the source of the error and locate the problem to a specific shard or node.
Step 4: Export Error Logs
1. In the upper-right corner of the Error Log sub-tab, click
.
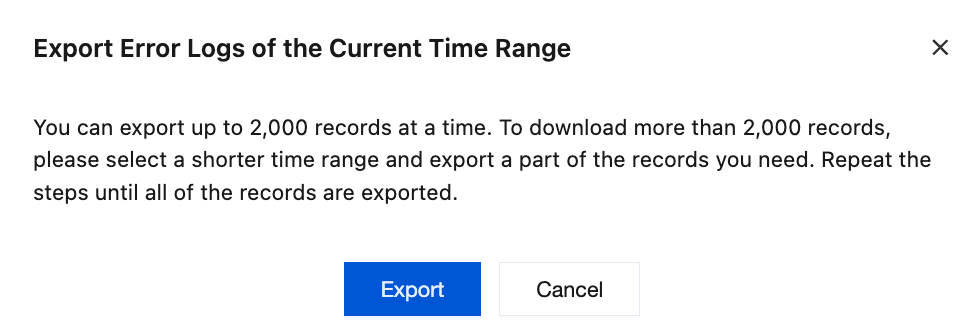
2. In the pop-up dialog box, confirm the export limitation description and then click Export.
3. The system will generate an Excel file and download it automatically. Open the file to view the complete error log records for the exported time period.
What Is the Difference Between Error Logs and Slow Queries?
Slow queries record commands whose execution time exceeds a specified threshold, helping to locate performance bottlenecks. Error logs record commands that fail to execute and return error messages, aiding in troubleshooting functional exceptions and request failures. As they focus on different dimensions, it is recommended to use them in combination.
Why Is a Specific Command's Error Record Not Visible in the Error Logs?
Possible reasons include: error logs are retained for only 15 days, and expired data is automatically cleared; the error occurred before the retention period; or the query time range does not cover the error occurrence time. It is recommended to promptly ship error logs to CLS for long-term storage. For the shipping method, see Shipping Logs.
How to Persistently Store Error Logs
You can ship error logs to CLS using the Shipping Logs feature. CLS supports a maximum log retention period of 3600 days and advanced features such as search and analysis, as well as alarm policy configuration.