Log Delivery
Download
Focus Mode
Font Size
Distributed Cache provides a log delivery feature that captures slow log and error log data from instances and ships it to Cloud Log Service (CLS) for analysis. By leveraging CLS's robust search, analysis, and visualization capabilities, this feature helps users more effectively identify performance bottlenecks and trace abnormal events. This document will guide you on enabling or disabling the log delivery feature through the console.
Note:
The Memcached edition currently does not support delivery logs to CLS.
Scenarios
The log delivery feature is designed to continuously ship slow logs and error logs from instances to Cloud Log Service (CLS). By leveraging CLS's search, analysis, visualization, and alarm capabilities, it enables long-term log storage and in-depth analysis. Typical use cases are as follows:
Long-term Performance Trend Analysis: This feature ships slow logs to CLS, performs aggregated statistics by dimensions such as command, node, and client IP address, identifies frequently occurring slow command patterns, and assists in capacity planning and performance optimization.
Exception Traceback and Root Cause Analysis: This feature ships error logs to CLS. When a business exception occurs, it traces back historical error records and reconstructs the problem timeline by correlating error codes, timestamps, and client IPs, thereby reducing the time required for fault localization.
Log Field Description
Slow Log (Redis Slow Log)
Field Name | Field Type | Field Description | Field Example |
logType | String | Log type | cache_slowlog |
instanceId | String | Instance ID | crs-xxxx |
role | String | Shard role where the slow log was generated | master |
createTime | Long | Timestamp of command execution (millisecond) | 1710316968000 |
node | String | Node ID | 357baf233f4ce49515912xxxxxxx |
cmd | String | Command | get / set / eval |
details | String | Specific command content | EVAL "for i=1,1000000 do redis.call('SET', 'k1' , 'v1') end" 0 |
Slow Log (Proxy Slow Log)
Field Name | Field Type | Description | Example |
logType | String | Log type | Proxy_slowlog |
instanceId | String | Instance ID | crs-xxxx |
take | Long | Execution duration (in milliseconds). | 12 |
cmd | String | Command | get / set / eval |
details | String | Specific command content | EVAL "for i=1,1000000 do redis.call('SET', 'k1' , 'v1') end" 0 |
ip | String | Client IP | 10.0.0.3 |
createTime | Long | Timestamp of command execution (millisecond) | 1710316968000 |
Error Logs
Field Name | Field Type | Field Description | Field Example |
logType | String | Log type | errlog |
instanceId | String | Instance ID | crs-xxxx |
createTime | Long | Error occurrence time (in milliseconds). | 1710316968000 |
cmd | String | Command that triggered the error | incr |
details | String | Detailed Error Information | ERR value is not an integer or out of range |
ip | String | Client IP | 10.0.0.3 |
node | String | Node ID | 357baf233f4ce49515912xxxxxxx |
Prerequisites
A Tencent Cloud Distributed Cache instance has been created.
CLS has been activated.
Use Limits
Limit | Description |
Product Version | Log delivery to CLS is not supported in the Memcached edition. |
Log type | Only slow logs (Cache slow logs + Proxy slow logs) and error logs are supported. |
Retention period | The default retention period is 30 days, supports a range from 1 to 3600 days, and expired logs are automatically purged. |
CLS independent billing | CLS is an independently billed product. After you enable log delivery, CLS is billed independently based on log write volume, storage volume, and index volume. See CLS billing overview. |
Directions
Step 1: Go to the Log Delivery Page
1. Log in to the Tencent Cloud Distributed Cache console.
2. At the top of the Instance List page on the right, select the region.
3. In the instance list, click the target Instance ID to go to the Instance Details page.
4. Select the Log Center tab, then select the Log Delivery sub-tab.
5. Go to the Log delivery page to view the delivery status of the two feature areas: Slow Log Delivery and Error Log Delivery. For first-time use, click Go to authorize to complete the activation of CLS service and the authorization of the service role.
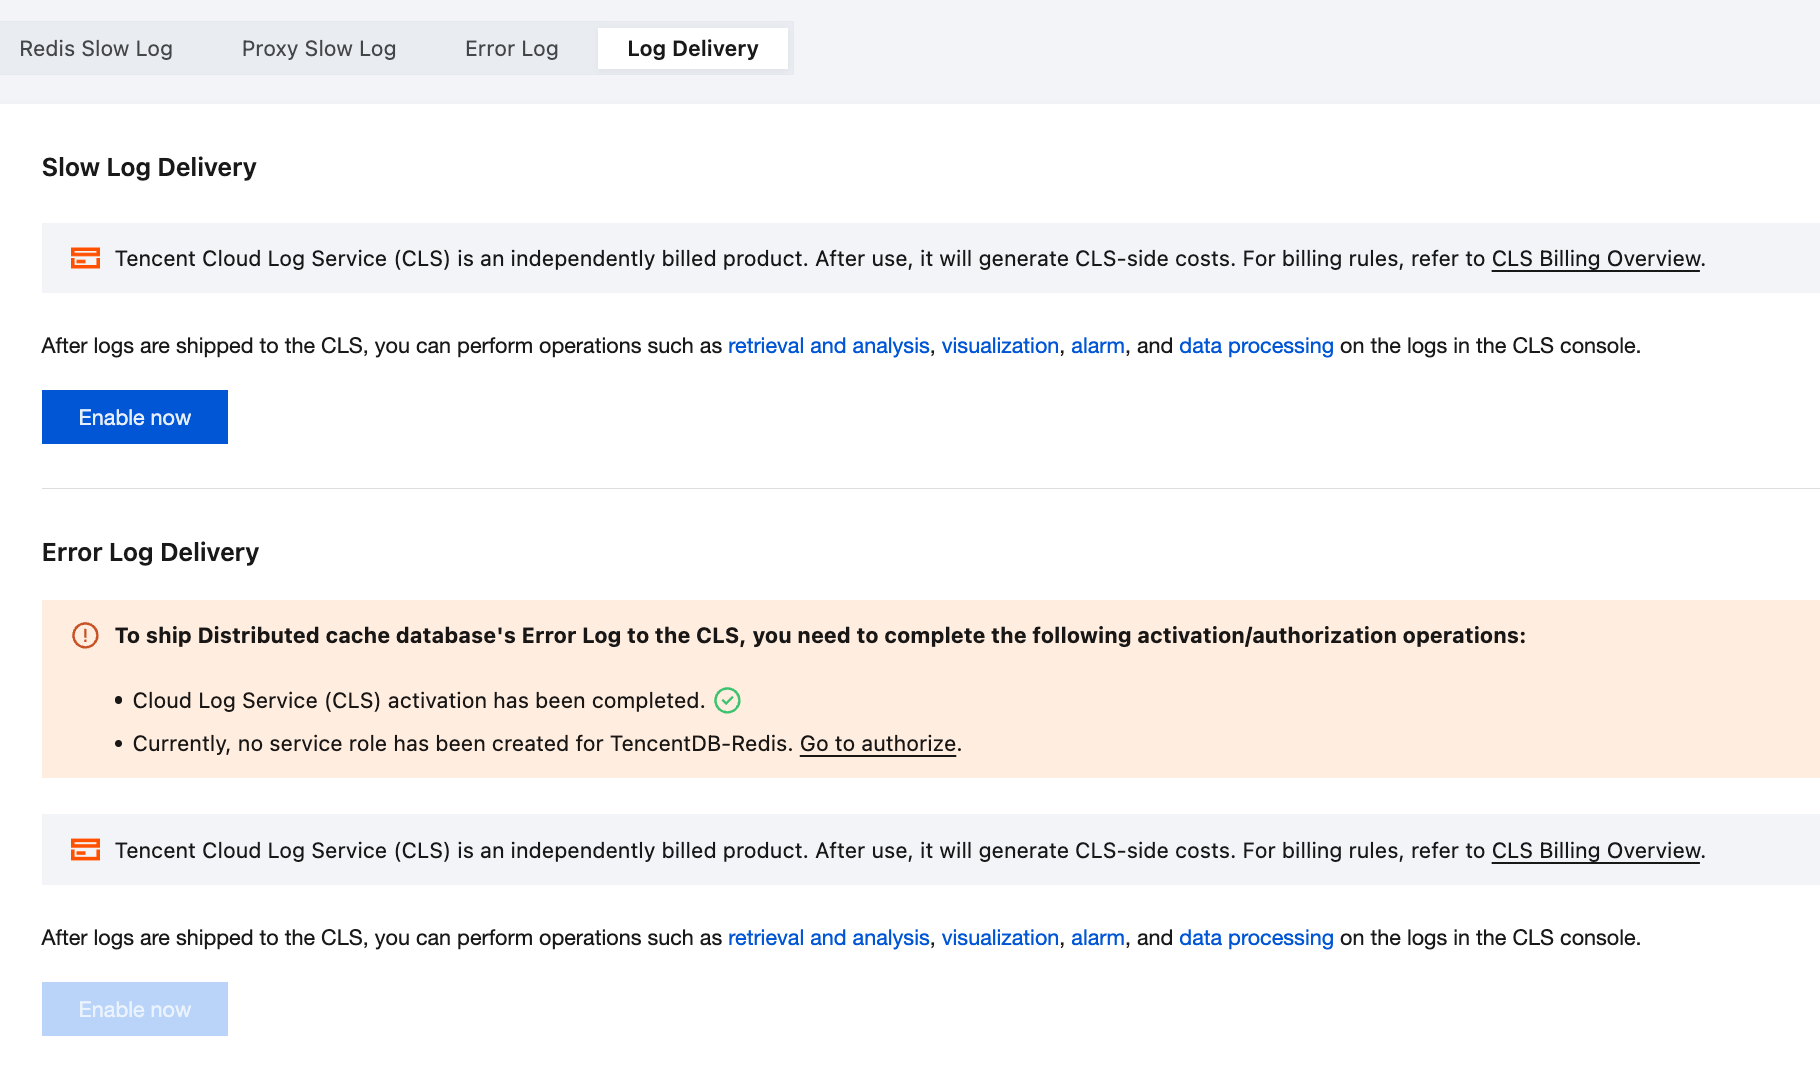
Step 2: Enable Slow Log Delivery
1. In the Slow Log Delivery area, click Enable Now to enable slow log delivery.
2. In the pop-up Enable Log Delivery dialog box, configure the log delivery parameters and click Enable Now. For descriptions of the configuration parameters, see the table below.
Parameter | Description | Field Example |
Destination region | Select the region for log delivery. Cross-region delivery is supported. | Guangzhou |
Log topic operations | A log topic (Topic) is the fundamental unit in CLS for log data collection, storage, search, and analysis. Log data is actually stored in log topics. Each log topic belongs to a logset. You can select an existing log topic or create a new one. Select existing log topic: This option ships logs to a log topic that has already been created. Create Log Topic: This option creates a new log topic as the destination for this log delivery task. | Creates log topics. |
Log Topic | Log topic operations is Select existing log topic: Select the target log topic from the drop-down list. Log topic operation is Create Log Topic: Enter the log topic name according to the naming rules. For specific requirements, see CLS Log Topic. | proxy_slow_log_topic |
Logset Operation | A logset (Logset) is a project management unit in CLS for categorizing and grouping log topics. It typically corresponds to a project or business. It does not store any log data itself. A logset can contain multiple log topics. Select the existing logset: This option assigns the aforementioned log topic to a logset that has already been created. Create Logset: This option creates a new logset to group the log topics created for this delivery task. | Create a logset. |
Logset | Logset Operation is Select the existing logset: Filter for the target logset in the drop-down list. Logset Operation is Create Logset: Edit the logset name according to the naming requirements. For specific requirements, see CLS Logset. | redis_slow_logset |
3. After successful enabling, the delivery status in the Slow Log Delivery area is displayed as Enabled. The title row also displays an orange "Independent Billing" tag, indicating that delivery to CLS involves independent billing.
Click a specific logset or log topic to navigate to its corresponding details page in the CLS console.
Click Search and Analysis to navigate to the CLS Search & Analysis page.
Step 3: Enable Error Log Delivery
Note:
The logset and log topic for error log delivery can be shared with those for slow log delivery, or they can be created independently to facilitate the classified management of different log types.
1. In the Error Log Delivery area, click Enable Now to enable error log delivery.
2. In the pop-up Enable Log Delivery dialog box, configure the log delivery parameters and click Enable Now. The parameter descriptions are consistent with those for slow log delivery. For details, see the configuration parameter description table in Step 2.
3. After successful enabling, the delivery status in the Error Log Delivery area is displayed as Enabled.
Click a specific logset or log topic to navigate to its corresponding details page in the CLS console.
Click Search & Analysis to navigate to the CLS Search & Analysis page.
Step 4: View and Analyze Delivery Logs
On the CLS Search & Analysis page, you can perform the following analysis operations on audit logs:
Configure Index: Before the first search, you must enable full-text or key-value indexing for the log fields to be searched (such as command type, client IP address, and user account). Logs can be searched and analyzed only after indexing is enabled. For specific operations, see Index Configuration.
Search Logs: Use keywords to perform full-text searches, or perform key-value searches by fields (such as command type, client IP address, and execution time) to quickly locate target log entries. For details, see Search & Analysis.
Statistical Analysis: Use SQL to perform aggregate statistics on search results, for example, grouping by command type to count execution times or grouping by client IP address to analyze access distribution. For details, see Statistical Analysis.
Visualization & Alarms: Build visual dashboards based on analysis results, or configure alarm policies to provide real-time warnings for behaviors such as high-risk command execution and abnormal access IPs. For more information, see Dashboards and Monitor & Alarm.
Step 5: Disable Log Delivery
Note:
After log delivery is disabled, logs will no longer be uploaded to CLS. However, historical logs that have already been shipped will continue to be stored in the log topic until they expire, and CLS log storage fees will continue to be charged during this period. To stop billing completely, delete the corresponding log topic in the CLS console.
Disabling Slow Log Delivery
1. On the Log Delivery page, in the Slow Log Delivery area, click Disable Shipping in the upper-right corner.

2. In the Disable access logs dialog box that appears, review the note that After the log shipping is disabled, shipping of Distributed cache database logs will be stopped, select the Disable checkbox, understand the impact after disabling, and then click Confirm.
3. Wait for the task to complete.
Disabling Error Log Delivery
1. On the Log Delivery page, in the Error Log Delivery area, click Disable Shipping in the upper-right corner.
2. In the Disable access logs dialog box that appears, review the note that After the log shipping is disabled, shipping of Distributed cache database logs will be stopped, select the Disable checkbox, understand the impact after disabling, and then click Confirm.
3. Wait for the task to complete.
API
API Name | Functional Description | API Documentation Link |
ModifyCloudProductLogCollection | Modify instance log delivery configuration | |
DescribeCloudProductLogTasks | Query instance log delivery configuration |
FAQs
Why Are Log Data Not Visible in CLS After Log Delivery Is Enabled?
Check the following items: whether the CLS service has been activated and the service role has been authorized; whether the logset and log topic have been created successfully; and whether the delivery status is displayed as Enabled. If all the above items are normal, wait for 1 - 2 minutes and then refresh the page, as there may be a brief latency in the log data.
Can Error Logs and Slow Logs Be Shipped to the Same Log Topic?
Yes. Slow log delivery and error log delivery can be configured to use the same logset and log topic. It is recommended to create independent log topics for different types of logs to facilitate classified management and search.
Will CLS Continue to Charge After Log Delivery Is Disabled?
After log delivery is disabled, Redis will no longer upload new logs. However, historical logs that have already been shipped will continue to be stored in the log topic, and CLS will continue to charge log storage fees until the logs expire or are manually deleted.
References
Help and Support
Was this page helpful?
You can also Contact sales or Submit a Ticket for help.
Help us improve! Rate your documentation experience in 5 mins.
Feedback