Slow log (Redis/ValKey Edition)
Download
Modo Foco
Tamanho da Fonte
Distributed Cache provides a slow query feature. This feature collects slow query requests from Redis nodes and Proxy nodes separately, recording key information such as command content, execution time, and client source. This document guides you on how to view, filter, and export slow query logs on the console.
Overview
The slow query feature collects requests that exceed the execution time threshold in Redis engine and Proxy nodes. It records information such as command content, execution time, and client source. This helps you quickly identify the specific commands and nodes causing latency and analyze the root cause of performance degradation. Typical use cases are as follows:
When business response latency fluctuates: Filter slow queries by time range, execution time threshold, and node role to pinpoint the commands and nodes causing the latency within seconds, enabling rapid business performance restoration.
Before launching a new feature: Evaluate whether the execution time of Redis commands involved in the new business module falls within the expected range. This helps avoid performance degradation of the overall response due to slow commands after launch.
Regular Database Performance Inspection: Regularly review slow query records to identify abnormal command patterns in advance, preventing potential issues.
Long-term Trend Monitoring: Deliver slow logs to CLS. Leverage its search, analysis, and dashboard capabilities to track slow query trends over the long term and set up alarms.
Feature List
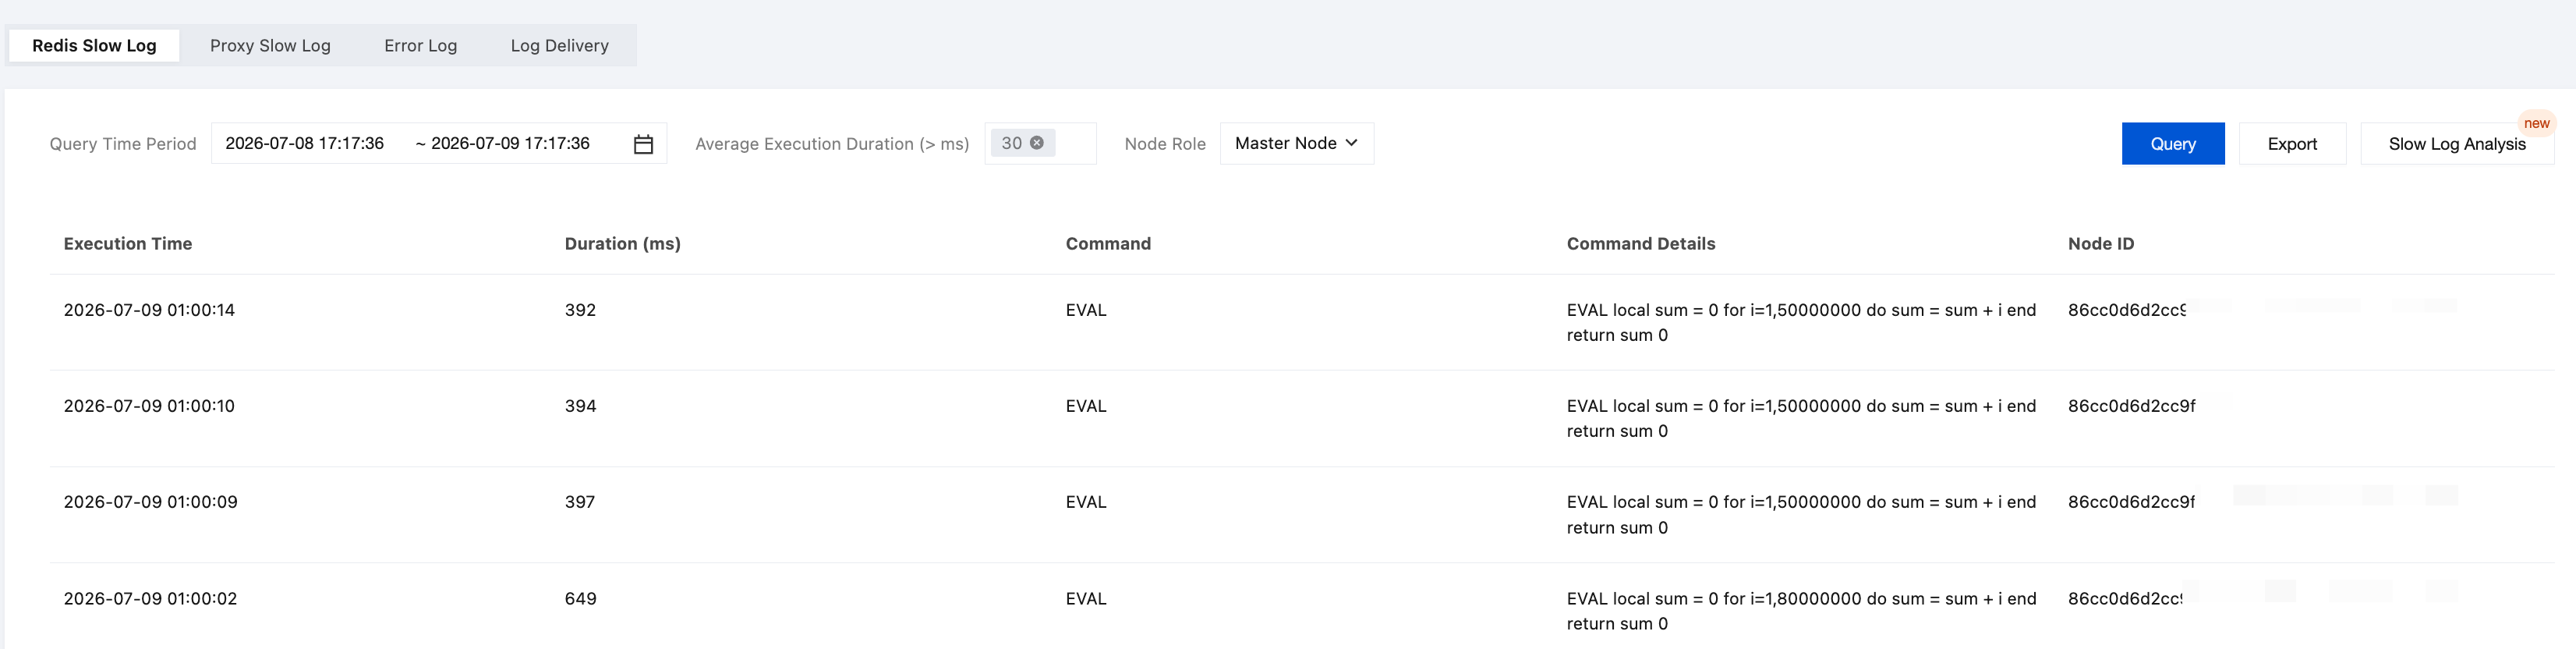
Redis Slow Query: This feature collects slow query records generated when requests pass through Redis nodes. The records include command content, execution time, execution duration, and command details.
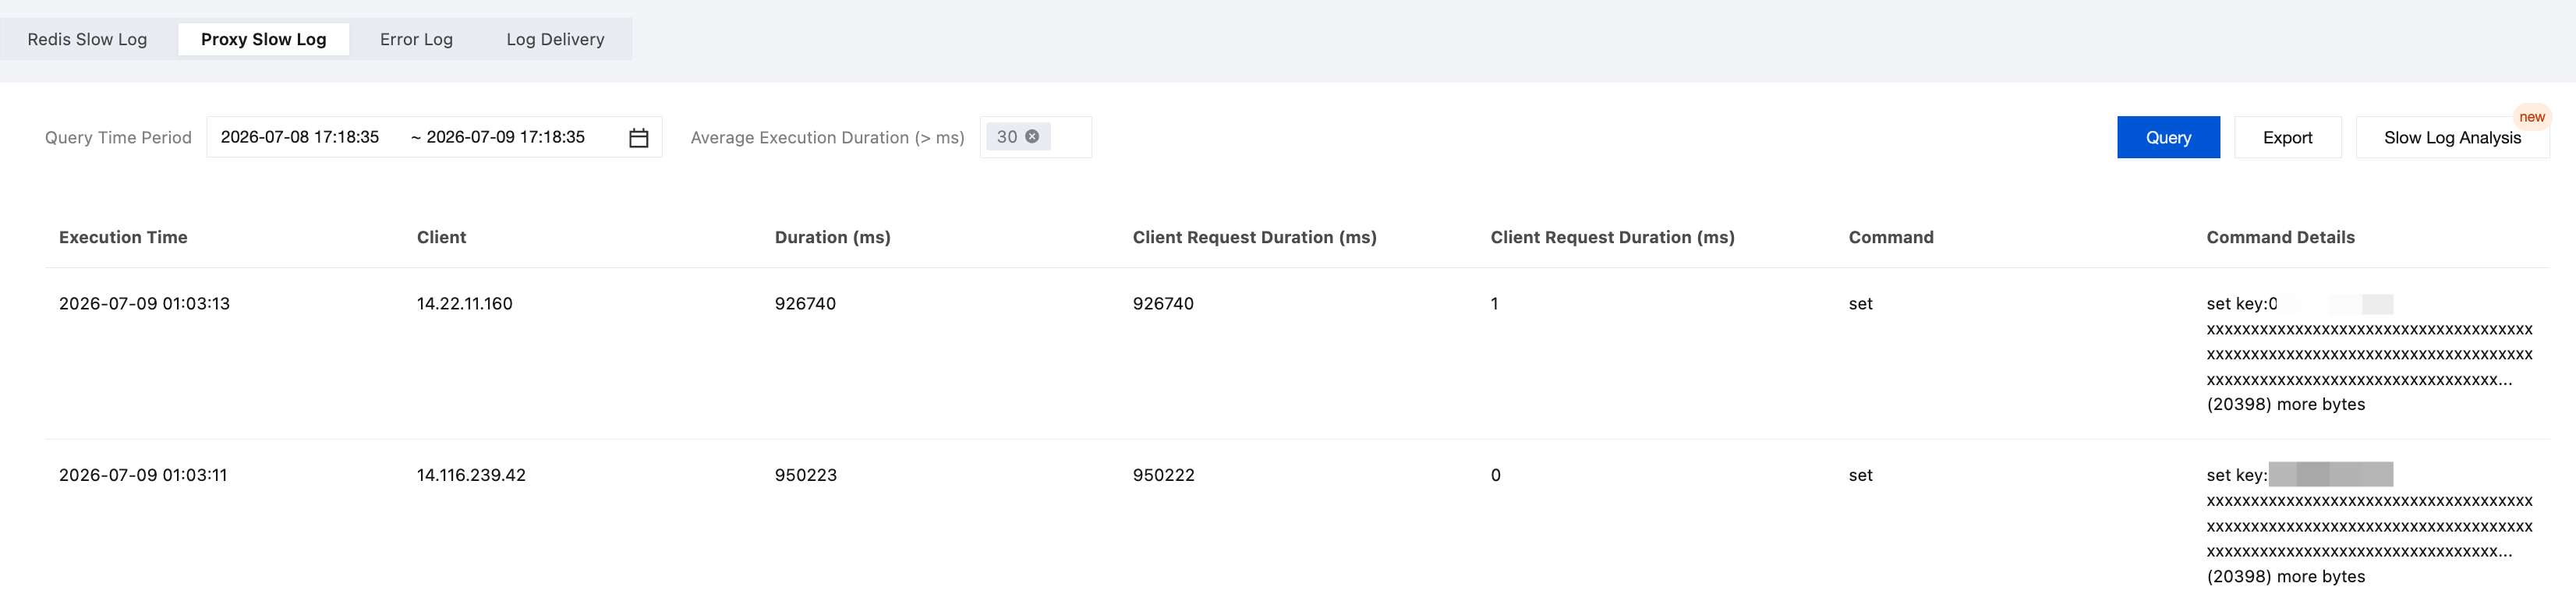
Proxy Slow Query: This feature collects slow query records generated by the middleware proxy node. It records the client IP address, command, execution time, and details.
Slow Query Analysis: The slow query analysis service provided by DBbrain supports slow log statistics and time consumption distribution at the instance level and the Proxy level. For details, see Slow Log Analysis.
Prerequisites
A Tencent Cloud Distributed Cache instance has been created.
The database instance is in Running status.
Use Limits
Item | Description |
Product Version | The Memcached edition does not support the slow query feature. |
Log retention period | Slow logs are retained for 15 days. |
Query Frequency | The default account can query up to 15,000 times per second, and a custom account can query up to 20 times per second. |
Query performance | If query results are returned slowly, narrow the time range or add filter conditions. |
Field Description
Redis Slow Query Fields
Field Name | Description |
Execution Time | The specific time point when a slow query occurs, accurate to the second, used to locate the moment the slow query appears and align it with business logs and monitoring curves. |
Duration (ms) | The actual time consumed by the command's execution on the Redis node, measured in milliseconds. A larger value indicates a slower command, making it the core metric for determining the severity of a slow query. |
Command | The type of request command that generates a slow query, such as get, set, eval, and so on, used to quickly identify which type of operation caused the latency. |
Command Details | The complete content of the command, including the Key and specific parameters, which can be used to locate the involved data objects and determine whether there are big keys or complex operations. |
Node ID | The identifier of the Redis node that generated this slow query. In a cluster architecture, this field can be used to distinguish the source of the slow query and locate the specific shard or node. |
Proxy Slow Query Fields
Field Name | Description |
Execution Time | The specific time point when a slow query occurs, accurate to the second, used to locate the moment the slow query appears and align it with business logs and monitoring curves. |
Client | The IP address of the client that initiated the request, used to locate the source business or application node of the slow query and facilitate troubleshooting of the specific caller. |
Duration (ms) | The overall processing time of the request at the Proxy node, measured in milliseconds, covering the complete path from receiving the request to returning the response, reflecting the latency actually perceived by the client. |
Client Request Duration (ms) | The time consumed by the Proxy to receive and read client request data, measured in milliseconds. A high value is usually related to poor client network quality or an oversized request body. |
Client Request Sending Duration (ms) | The time consumed by the Proxy to return response data to the client, measured in milliseconds. A high value is usually related to an oversized returned result set or slow client reception. |
Command | The type of request command that generates a slow query, such as get, set, eval, and so on, used to quickly identify which type of operation caused the latency. |
Execute Command | The complete content of the command, including the Key and specific parameters, which can be used to locate the involved data objects and determine whether there are big keys or complex operations. |
Directions
Step 1: Go to the Slow Query Page
1. Log in to the Tencent Cloud Distributed Cache console.
2. Above the
3. In the instance list, click the target instance ID to go to the Instance Details page.
4. Select the Log Center tab.
To view Redis node slow queries, select the Redis Slow Log sub-tab.
To view Proxy slow queries, select the Proxy Slow Log sub-tab.
Step 2: Query Slow Query Records
1. On the Redis Slow Log or Proxy Slow Log sub-tab, configure the following filter criteria:
Query Time Period: Select the time range to query. The time span must not exceed 15 days.
Average Execution Duration: Select the threshold for the duration that a command request exceeds.
The slow query feature supports seven thresholds: 1ms, 5ms, -10ms, 20ms, 30ms, 40ms, and 50ms. The default threshold is 30ms.
The slow query feature supports five thresholds: 10ms, 20ms, 30ms, 40ms, and 50ms. The default threshold is 30ms.
Node Role: This option is available only on the Redis Slow Log sub-tab. Select the node role for the query. You can choose Master Node or Replica Node.
2. Click Query. The system returns a list of slow query records for the current node. These records are for queries whose execution time exceeds the average within the specified time range. The fields for Redis slow queries and Proxy slow queries are slightly different. For details, see Field Description.
Note:
If query results are returned slowly, narrow the time range or lower the average execution time threshold to reduce the amount of data scanned.
Redis Slow Query
Proxy Slow Query
Step 3: Export Slow Logs
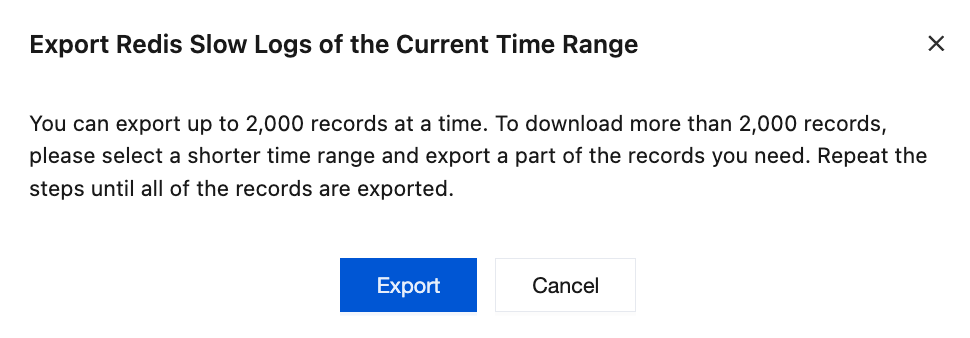
1. In the upper-right corner of the Redis Slow Log or Proxy Slow Log sub-tab, click Export.
2. In the dialog box that appears, review the limit for a single slow log export, and then click Export.
3. The system generates an Excel file and downloads it automatically. Open the file to view the complete slow query records for the exported time period.
Step 4: Analyze Slow Logs
1. In the upper-right corner of the Redis Slow Log or Proxy Slow Log sub-tab, click Slow Log Analysis.
2. The system redirects you to the DBbrain Performance Optimization > Slow Log Analysis page.
3. Select a query time range. Based on your requirements, view slow log statistics, segment time consumption distribution, and slow query lists at the instance level or the Proxy level. For specific operations, see Slow Log Analysis.
Related APIs
API Name | Functional Description | API Documentation Link |
DescribeSlowLog | Query instance slow query logs | |
DescribeProxySlowLog | Query proxy slow queries |
Notes
Slow logs are retained for 15 days. Logs that exceed the retention period are automatically cleared. To persist slow logs, export them promptly or use the Log Shipping feature to store them in CLS.
If the instance uses a cluster architecture, slow query records from different nodes are displayed separately. You can identify their source by the node ID field.
When slow logs are exported, each export has a quantity limit. For any portion that exceeds the limit, export it in multiple batches.
FAQs
What Is the Difference Between Slow Query and Error Logs?
Slow queries log commands whose execution time exceeds a specified threshold, helping to locate performance bottlenecks. Error logs log commands that fail to execute and return error messages, aiding in troubleshooting functional exceptions. As they focus on different dimensions, it is recommended to use them in combination.
How to Set a Reasonable Slow Query Threshold
Select a threshold based on your business scenario: for latency-sensitive real-time services (such as payment or trading), set a lower threshold (1ms - 10ms); for batch processing or background tasks, set a higher threshold (30ms - 50ms). The default value is 30ms.
Can Slow Query Logs Be Retained for a Longer Period?
Yes. You can ship slow logs to CLS using the Log Shipping feature. CLS supports a maximum log retention period of 3600 days.
References
Ajuda e Suporte
Esta página foi útil?
Você também pode entrar em contato com a Equipe de vendas ou Enviar um tíquete em caso de ajuda.
comentários