X-Pack features are Elasticsearch's official commercial features, including security, SQL, machine learning, and monitoring. It facilitates the application development and OPS management of Elasticsearch services. ES offers editions that come with such features, which you can select when purchasing and creating a cluster. The features in different editions are detailed below.
Purchase Guide
As shown in the figure above, there are options for the X-Pack features on the ES purchase page. ES offers three editions that have different X-Pack features as follows:
Item
Basic
Platinum
Open Source
X-Pack included
✓
✓
✕
X-Pack completeness
Partial
All
None
Purchase recommendation In order to be able to use more advanced features in ES, we recommend that you choose the Platinum Edition when you create a cluster. The specific features and differences of each edition are detailed below. For pricing information, please see Product Pricing.
Some features vary by editions (Basic, Platinum, and Open Source).
Some features are unavailable in earlier ES versions. For more information, please submit a ticket.
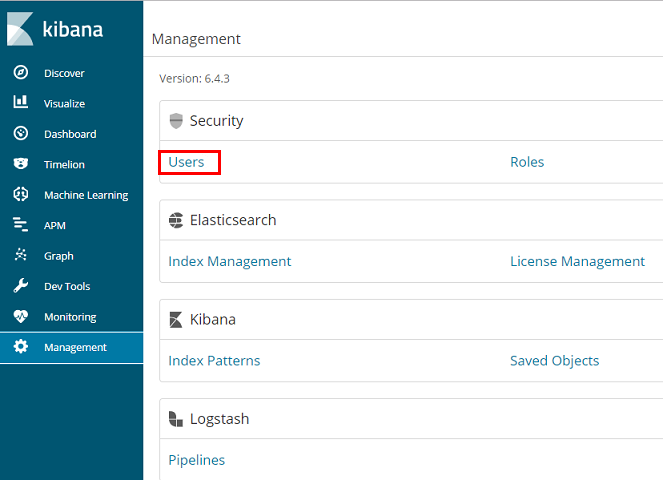
Security This feature supports refined read/write permission control at the index and field levels and effectively protects data security by enabling data security protection and business access isolation, granting access to the right people, and preventing malicious attacks and data leakage.
Machine learning In the application scenario of custom data alerting, it is sometimes difficult to set rules and thresholds to define the changes. In this case, the trend in data changes and reasonable fluctuation range can be predicted by the unattended machine learning feature, and when the data deviates from the normal trend, alarms will be triggered and notifications sent.
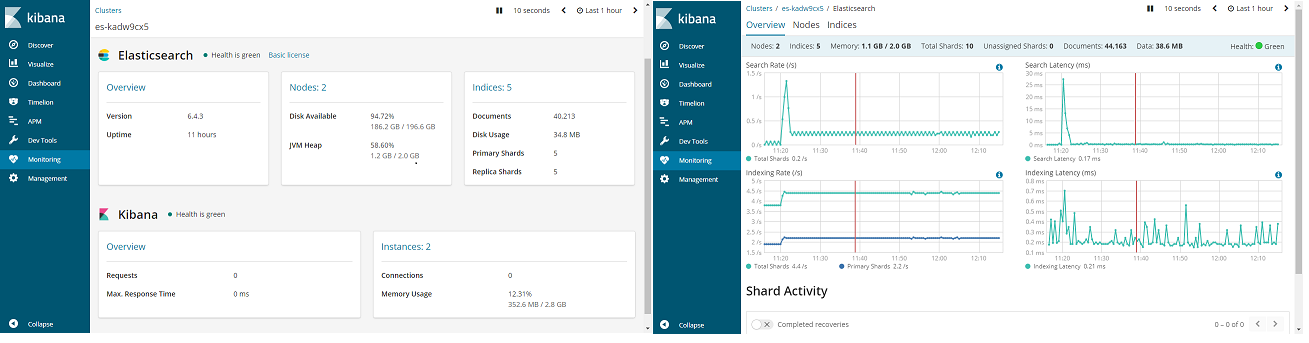
Monitoring Monitoring information can be comprehensively collected at multiple levels such as cluster, node, and index, helping you understand the cluster operations in real time and facilitating your application development and OPS.
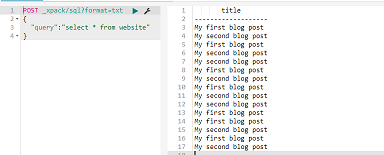
SQL This feature makes full-text search and statistical analysis of Elasticsearch data possible through traditional database SQL tools. CLI and REST access methods are supported. The Platinum Edition further supports JDBC connection. This feature enables you to seamlessly connect ES with your existing business systems and thus reduces your learning costs for new technologies.
Note:
In terms of SQL support, the Open Source Edition integrates with other SQL plugins. For more information, please see elasticsearch-sql.
Detailed comparison among editions
This section mainly compares and highlights some key features of different Elasticsearch versions. As Elasticsearch is in a stage of rapid development, and the support for various features by different versions is constantly adjusted, we do not guarantee that the following content can stay in sync with the changes in the community.
For the latest and most accurate feature comparison, please see Elasticsearch's official Elastic Stack subscriptions.