COS provides storage monitoring capabilities. The monitoring data window of COS data statistics displays data such as requests, traffic, return codes, and data reads. You can query the volume and trends of data across different storage classes by time period through the monitoring data window.
Note:
This document describes how a root account or sub-account can view the monitoring data of a single bucket. To view the aggregated information of all storage data under your account, go to Resource Usage in the COS console.
3. Find the bucket for which you want to view statistics, and click Monitoring on the right.
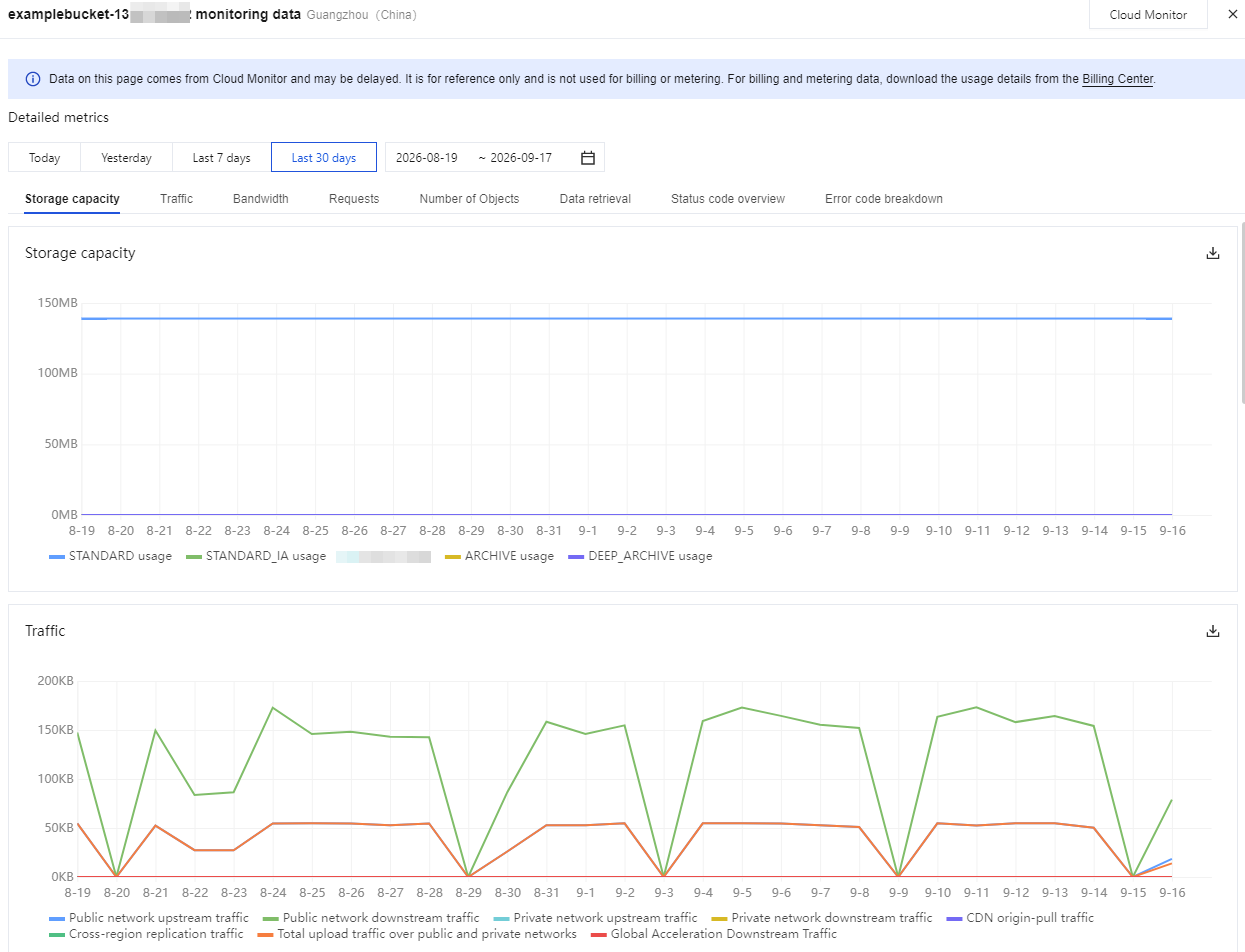
4. On the monitoring data page, you can query data by different metrics, such as storage capacity, traffic, bandwidth, requests, object quantity, data retrieval, status code overview, and error code breakdown, and by different time ranges, such as today, yesterday, the last 7 days, the last 30 days, or a custom time range, as shown in the following figure.
The specific monitoring items are described as follows:
Note:
To view more detailed data, go to Billing Center, select the desired time range, and export the data.
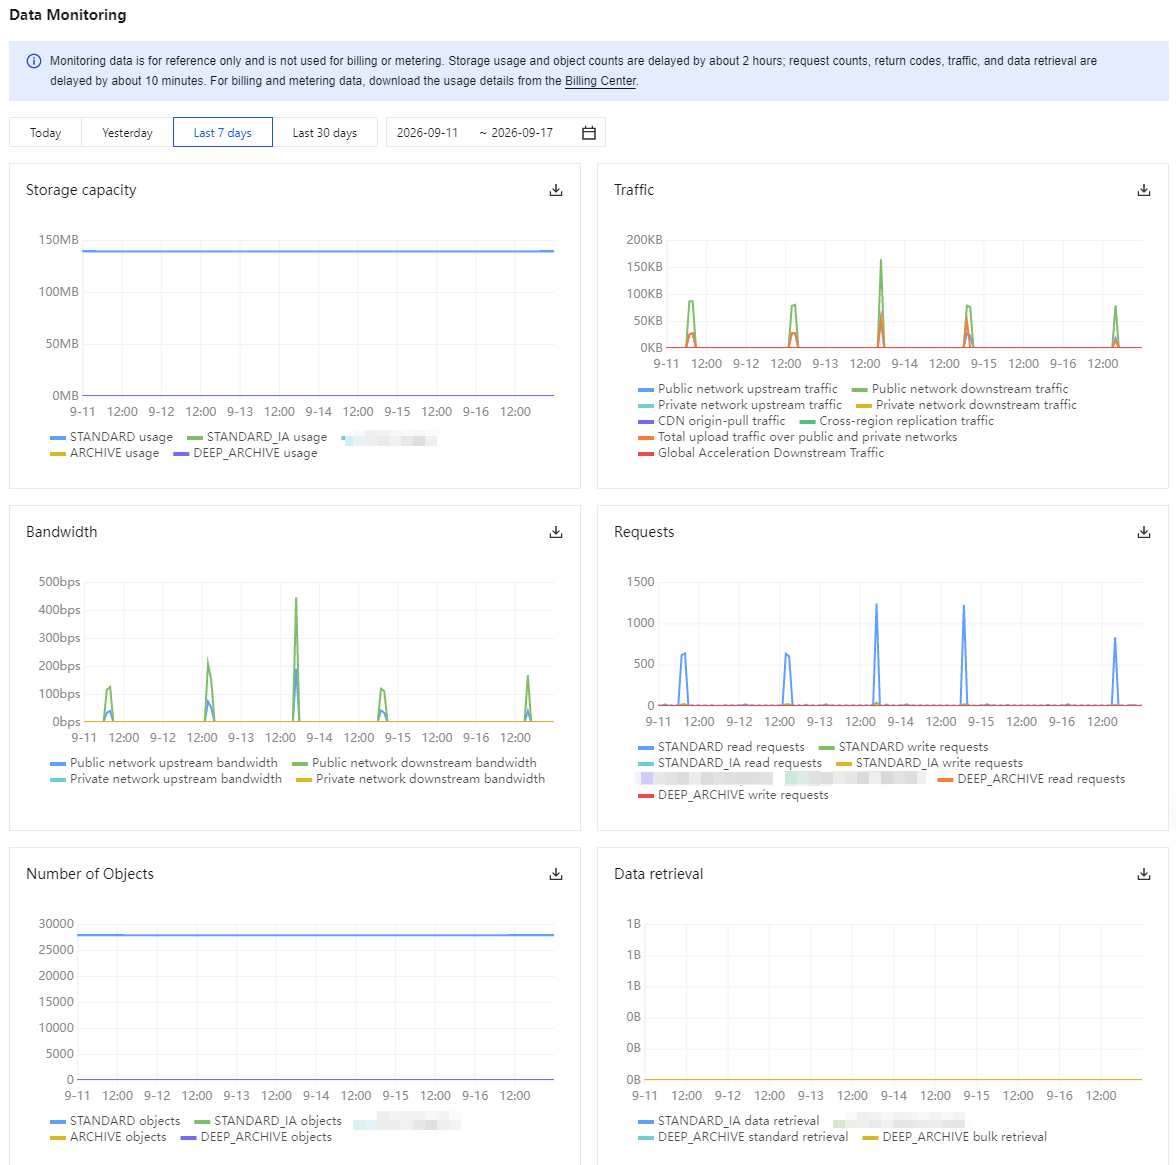
Storage capacity: You can query the storage usage of different storage classes.
Traffic: Public/Private network traffic, CDN origin-pull/cross-region replication traffic, and total upload traffic over public and private networks.
Bandwidth: Public network upstream/downstream bandwidth and private network upstream/downstream bandwidth.
Requests: Number of all requests (including GET and PUT requests), as well as read/write requests of STANDARD and STANDARD_IA.
Number of objects: The number of objects stored in a bucket, including file fragments. Number of file fragments: The number of file fragments stored in a bucket. If an upload is paused or canceled, the uploaded parts are stored in the bucket as fragments.
If versioning is enabled, multiple versions of an object are counted as separate objects.
Data retrieval: You can query the retrieval statistics of data stored in STANDARD_IA and ARCHIVE.
Status code overview: You can query the number of 2xx, 3xx, 4xx, and 5xx status codes.
Error code details: You can query the number of 400, 403, 404, 500, 501, 502, and 503 status codes.
5. You can also click the target bucket and click Data Monitoring in the left sidebar of the bucket details page to view all statistics.
Querying with Sub-account
To query monitoring data with a sub-account in the console, you need to first grant the sub-account relevant permissions.
You can grant such permissions by using a policy template or custom access policy.
Authorizing by policy template
1. Log in to the CAM console as the root account and select Users > User List to enter the user list page.
2. Find the target sub-account and click Authorize in the Operation column on the right.
3. Search for and select the QcloudMonitorFullAccess policy in the pop-up window and click OK to associate it with the sub-account. Then, the sub-account can access monitoring reports.
Attention:
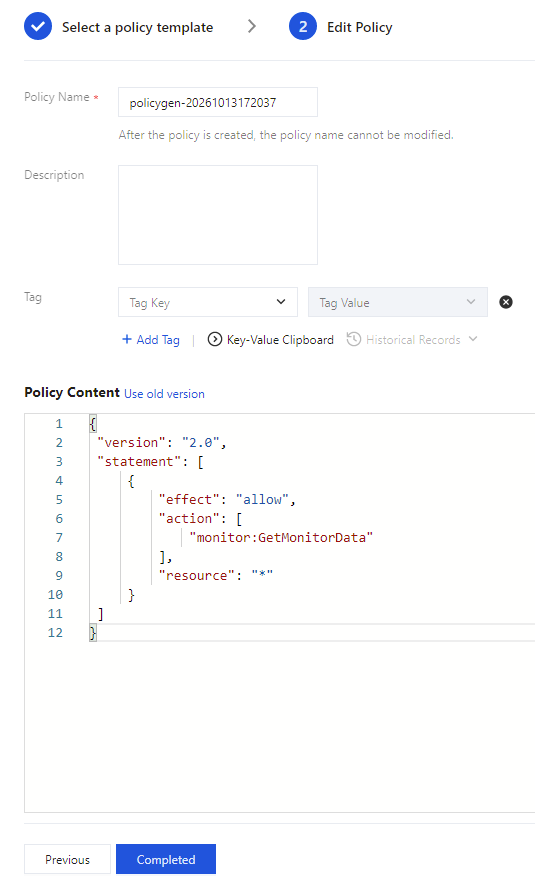
A policy template grants full access to TCOP. To protect your account security, you can configure a custom access policy with read-only permissions for sub-accounts.