Attack Analysis
Download
Focus Mode
Font Size
Viewing attack statistics
1. Log in to the new Anti-DDoS console and click Attacks on the left sidebar.
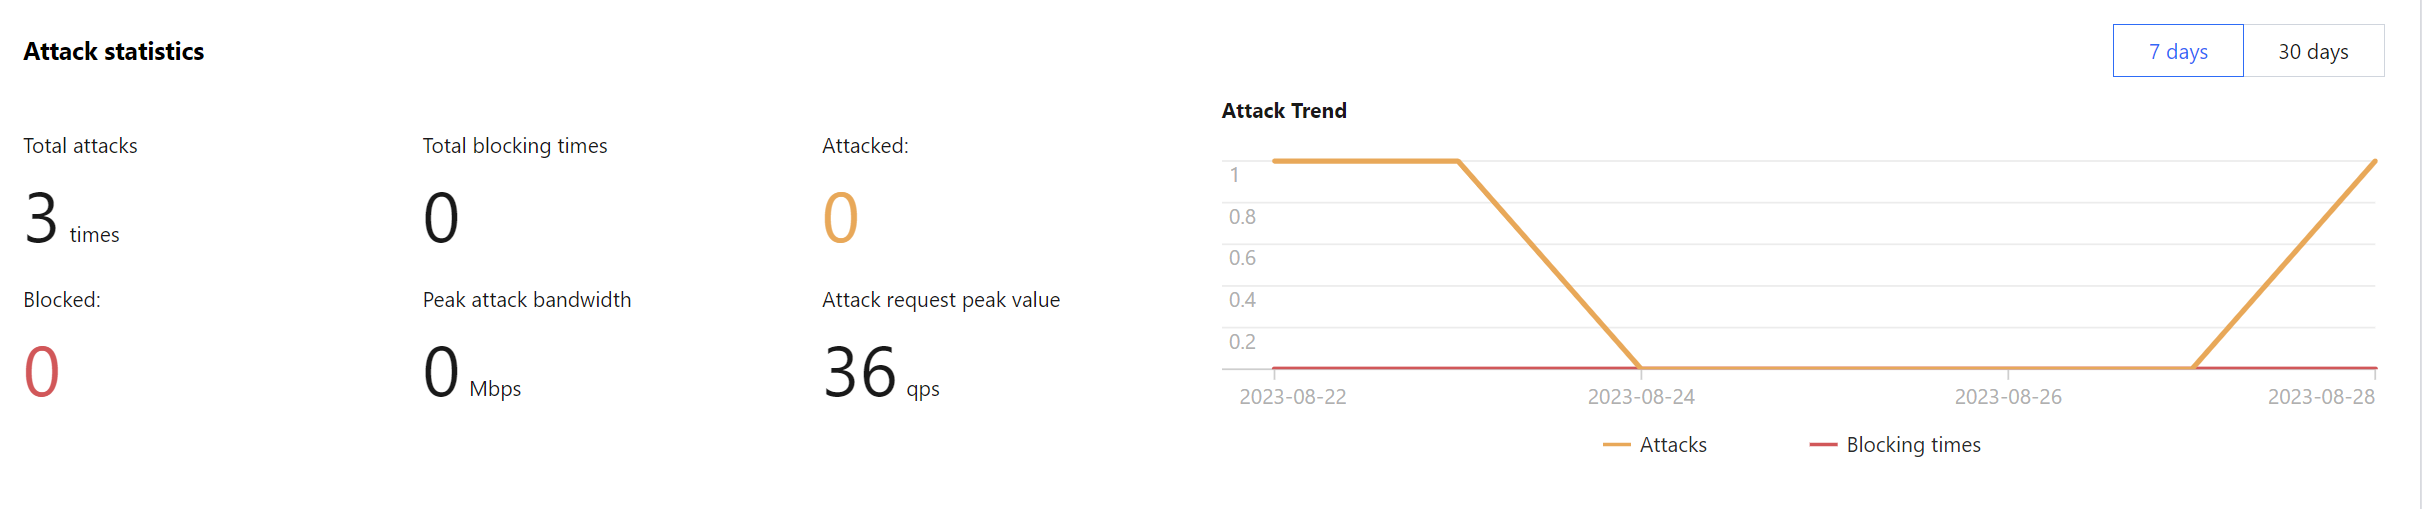
2. In the Attack statistics section, you can view the total number of attacks the current business has experienced, the total number of times of blocking, the number of ongoing attacks, the number of IPs being blocked, peak attack bandwidth, and attack request peak. On the right, you can view the 7-day and 30-day attack trends.
View recent security events
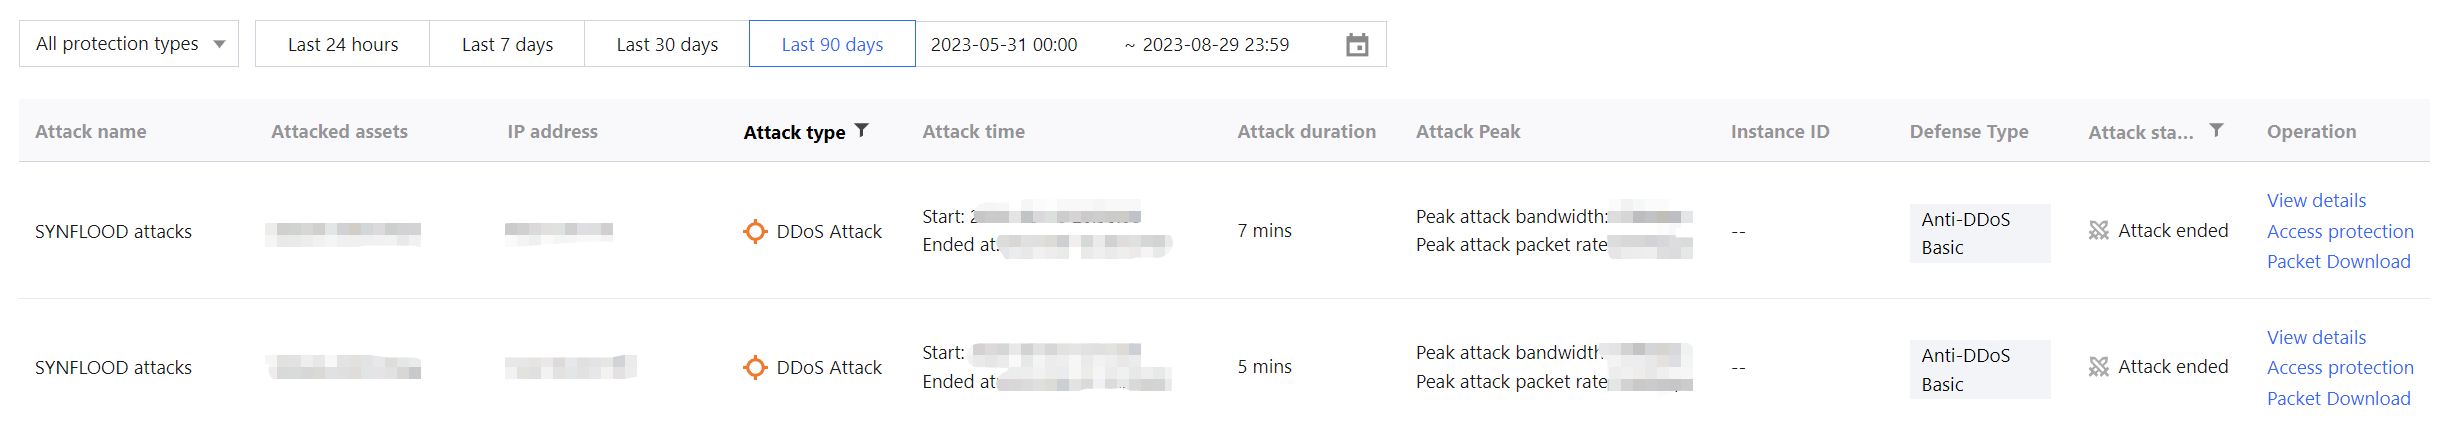
1. The event details page displays detailed information on attacks by asset ID and IP address. Such information includes attack name, attacked asset, IP address, attack time, attack duration, attack peak, instance ID, defense type, and attack status.
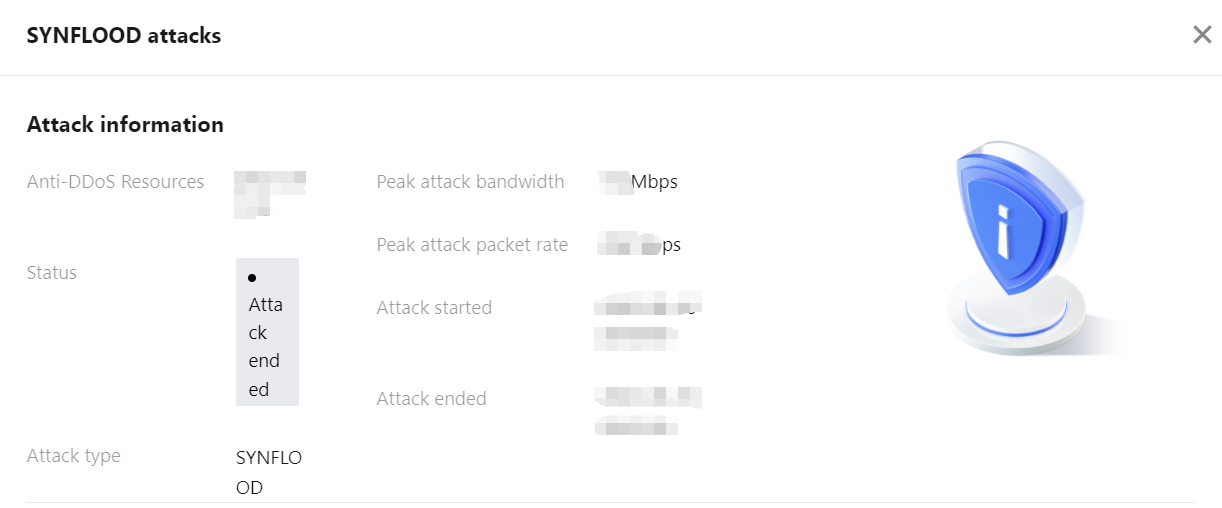
2. In the Attack information section of the event details page, you can view the detailed attack information for the selected period, including the attacked IP, status, attack type (which is sampled data), peak attack bandwidth and attack packet rate, and attack start and end time.
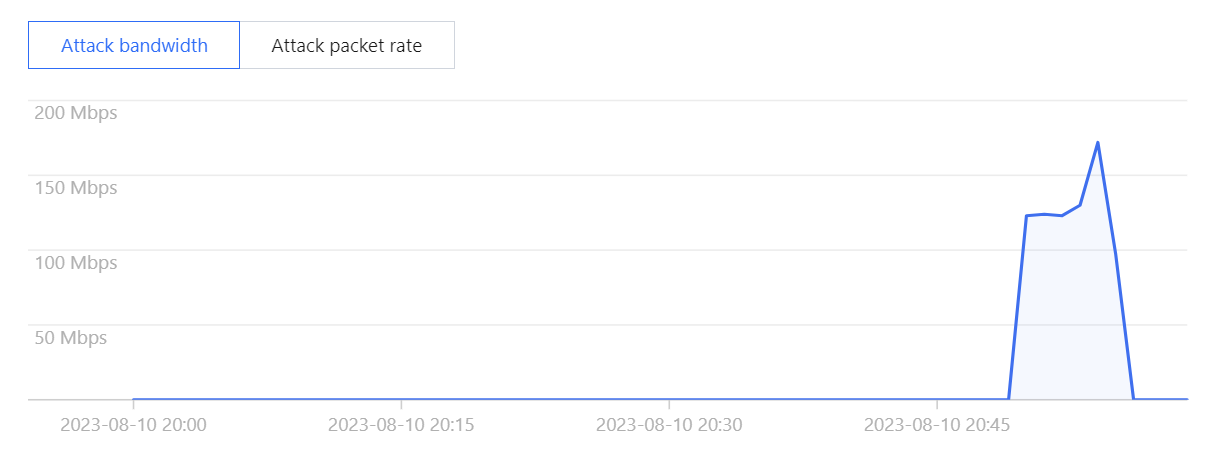
3. In the attack trend section of the event details page, you can view the trend of attack bandwidth and attack packet rate and easily find the peak traffic.
Note:
This section provides complete, real-time data in the attack period.
4. In the Attack statistics section of the event details page, you can view how attacks are distributed over different attack traffic protocols and attack types.
Note:
This section provides sampled data in the attack period.
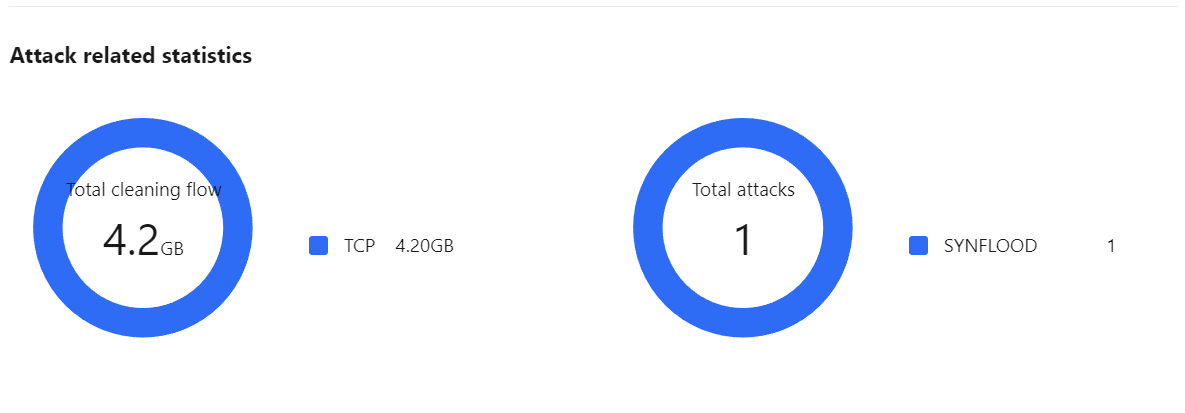
Field description:
Attack traffic protocol distribution: displays how attacks on the selected Anti-DDoS instance distribute over different attack traffic protocols within the queried period.
Attack type distribution: displays how attacks on the selected Anti-DDoS instance distribute over different attack types within the queried period.
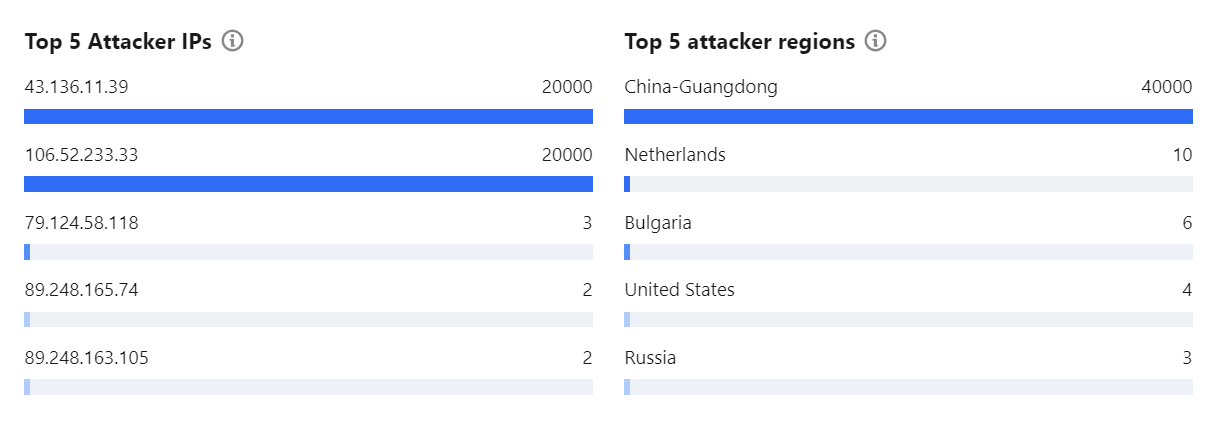
5. The Top 5 sections of the event details page display the top 5 attacker IP addresses and the top 5 attacker regions. This is helpful for precise protection configuration.
Note:
This section provides sampled data in the attack period.
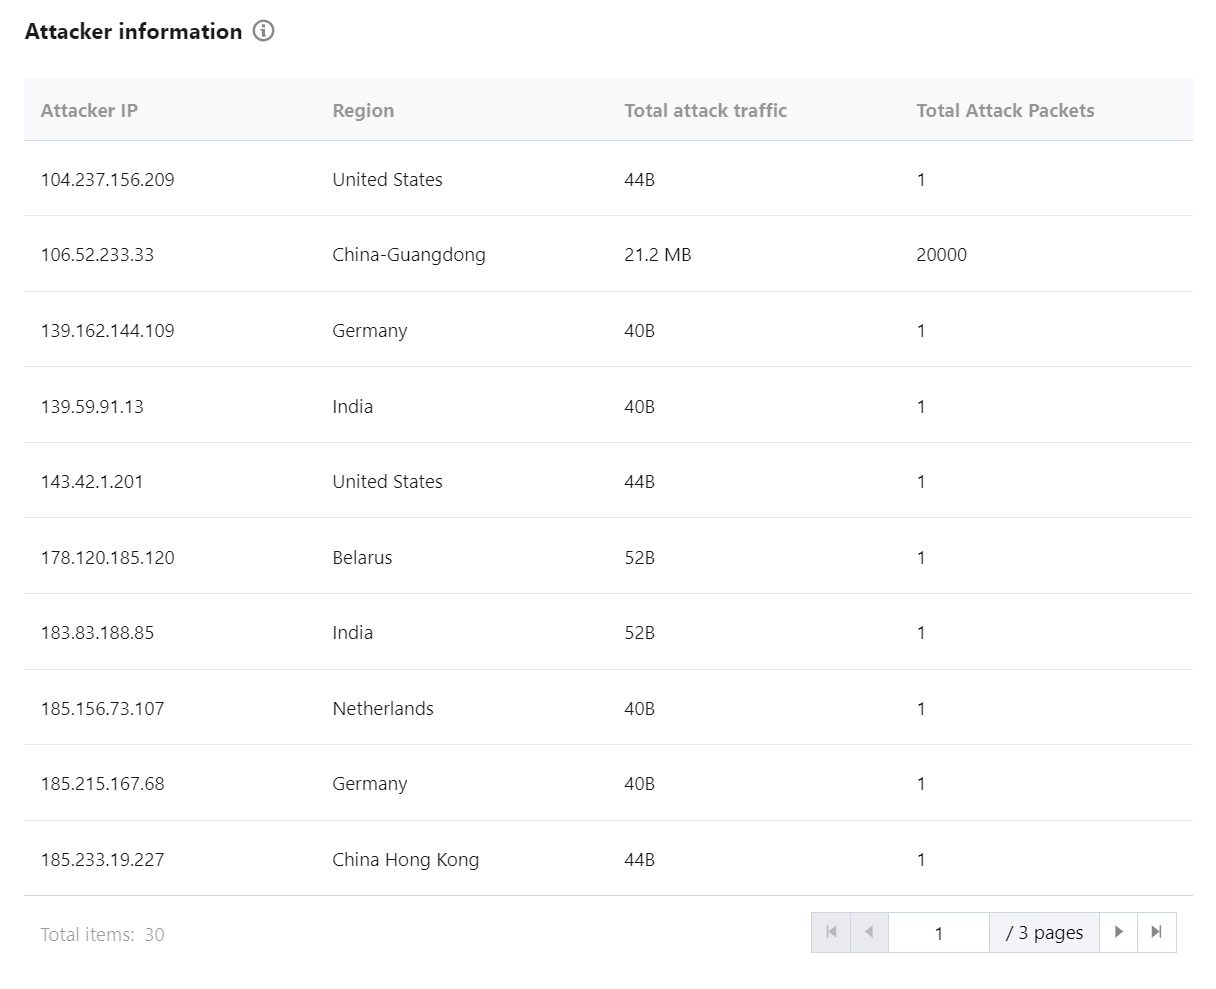
6. In the Attacker information section of the event details page, you can view the sampled data of the attack period, including the attacker IP, region, total attack traffic, and total attack packets.
Note:
This section provides sampled data in the attack period.
Help and Support
Was this page helpful?
You can also Contact sales or Submit a Ticket for help.
Help us improve! Rate your documentation experience in 5 mins.
Feedback