OpenClaw Access Guide
Download
Modo Foco
Tamanho da Fonte
Overview
This capability is an AI Agent one-stop monitoring solution built on Tencent Cloud CLS. It provides OpenClaw with out-of-the-box capabilities for cost governance, Ops observability, and session management.
With one-click access for collection, logs and metrics from OpenClaw are automatically reported to CLS. They are then visually analyzed through pre-configured observability dashboards, helping your team quickly grasp core information such as Token cost trends, system operational status, and session quality distribution.
Scenario | Capability | Benefit |
Where is the money spent? | Cost Governance Dashboard | Provides statistics on total cost, Token volume, and average session cost, supports multi-dimensional breakdown, and identifies high-cost causes. |
Is the system experiencing issues? | Ops Observability Dashboard | Monitoring message processing volume, queue depth, P95 execution latency, and number of stuck sessions, supporting correlation between log level distribution and OTEL metrics, and providing state time-series analysis |
What are users talking about? | Session Management Dashboard | Providing statistics on number of sessions, average turns, and number of tool invocations, displaying channel and model distribution, and supporting viewing of complete multi-turn interaction records for any session |
What happened in this session? | Session Details Dashboard | Displays session basic information and Token consumption summary, restores dialogue flow by turn, shows interaction details and per-turn cost for each turn, and supports link traceability. |
Security risk check | Security Audit Dashboard | Providing statistics on high-risk sessions, tracing sessions with high-risk command execution, auditing sensitive file access behaviors, and enabling multi-dimensional, full-link security monitoring. |
How to query raw logs | Log Search Capability | Supports filtering by server, provides conditional search and AI-powered intelligent query capabilities, and enables quick viewing of raw logs and statistical charts. |
One-Click Integration
Prerequisites
OpenClaw is installed and running. If you are using a self-built server, you can refer to the OpenClaw official website for installation.
You have activated Tencent Cloud CLS in the CLS console.
You have created TencentCloud API keys (SecretId and SecretKey). You can go to API Key Management to view or create them.
Integration Steps
Through OpenClaw in the CLS Application Center, you can one-click connect your OpenClaw on Tencent Cloud (CVM or Lighthouse). At the same time, self-built machines outside Tencent Cloud can also be one-click connected via the guide.
Step 1: Go to the Integration Page
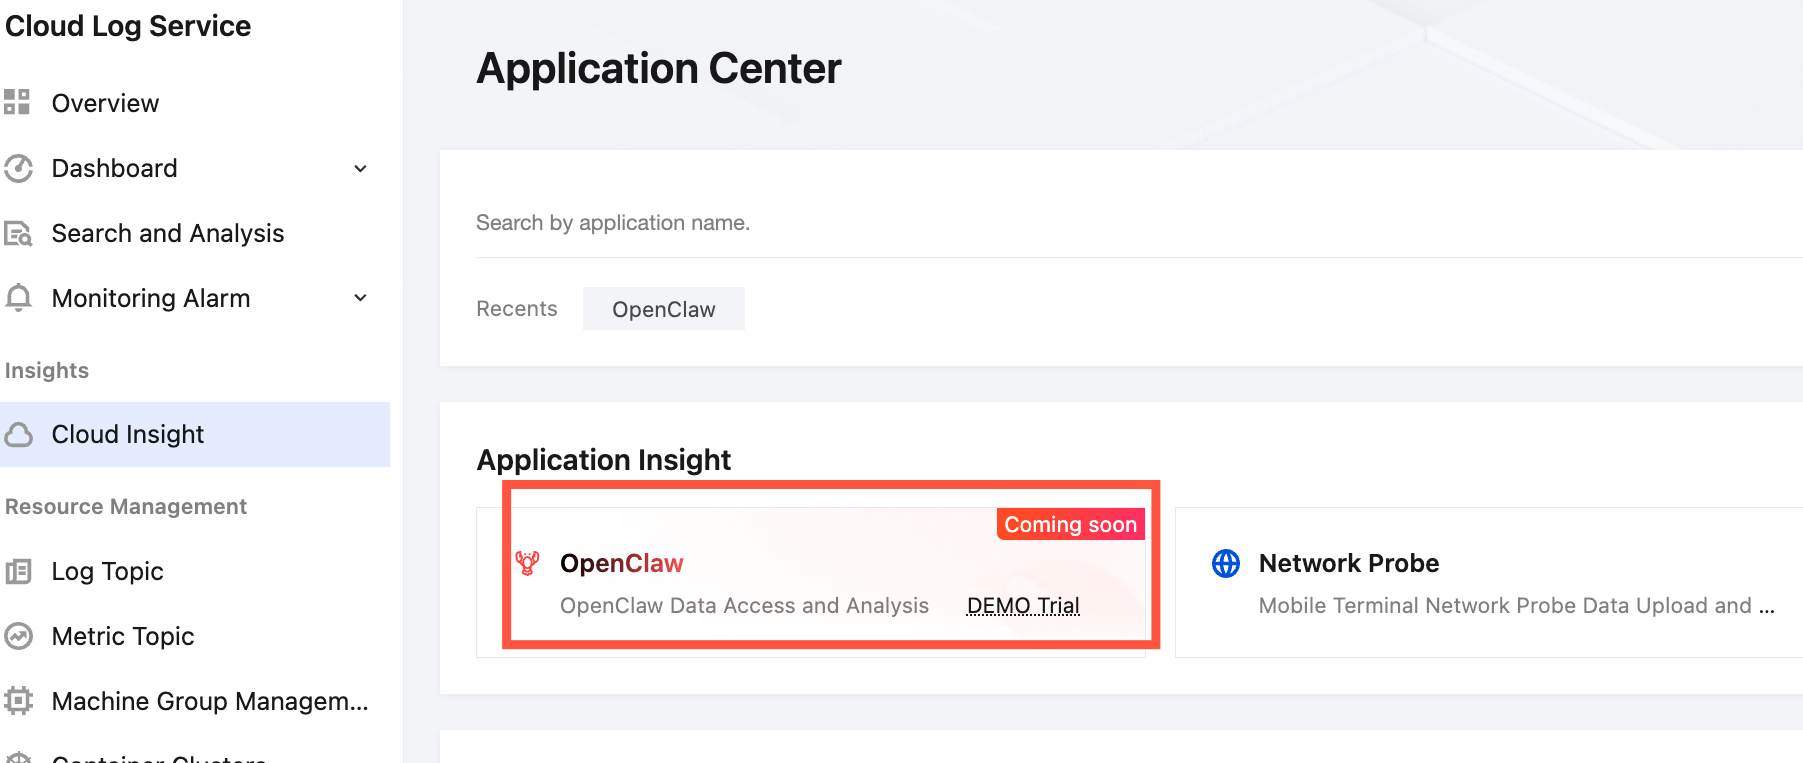
1. Go to the CLS Console > Application Center page, and click OpenClaw under Application Insights.
Step 2: Select a Server Type and Complete the Integration
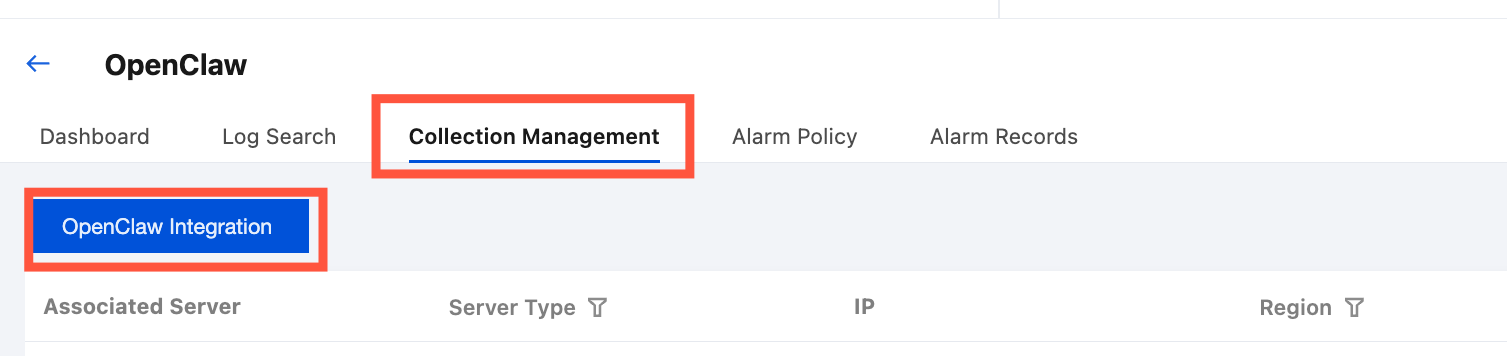
Click OpenClaw Integration in Collection Management, and select the machine where you have installed OpenClaw.
Integrating Non-Self-Built Servers (CVM, Lighthouse):
1. Select the type of non-self-built server you need to connect. In the list, select the servers that have not been collected. After selecting them, enter your TencentCloud API keys (SecretId and SecretKey) below, and click Next.
2. Wait for the execution status to finish loading and display Completed. This indicates that the connection is complete.
Integrating Self-Built Servers
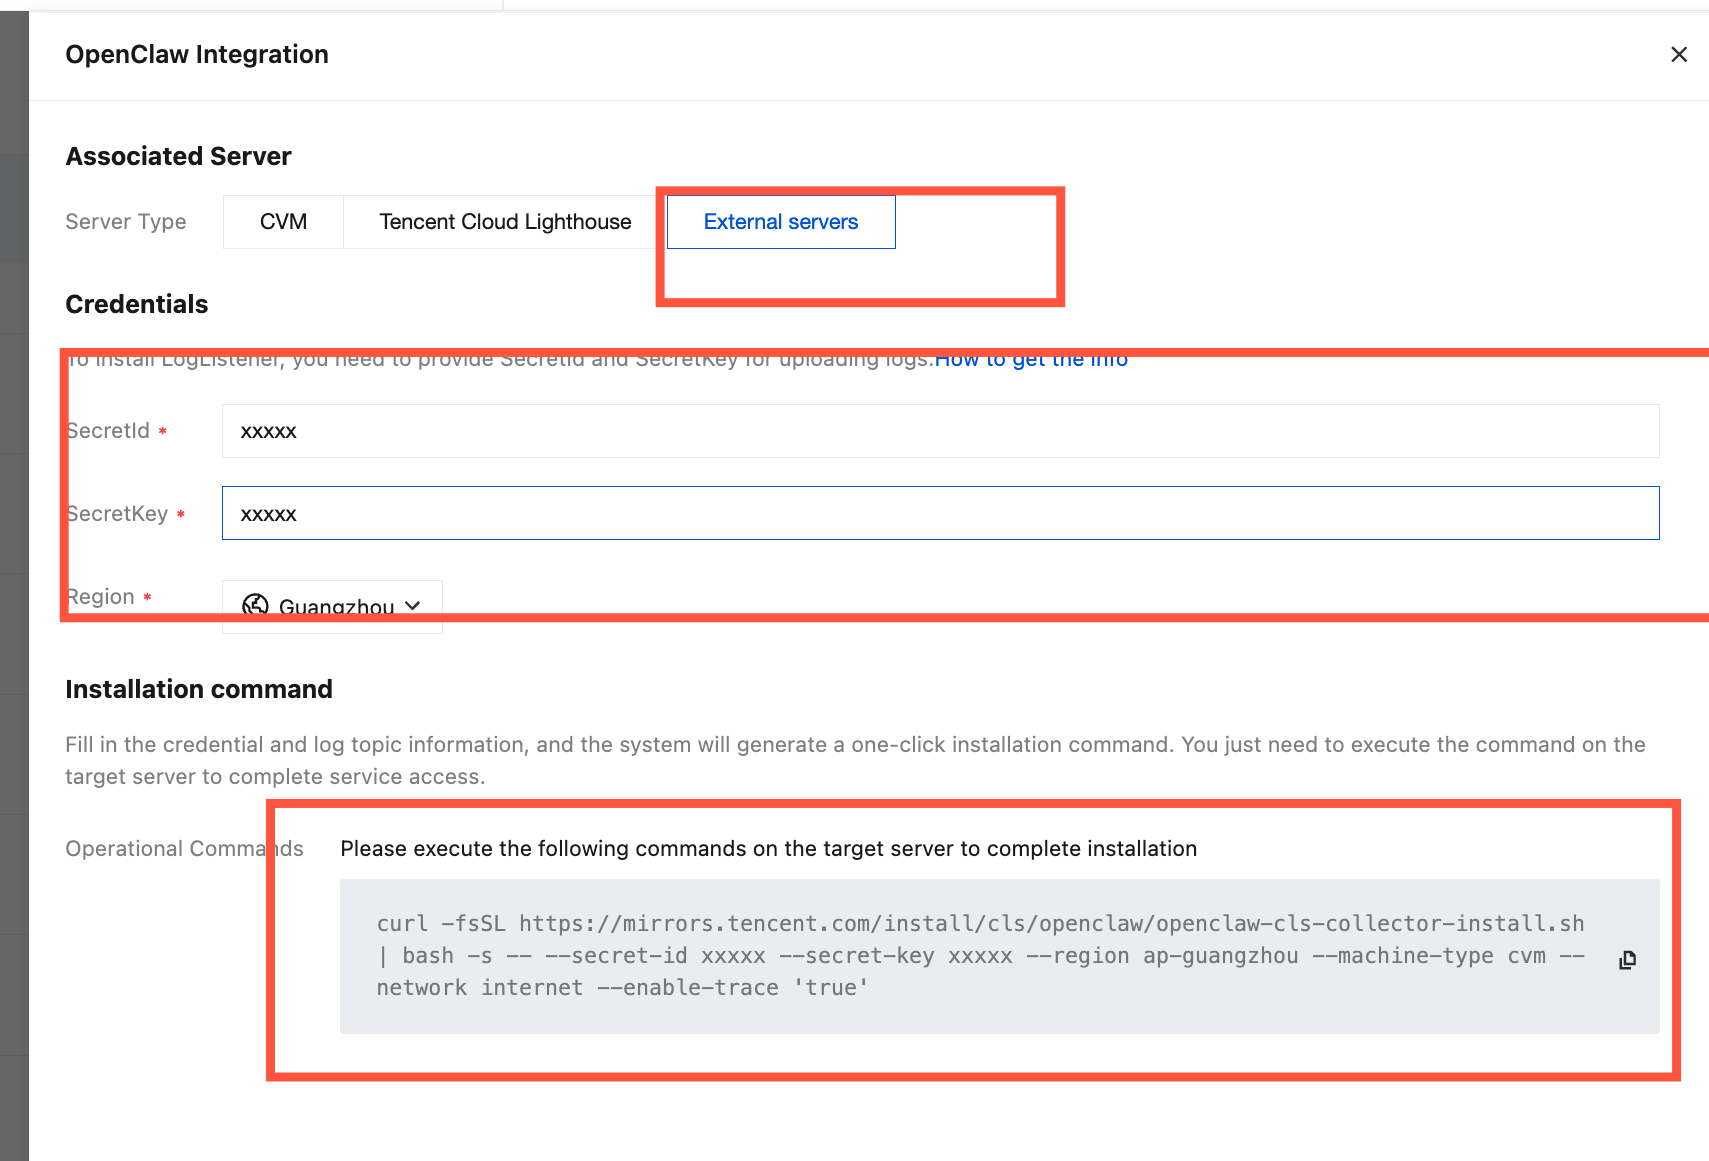
1. Select External servers. Enter your TencentCloud API keys (SecretId and SecretKey) below, and select a Region (for supported Regions, see Regions and Access Domains). After copying the operation command, click OK. Then, complete the installation on the server where you want to install it.
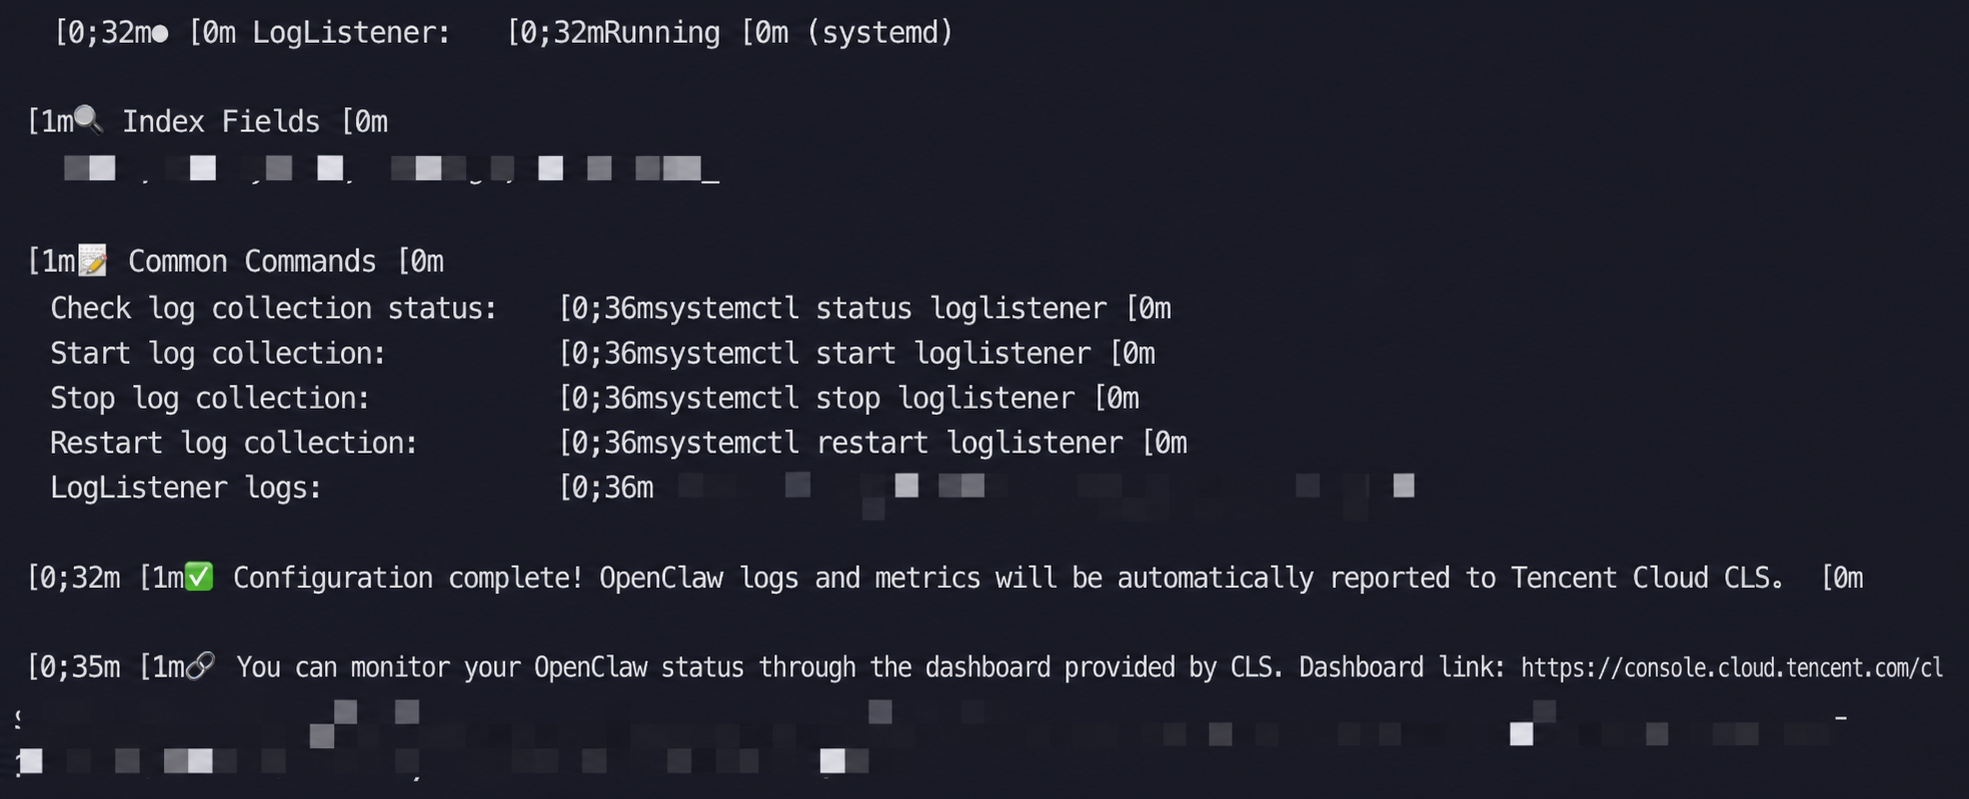
2. Execute the above command on your self-built server. The connection is complete when the result matches the figure below.
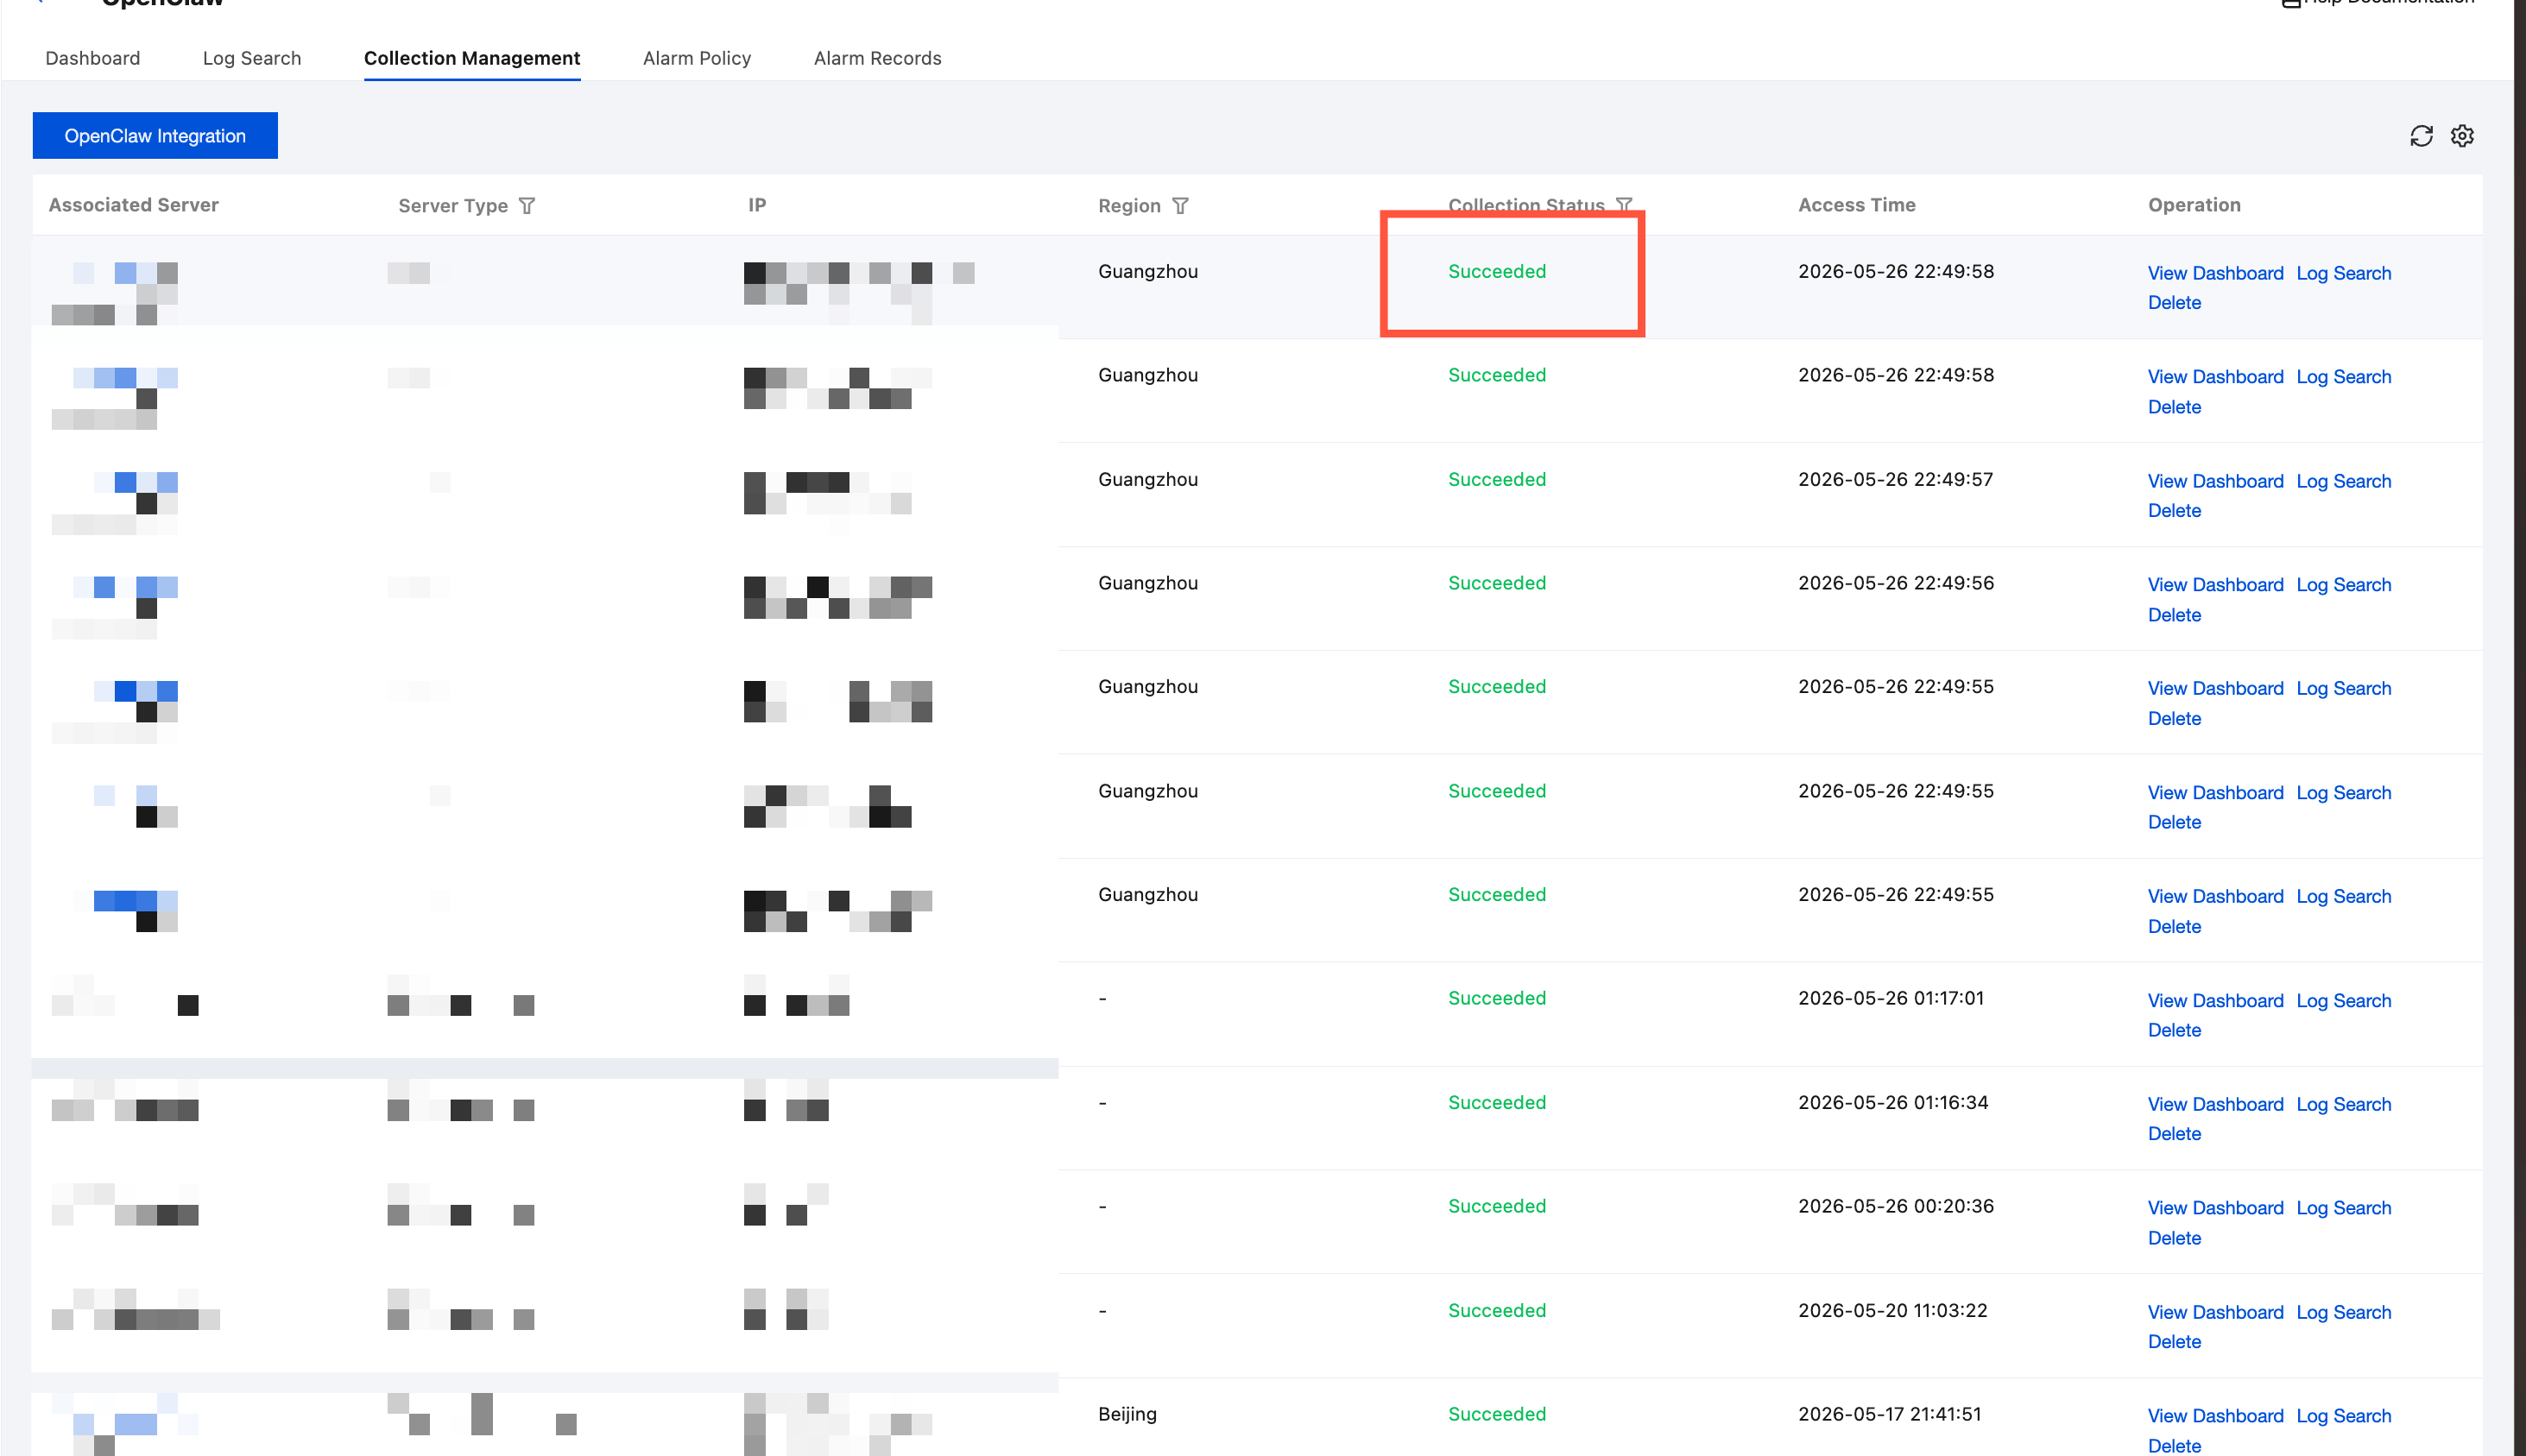
Step 3: Confirm the Integration Result
After the connection is complete, return to the Access Management list page. You can then see the newly connected OpenClaw machine on the list page.
Observability Dashboard
After the connection is complete, go to the CLS Console > Application Center > OpenClaw > Dashboard page. Choose your server to view various dashboards. The system has pre-configured five dashboards covering cost, Ops, session, and audit scenarios.
OpenClaw Cost Management
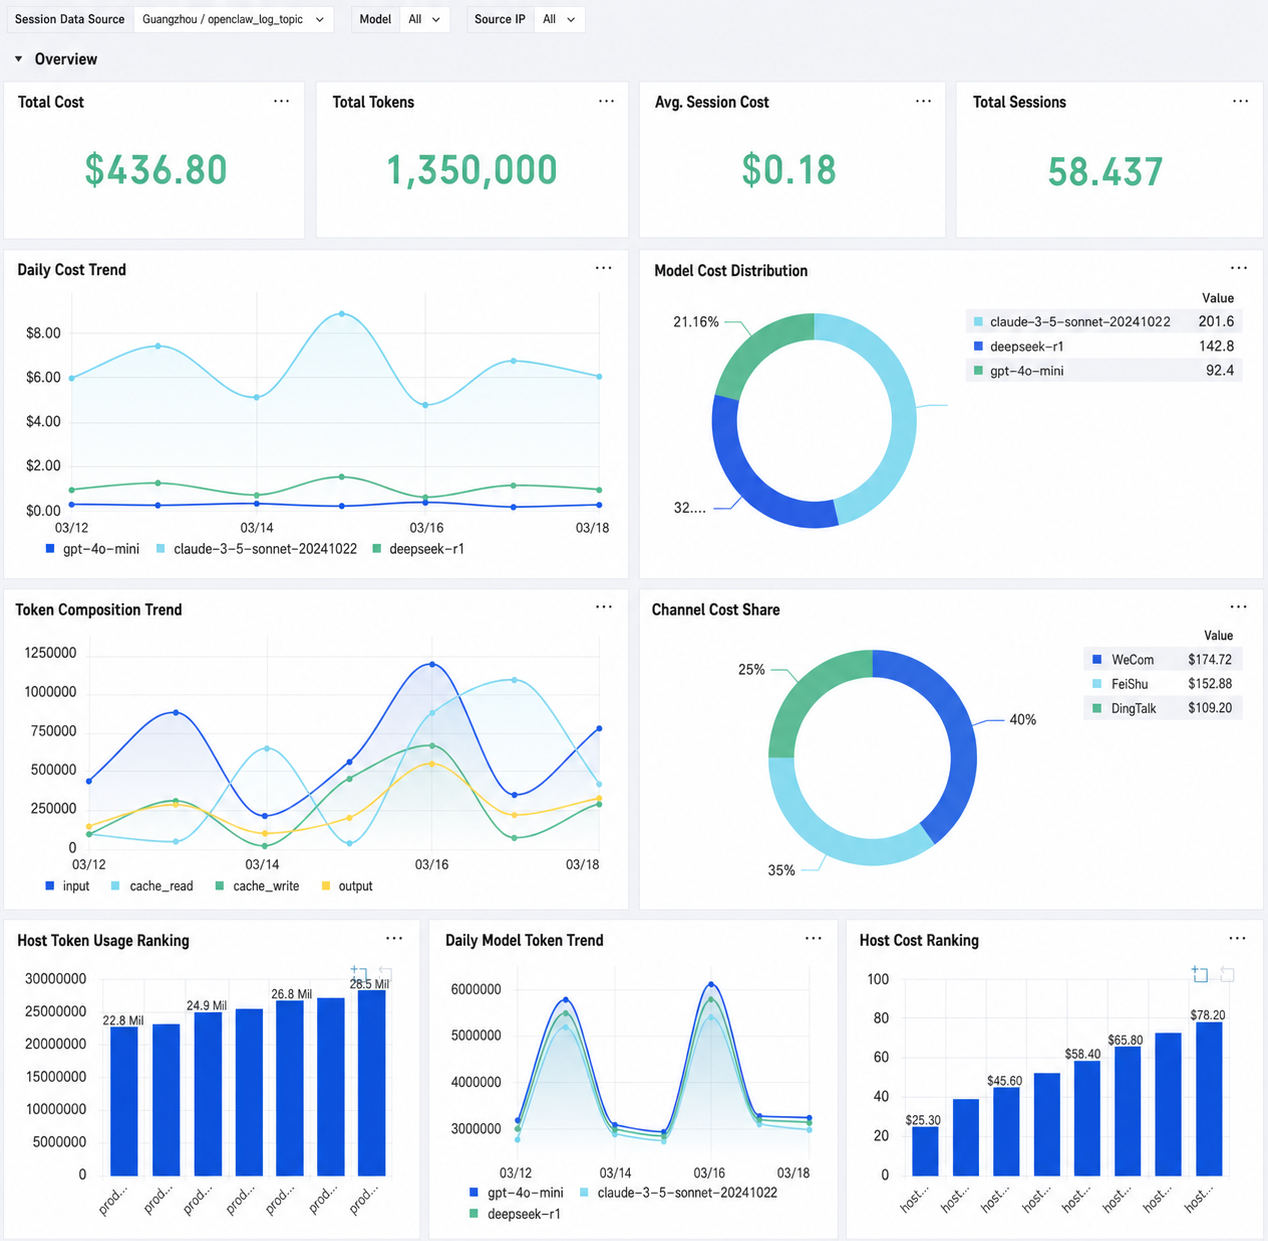
The Cost Governance Dashboard helps you gain a comprehensive understanding of OpenClaw's Token consumption and cost distribution. It supports drilling down from a global overview to specific session and message levels.
Function | Description |
Global Cost Overview | Displays core metrics such as total cost, Token volume, average session cost, and number of sessions. |
Multi-dimensional breakdown | Breaks down cost distribution by model dimension and server host. |
OpenClaw Operation Monitoring
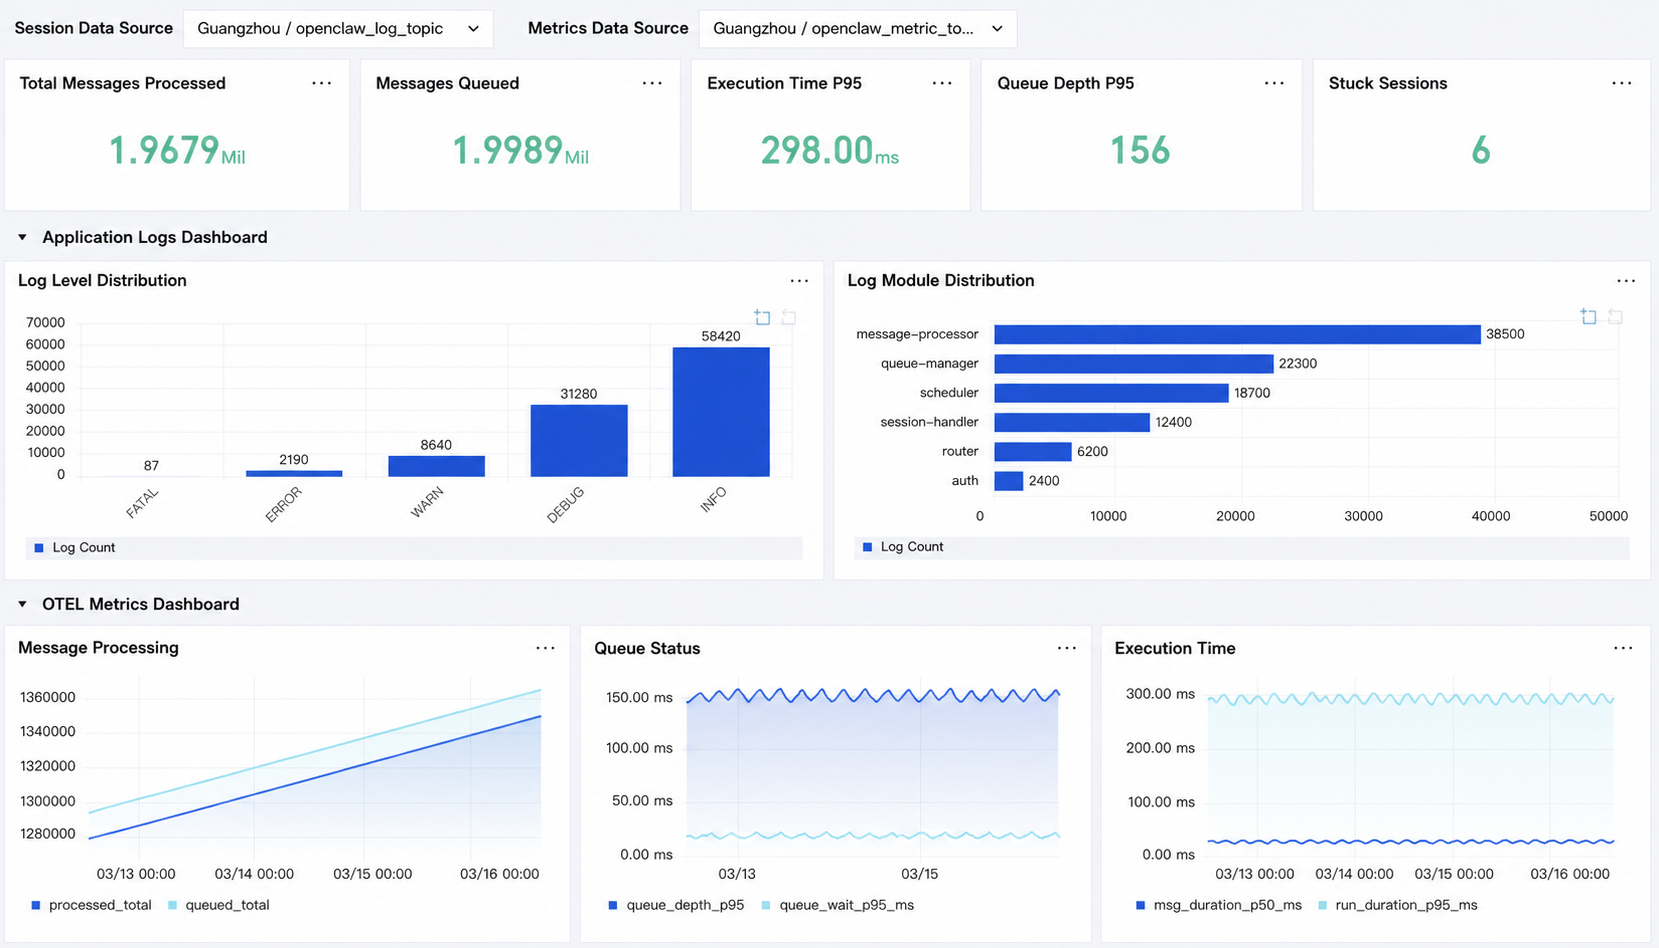
The Ops Observability Dashboard helps you monitor the operational status of your OpenClaw system in real time and quickly identify anomalies such as queue backlog, response degradation, and error spikes.
Function | Description |
Core KPI Monitoring | Total message processing volume, number of enqueued messages, P95 execution latency, P95 queue depth, and number of stuck sessions |
Application Log Dashboard | Distribution of ERROR/WARN/FATAL levels and Top subsystem error rankings. |
OTEL Metrics Dashboard | Message processing trend, queue status (depth + wait time), and execution latency time series chart. |
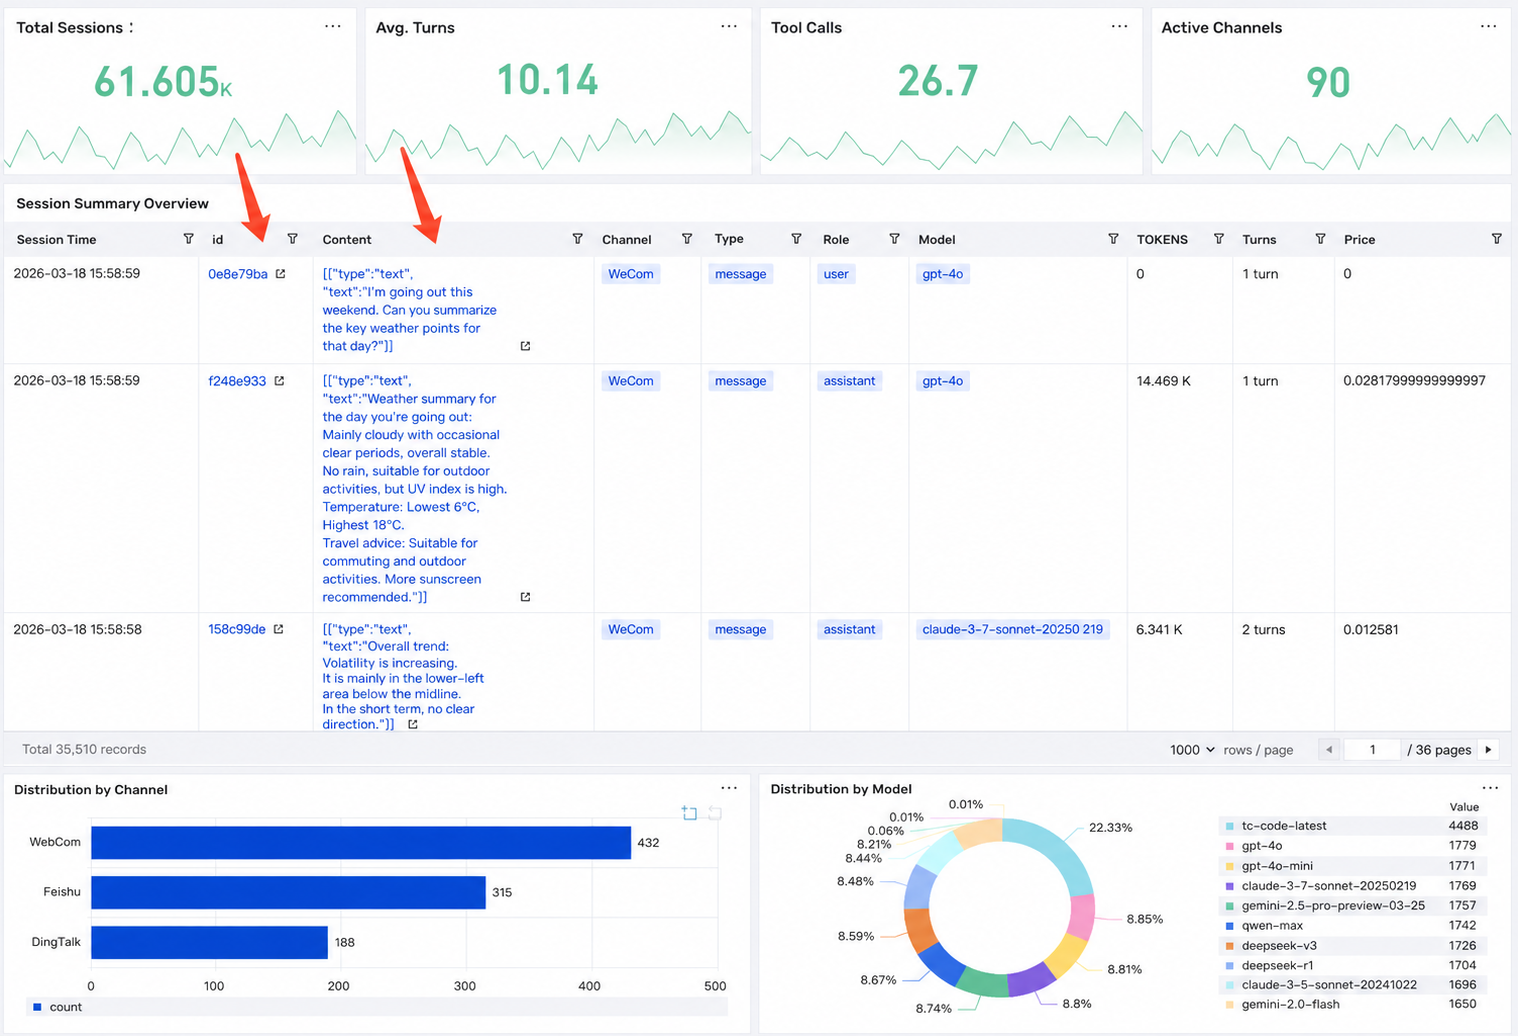
OpenClaw Session Management
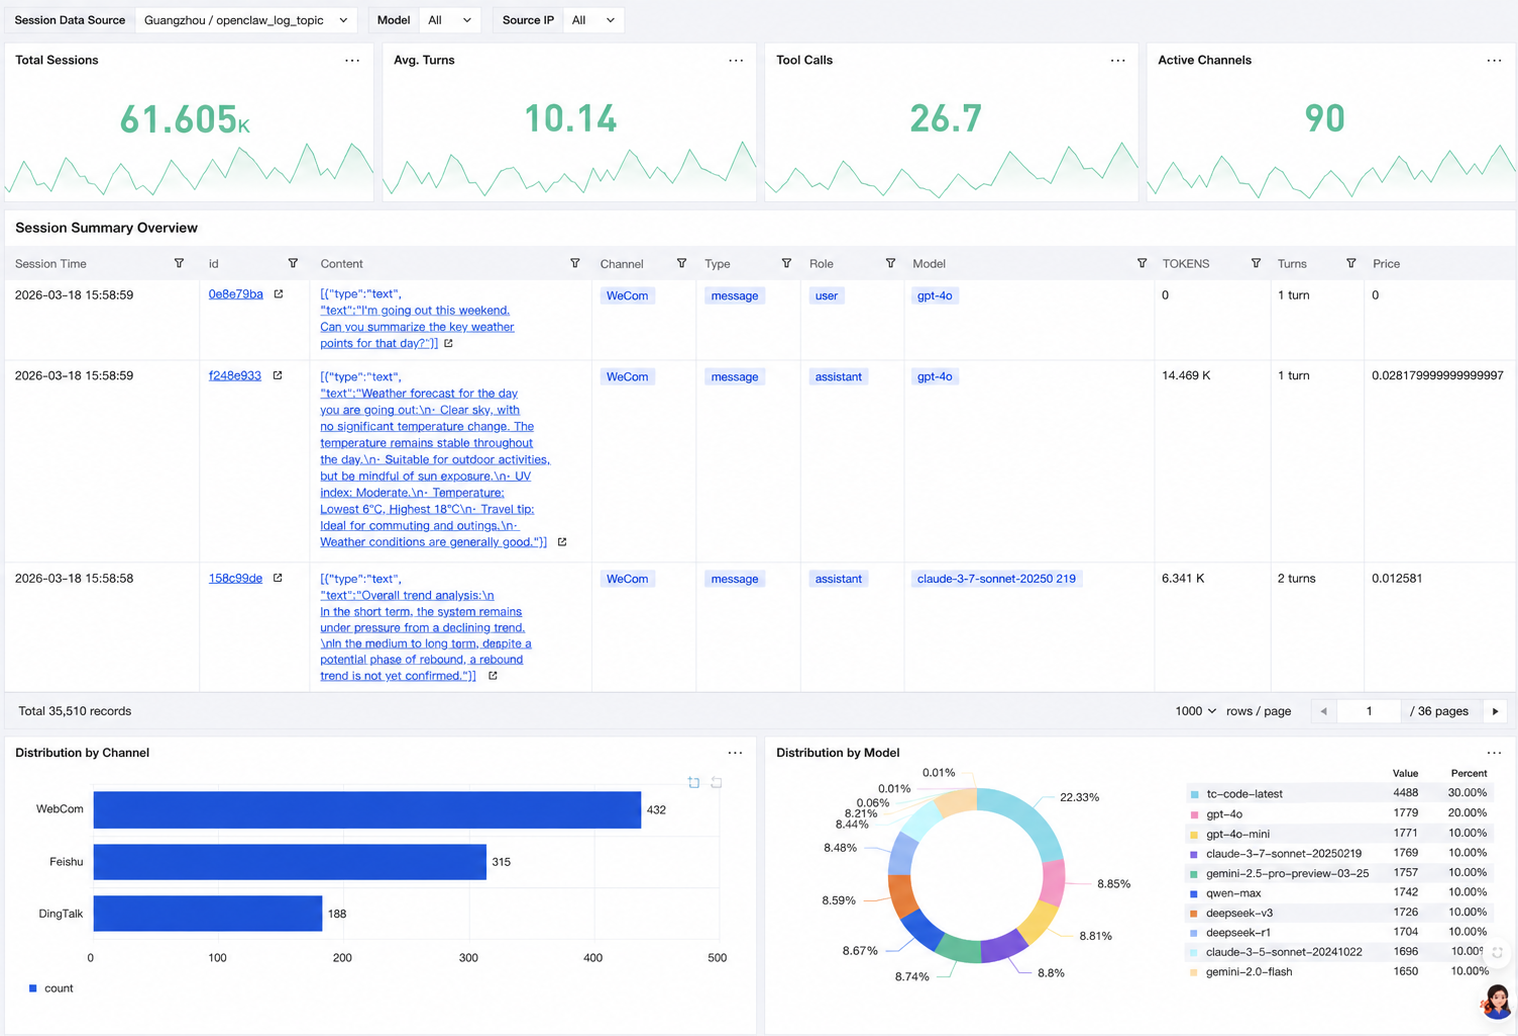
The Session Management Dashboard helps you quickly search and restore OpenClaw's global session monitoring, providing overall control over session status and usage.
Function | Description |
Activity Overview | Number of sessions, average turns, number of tool invocations, and channel distribution, for understanding overall usage activity |
Session Summary Overview | Select any session to view the complete multi-turn interaction record, with each turn displaying user input, Agent response, Token, and cost. |
Channel and Model Distribution | Session share across QQ / WeCom / Lark / DingTalk channels, and usage distribution of each model. |
OpenClaw Session Details
The Session Details Dashboard helps you search and restore the full-link interaction of a single session. It is used for drilling down into the complete interaction process of a single session.
Function | Description |
Session Basic Information | Displays core data such as session ID, channel, model, creation time, and status, and aggregates the total Token consumption and total cost of the session. |
Multi-turn Interaction Details | Restores dialogue flow by turn, and shows user input, Agent response, tool invocation records, per-turn Token consumption, and per-turn price for each turn. |
Interaction Chain Traceback | Fully reproduces dialogue logic, supports viewing context turn by turn, and is used for troubleshooting, Prompt optimization, and requirement analysis. |
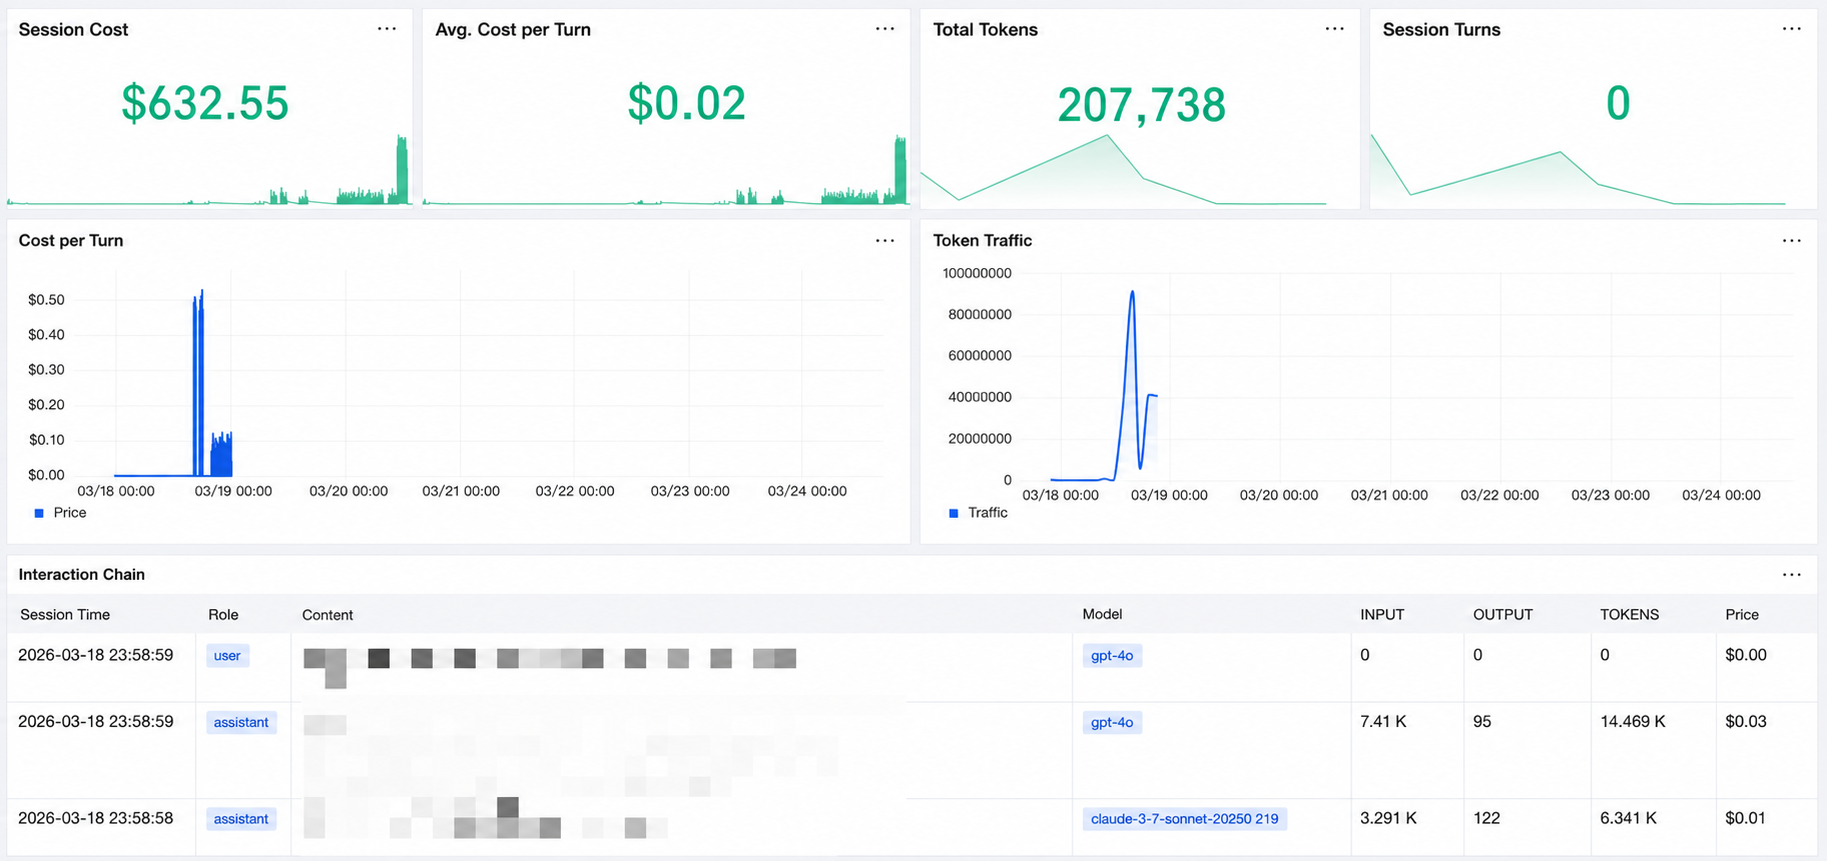
You can go to the session details using either of the following two methods:
In the Session Management Dashboard > Session Summary table, click a session id or session content. This will navigate you to the Session Details Dashboard for the corresponding session.
Directly click the OpenClaw Session Details dashboard. Select the server (instance) and the Session ID to view the session details for a single session.
OpenClaw Security Audit
The Security Audit Dashboard enables you to perform multi-dimensional statistics and detailed tracing of high-risk sessions, high-risk command executions, and sensitive file access activities. This facilitates end-to-end security monitoring and auditing.
Function | Description |
High-risk session statistics | Counts command, web request, and other behavioral data of sessions by time dimension to identify high-risk sessions. |
Sessions with high-risk command execution | Records session details of high-risk command execution, including model information, stop reason, and cache and billing data, facilitating the tracing of non-compliant behaviors. |
Sessions with sensitive file access | Tracks session logs of sensitive file access, displays session content, model, and usage data, and implements CloudAudit for sensitive operations. |
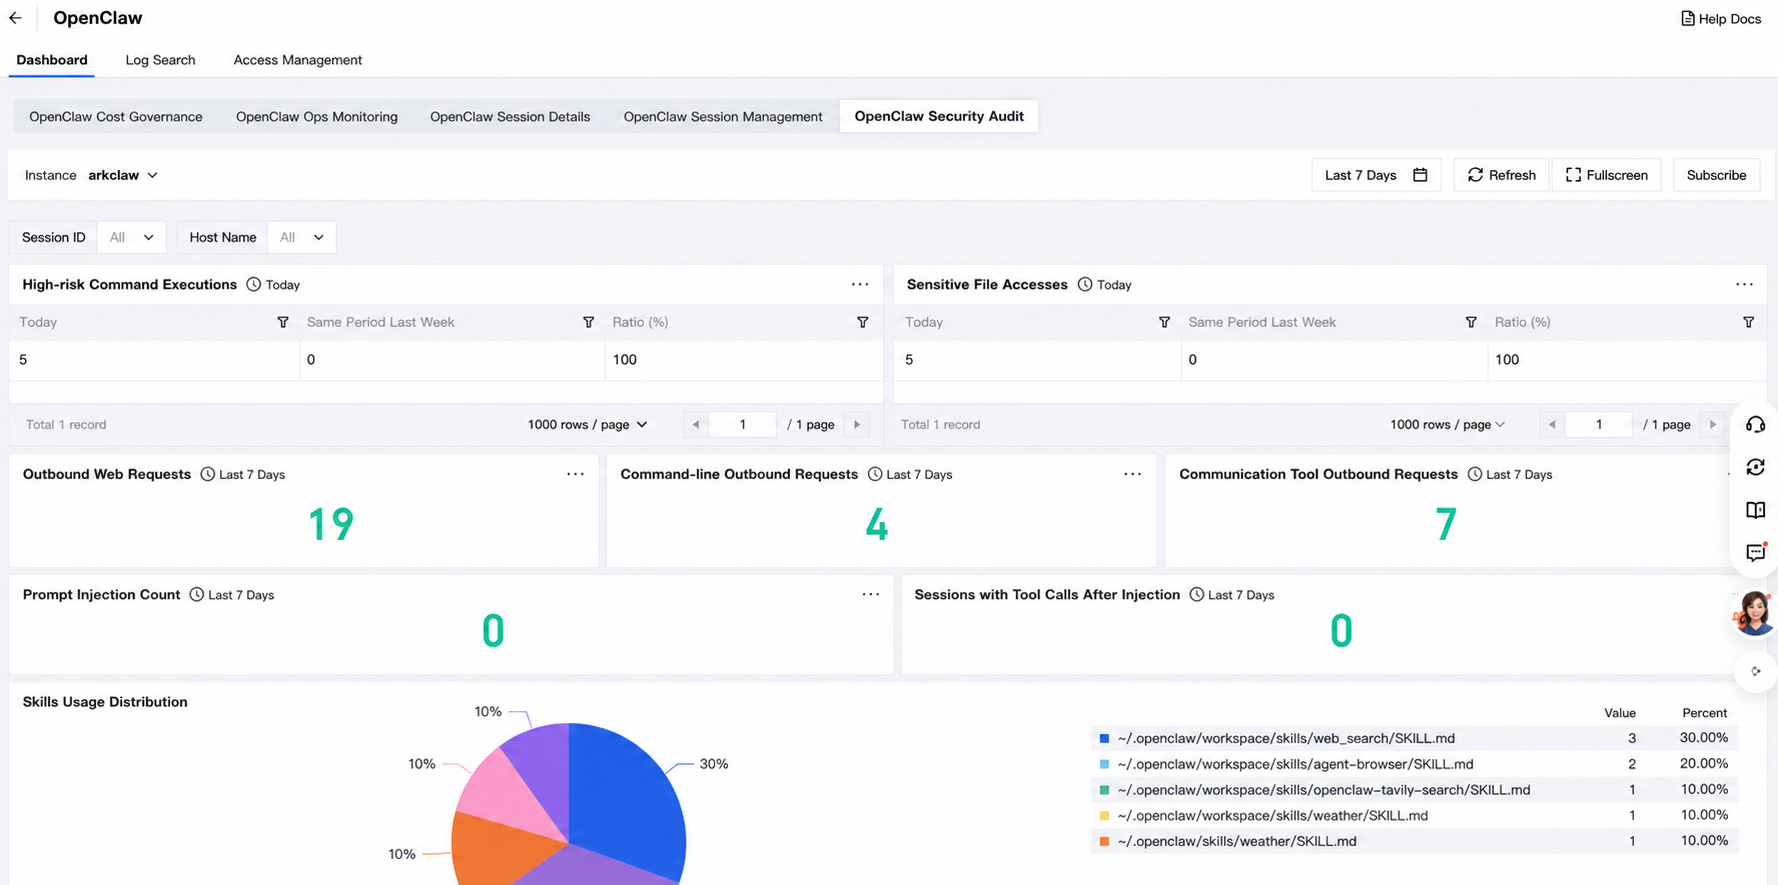
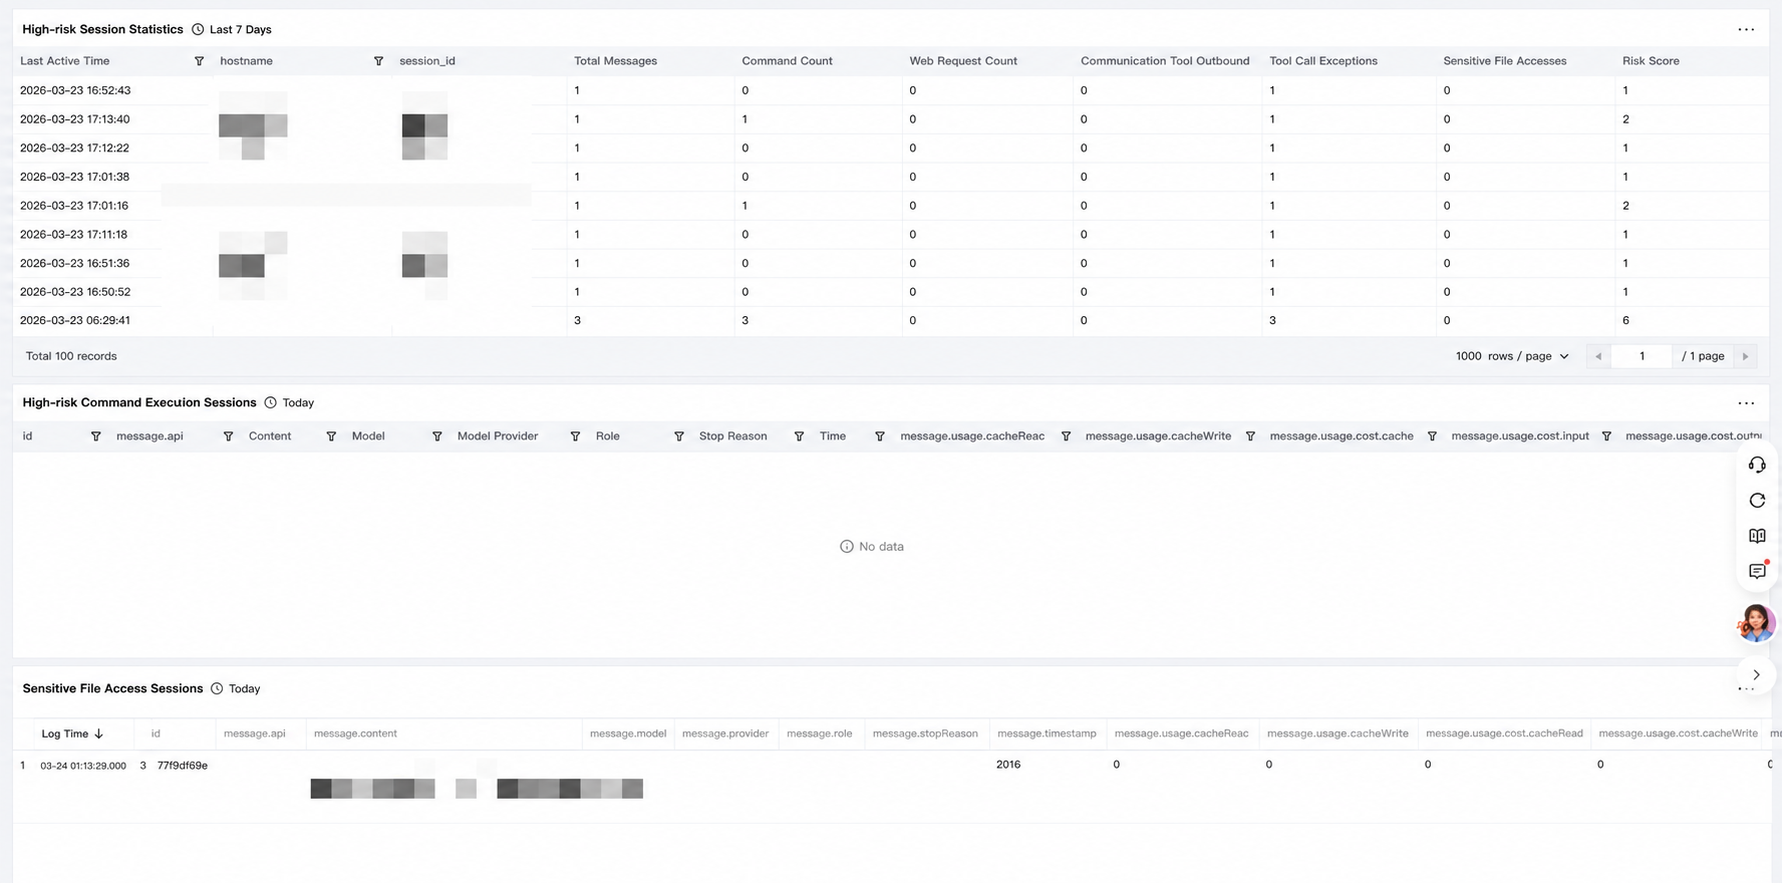
Search logs
In addition to dashboards, you can also directly search raw logs.
On the CLS Console > Application Center > OpenClaw > Log Search page, you can choose a specific server (instance). By adding search conditions or using AI to intelligently compose statements, you can query and display raw logs and statistical charts. This enables efficient log search and visual analysis.
Ajuda e Suporte
Esta página foi útil?
Você também pode entrar em contato com a Equipe de vendas ou Enviar um tíquete em caso de ajuda.
comentários