After creating the scenario and before the formal stress test, you can use the debug mode to quickly verify your scenario, troubleshoot and fix errors, so as to ensure that your scenario meets expectations during the formal stress test.
2. In the left sidebar, click PTS > Test Scenario.
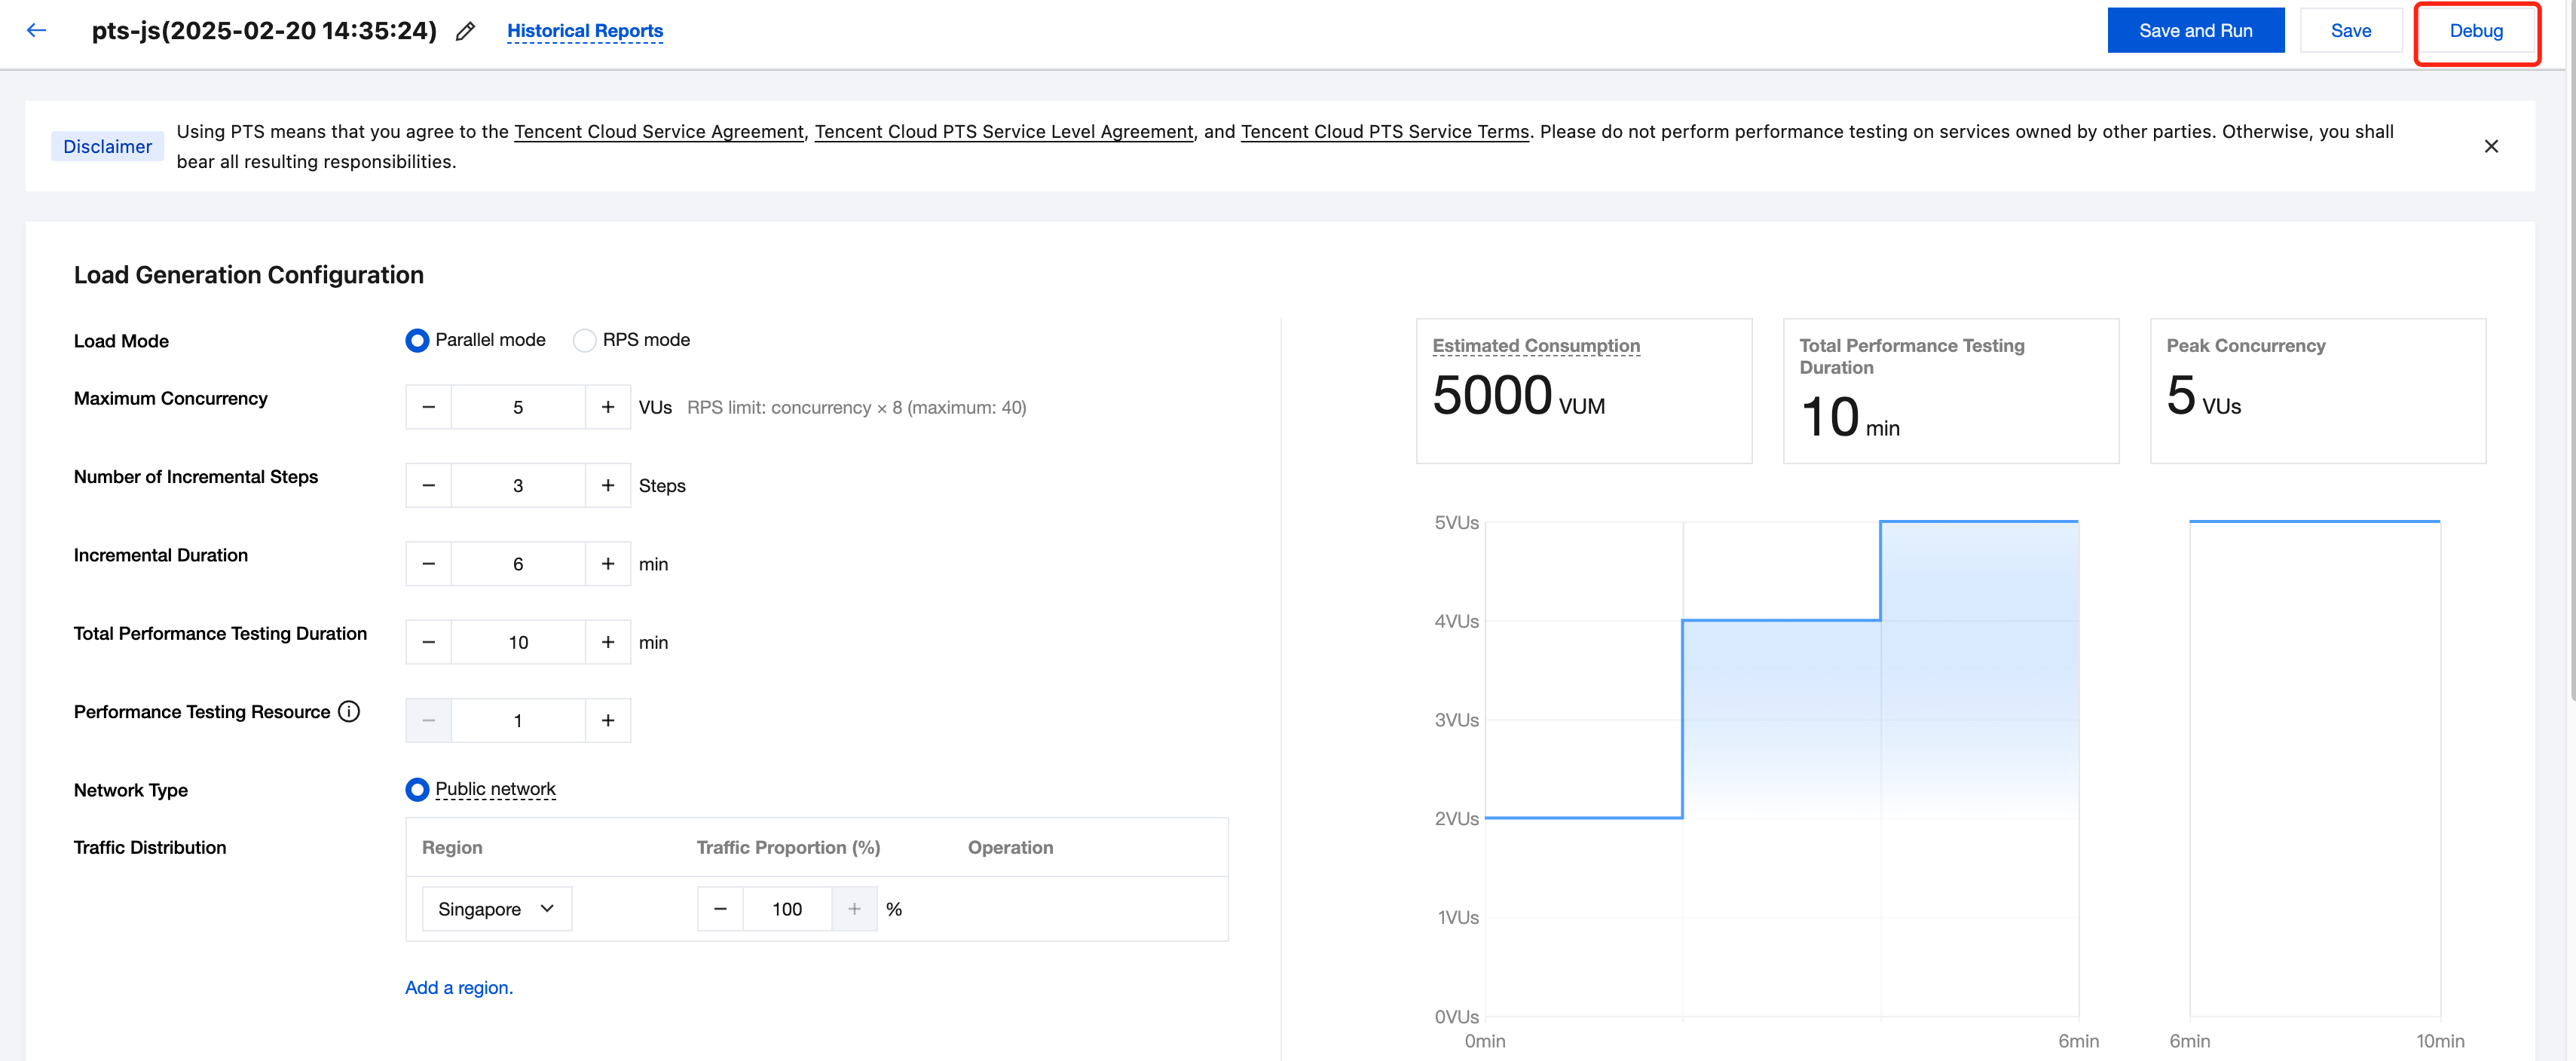
3. Click Create New Scenario, select the testing scenario mode, fill in the basic information on the new testing scenario page, and then click Debug to enter debug mode.
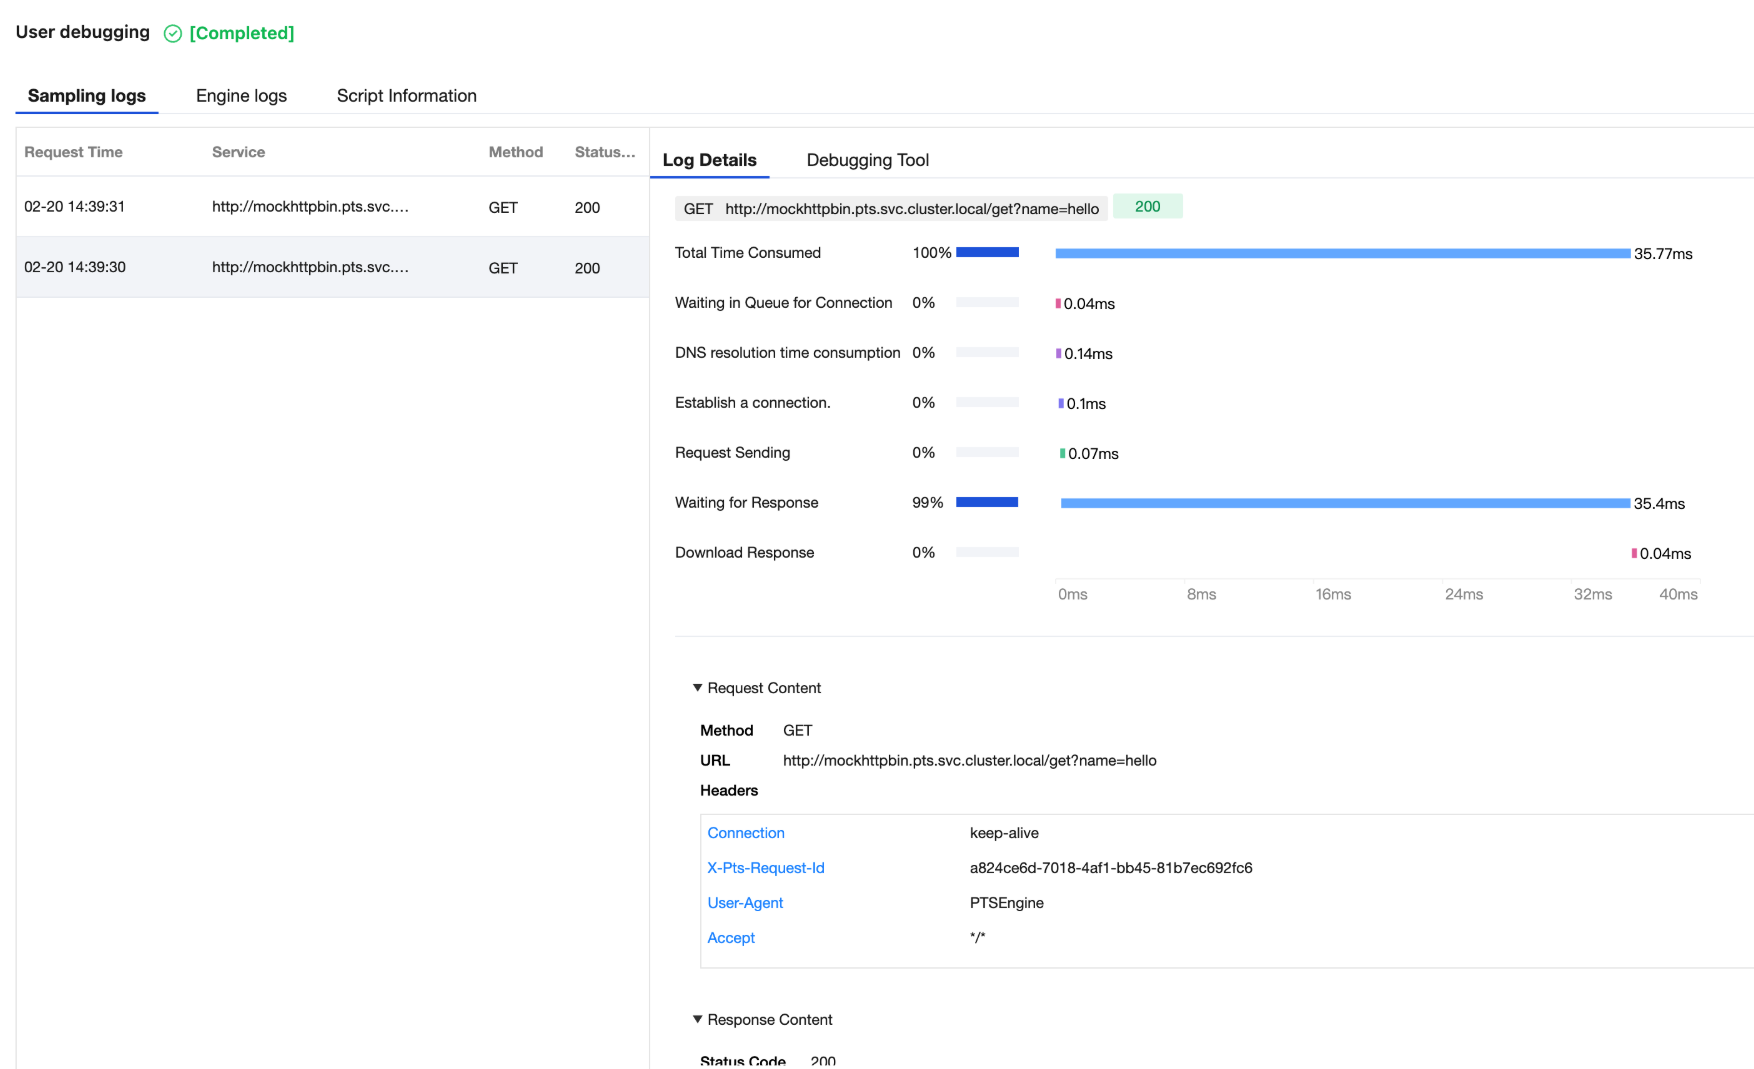
4. On the popped-up web debugging page, you can view all the sampling logs, engine logs, and script information of requests, and use the debugging tool to debug and analyze your request data.
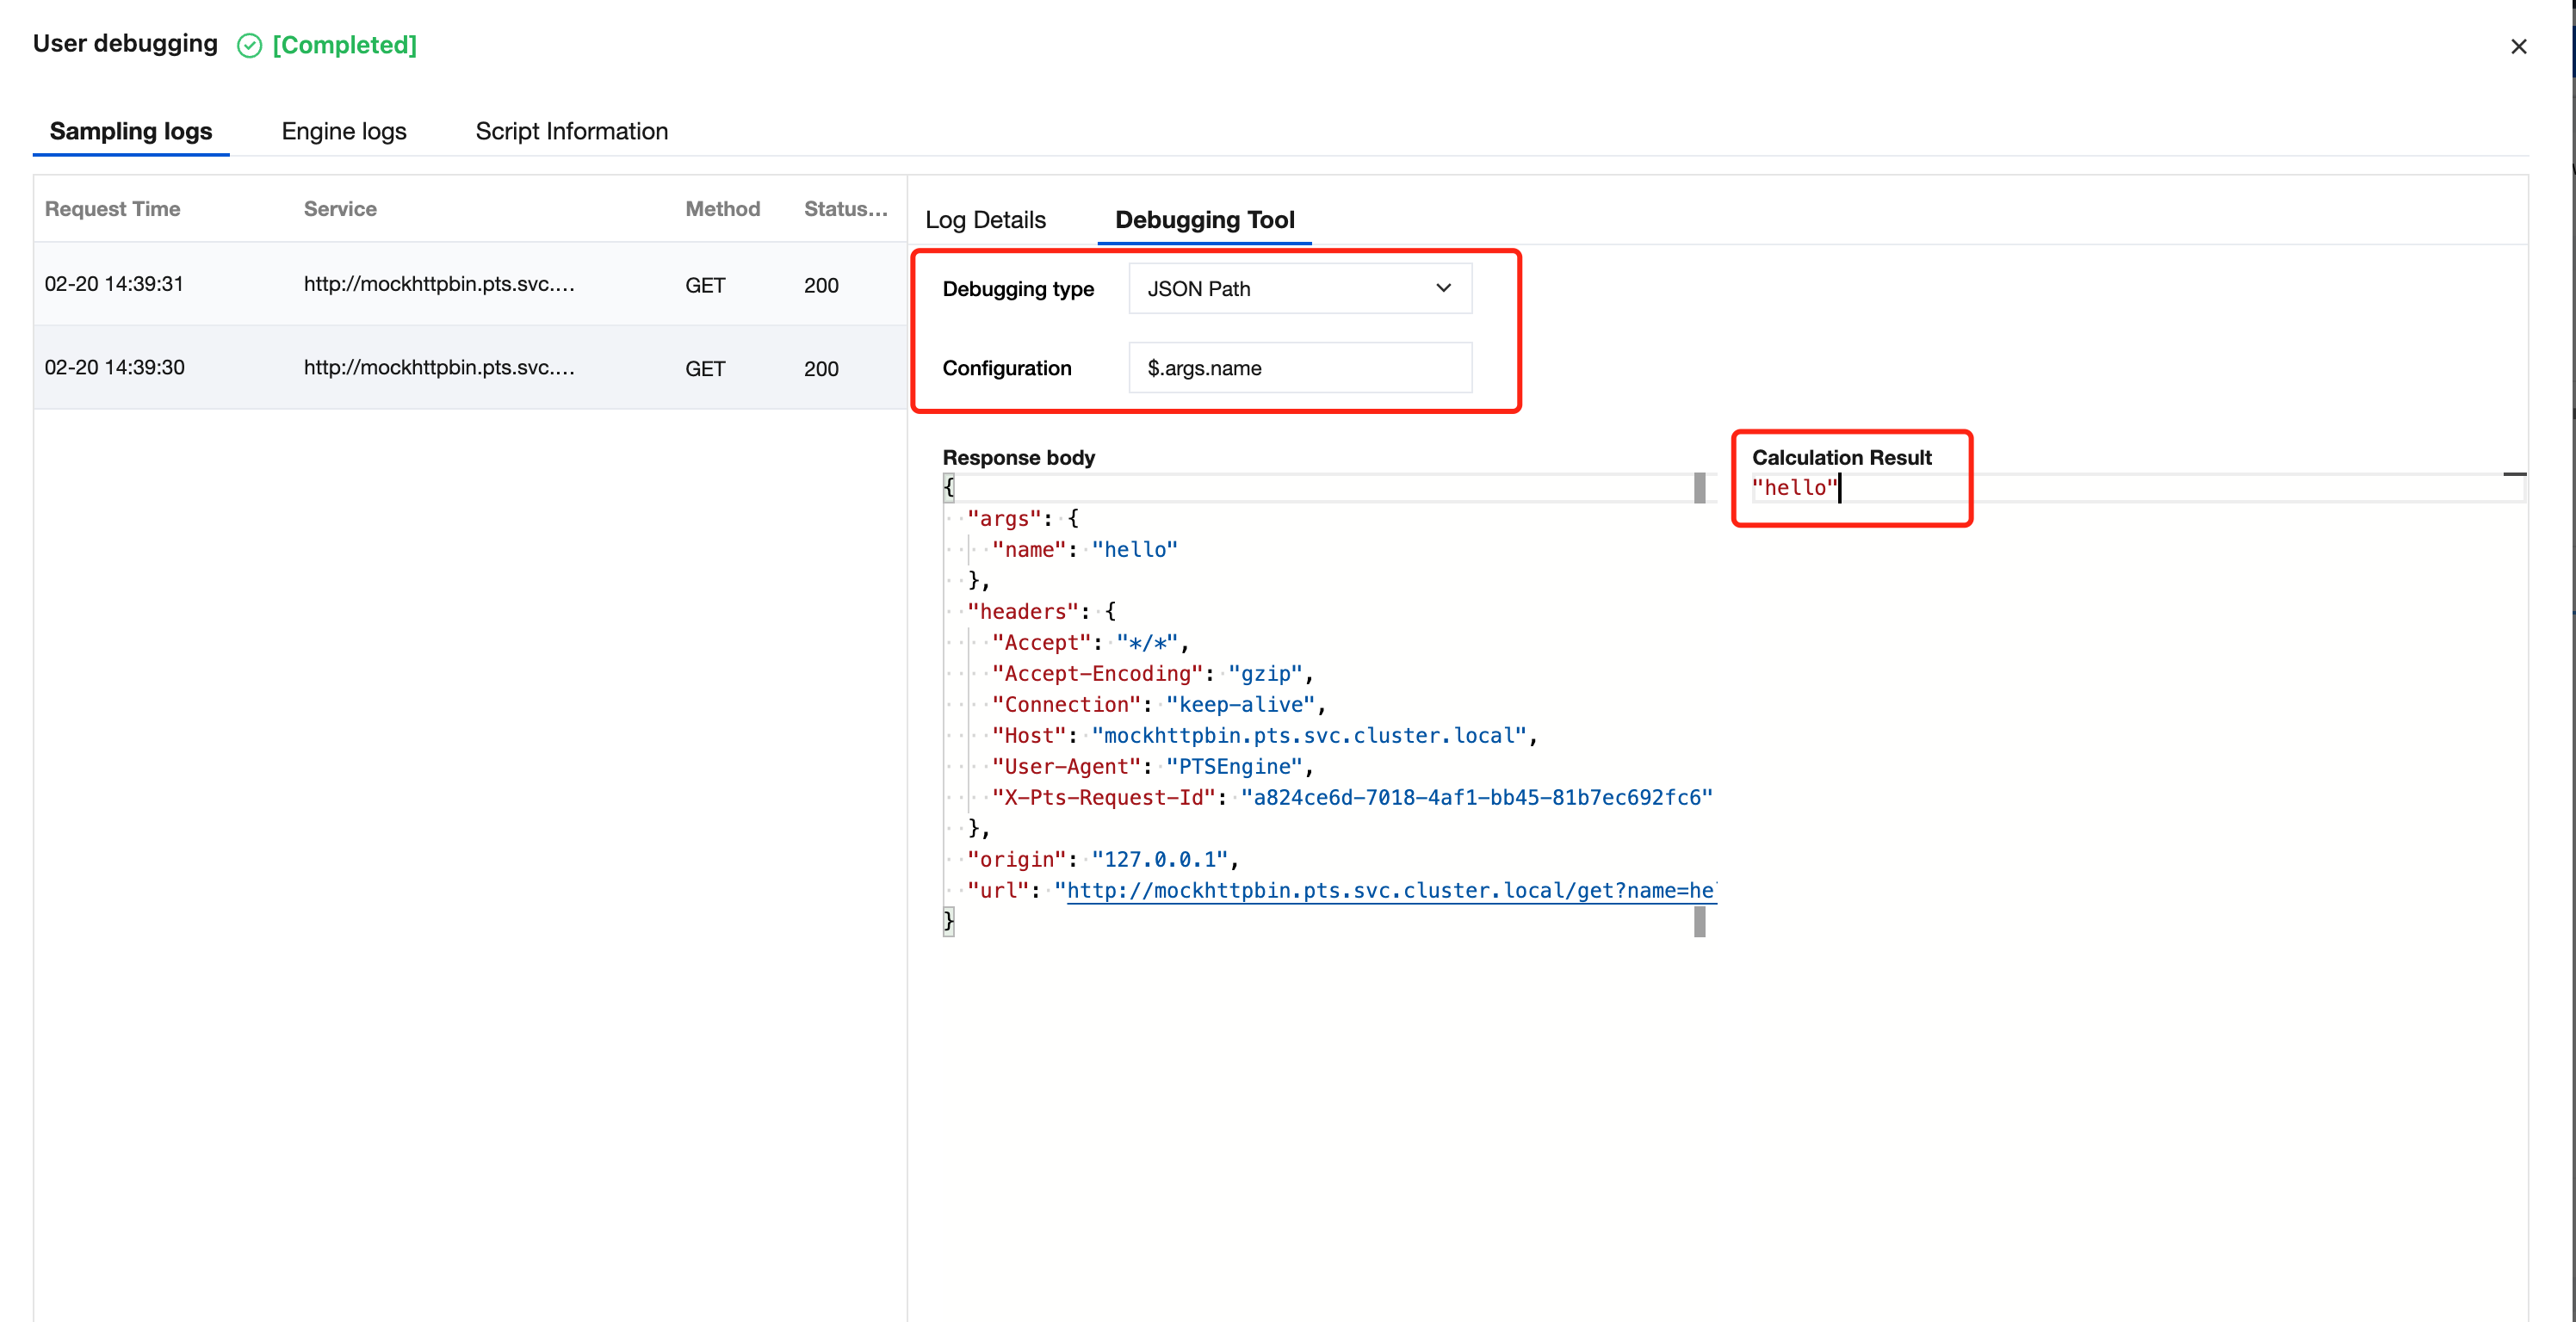
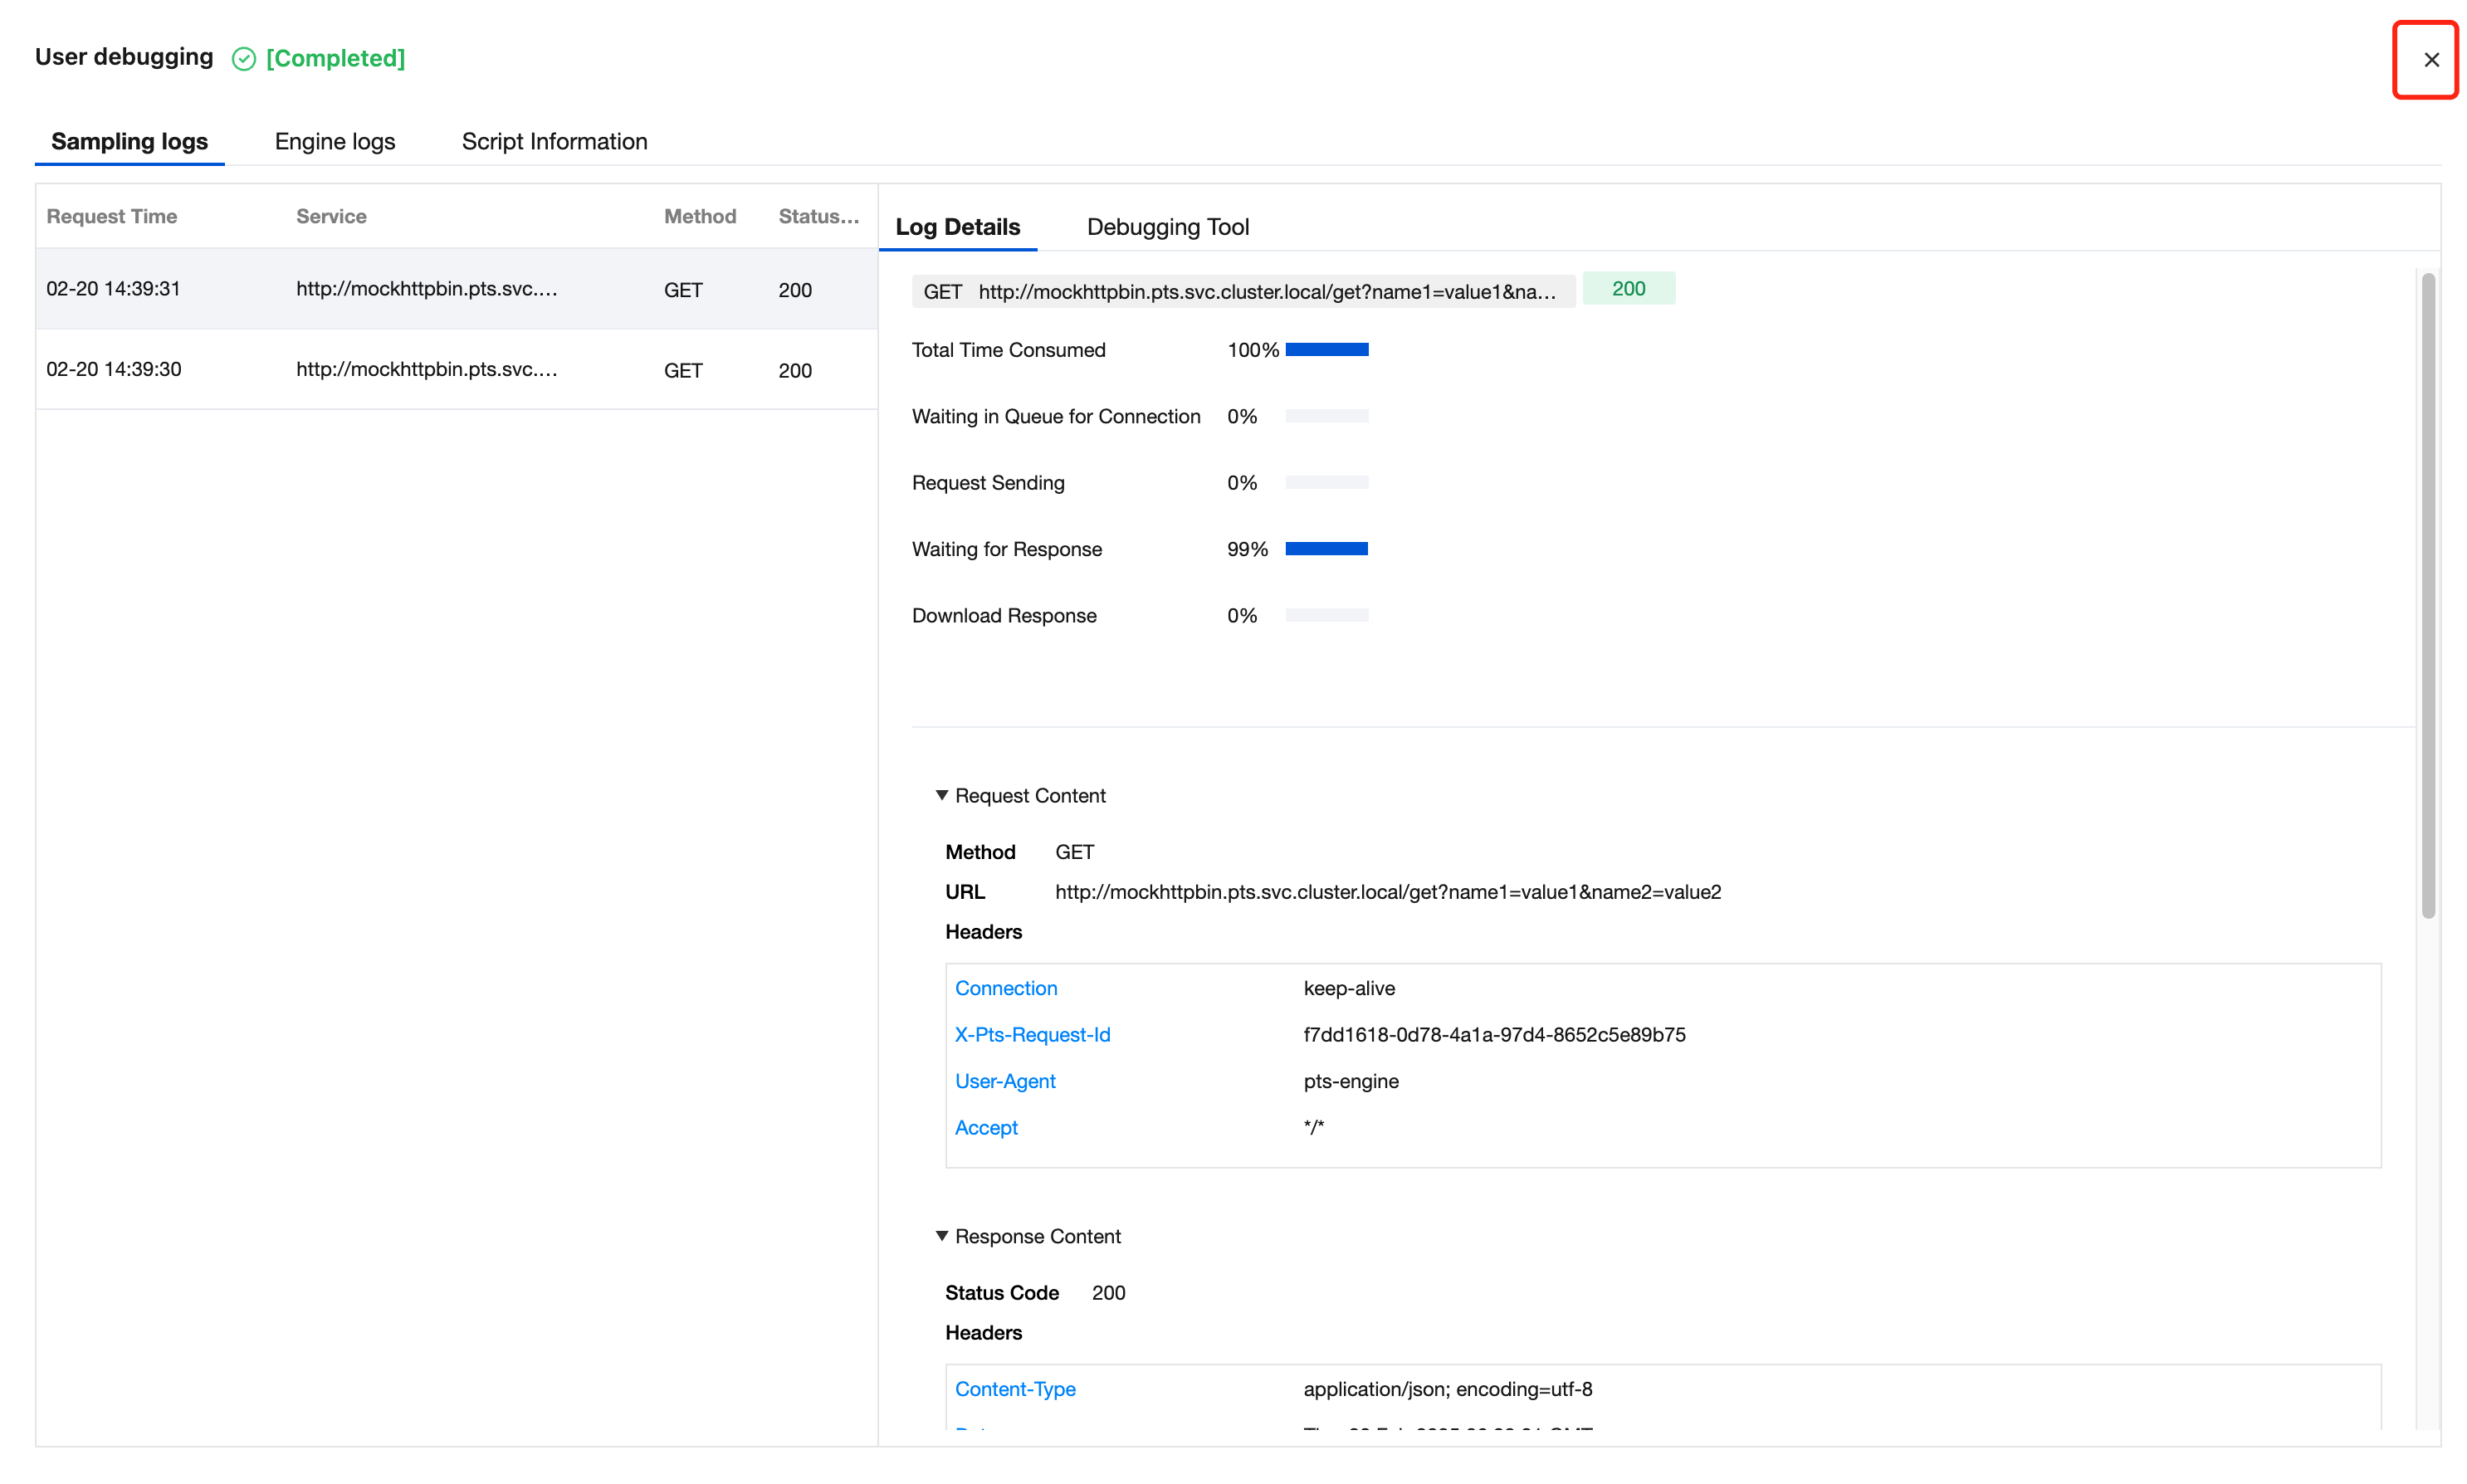
On the sampling log page, you can click on the request list on the left to view specific information and the time-consuming waterfall of a certain request and its response; you can also click on the debugging tool tab, enter a JSON Path expression or regular expression, and extract the required data from the response results.
An example of extracting data using JSON Path is as follows:
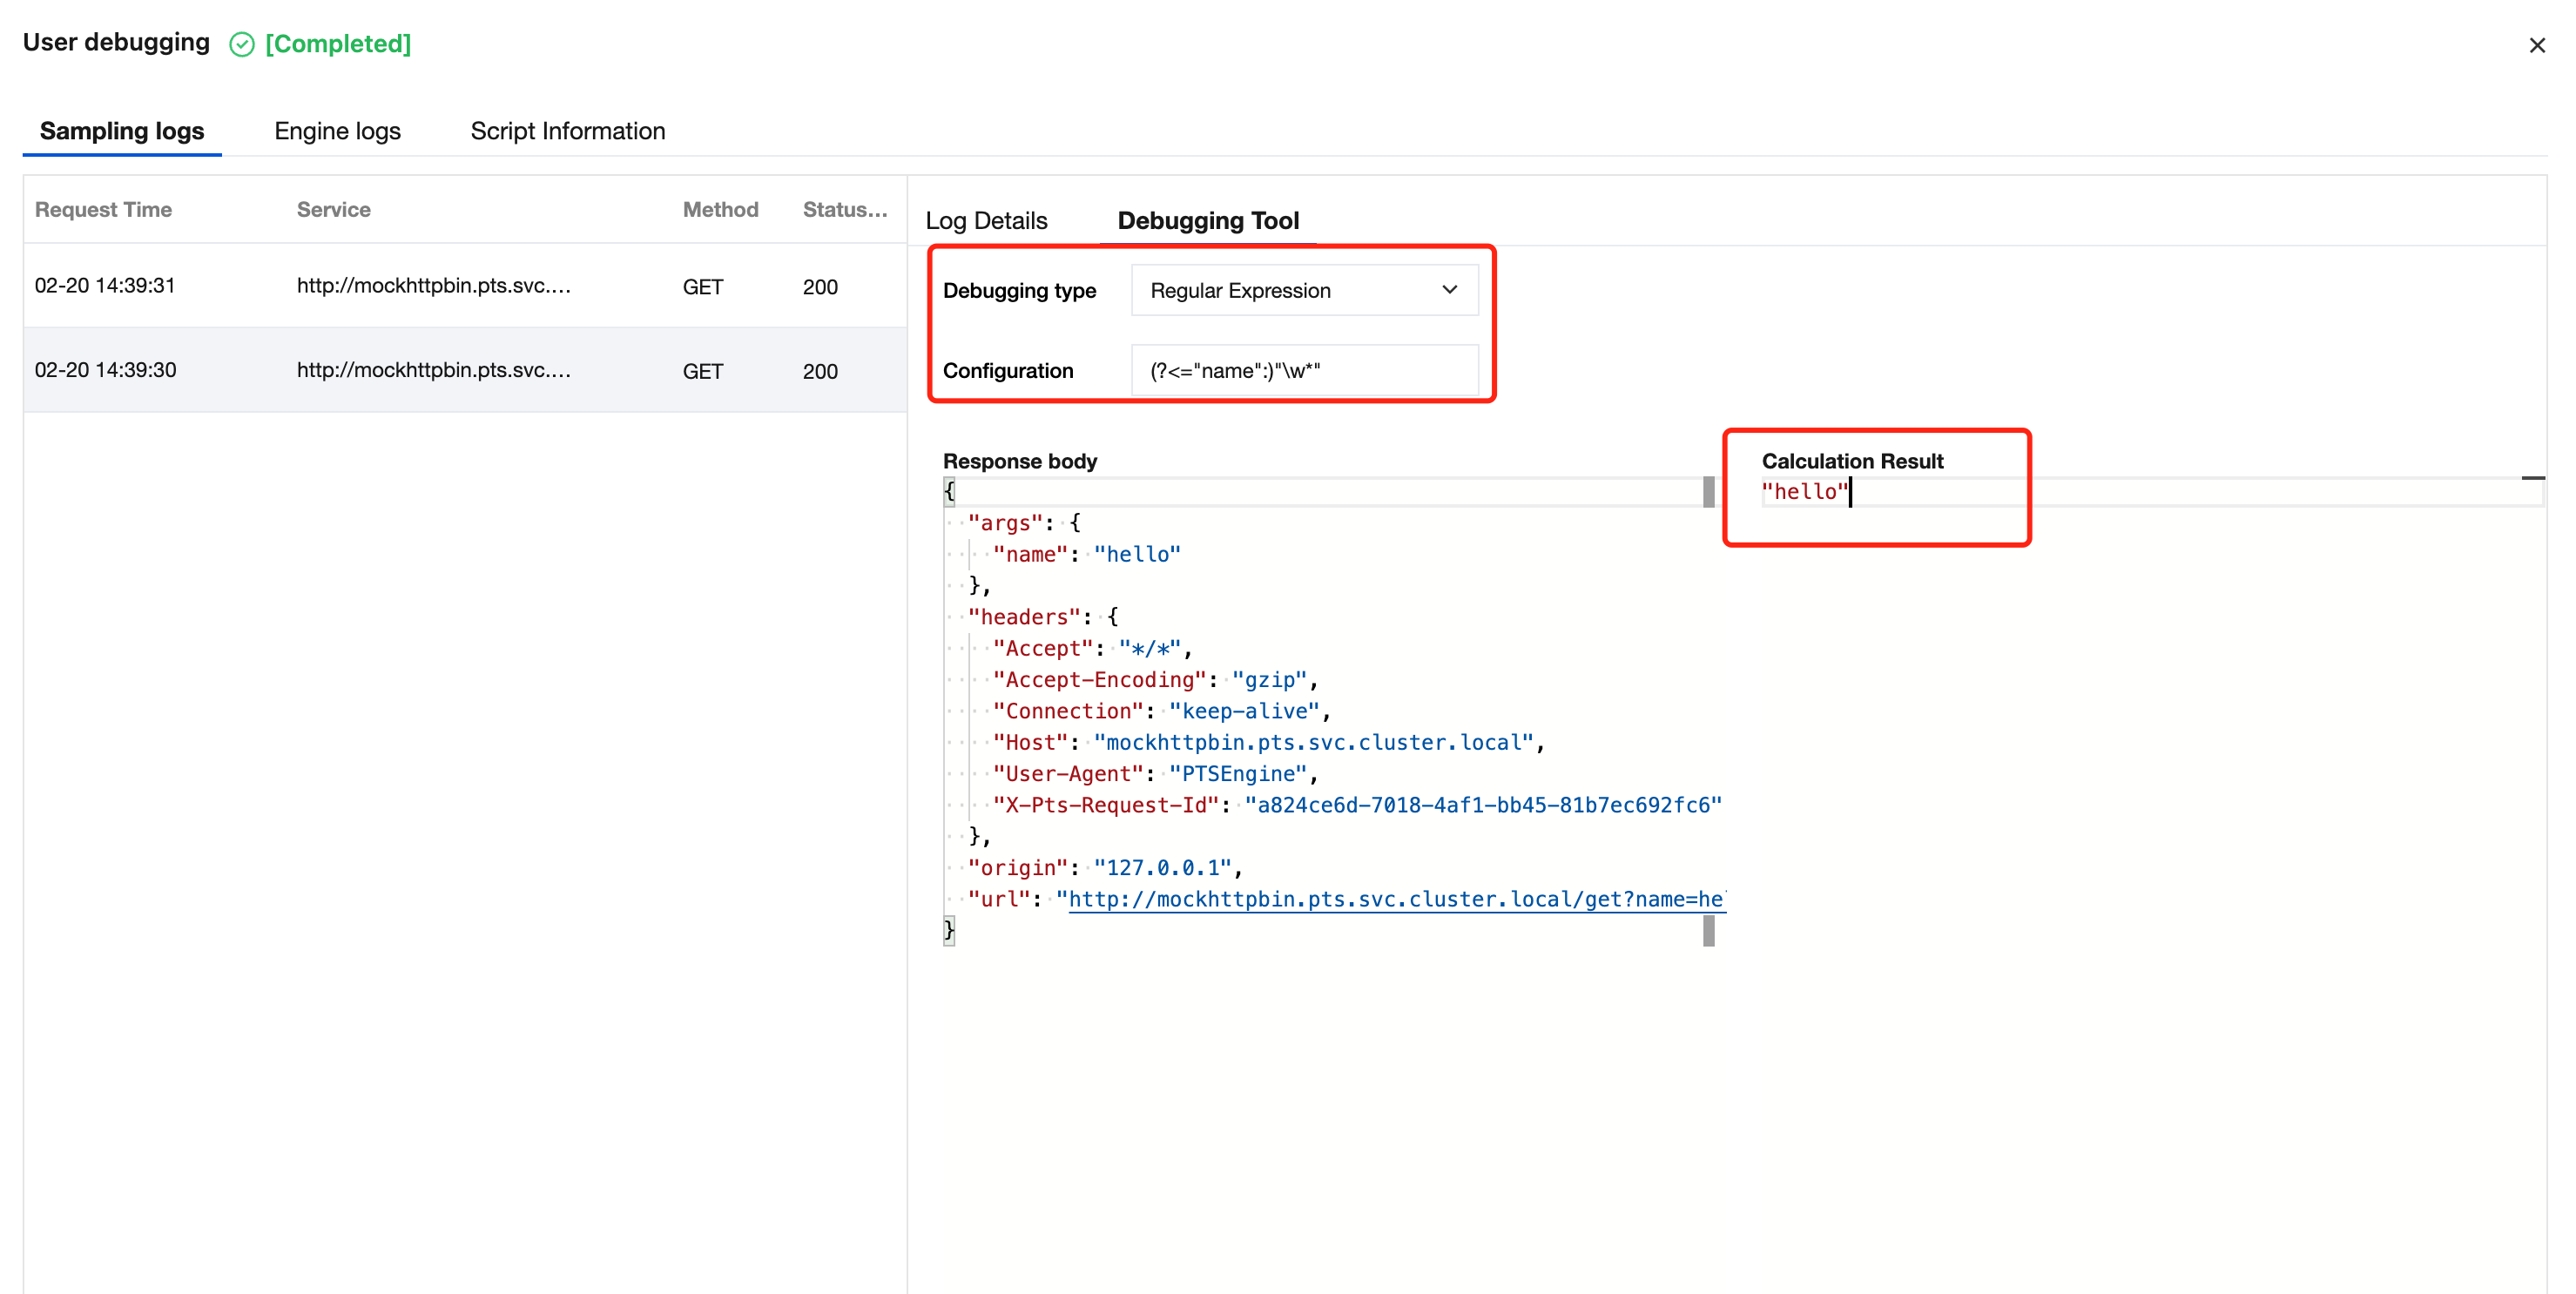
An example of extracting data using regular expressions is as follows:
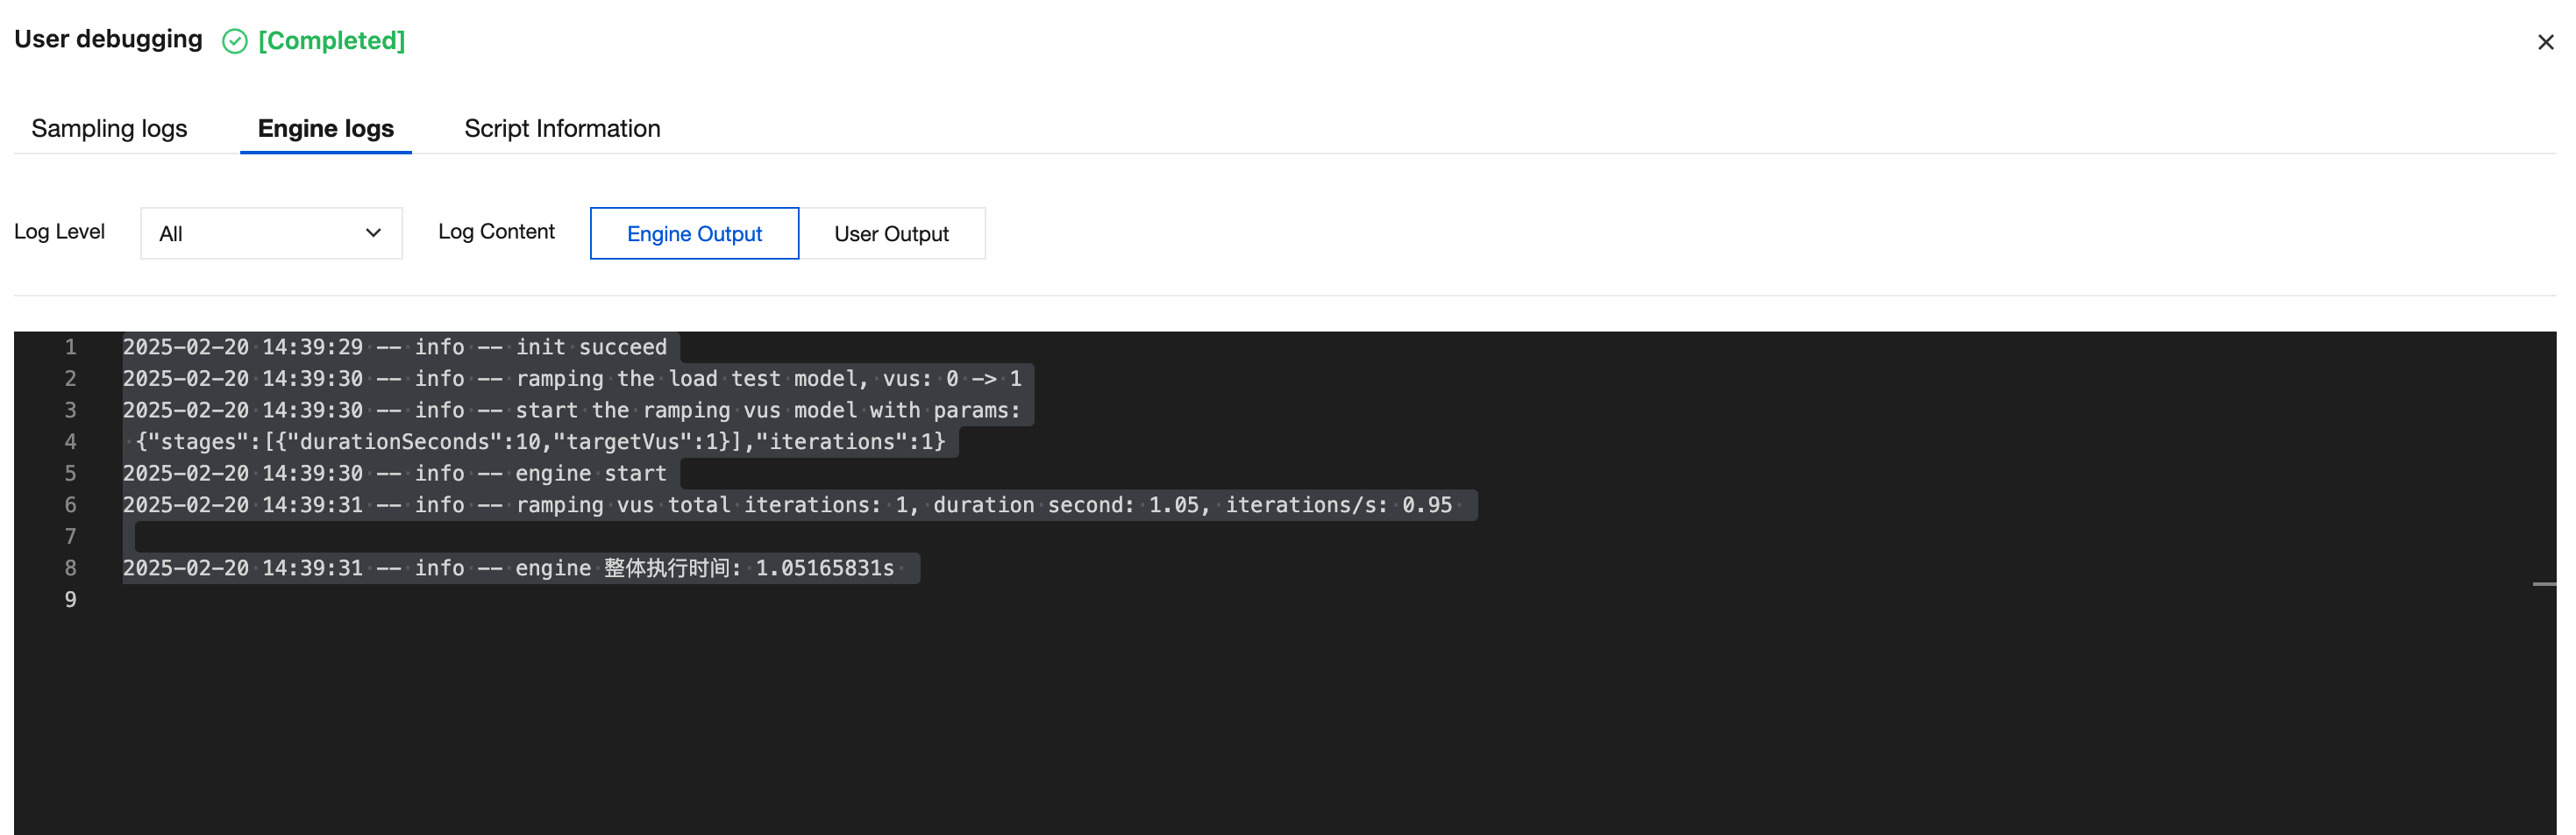
On the engine log page, you can select the log level and log source to view the logs output by the engine:
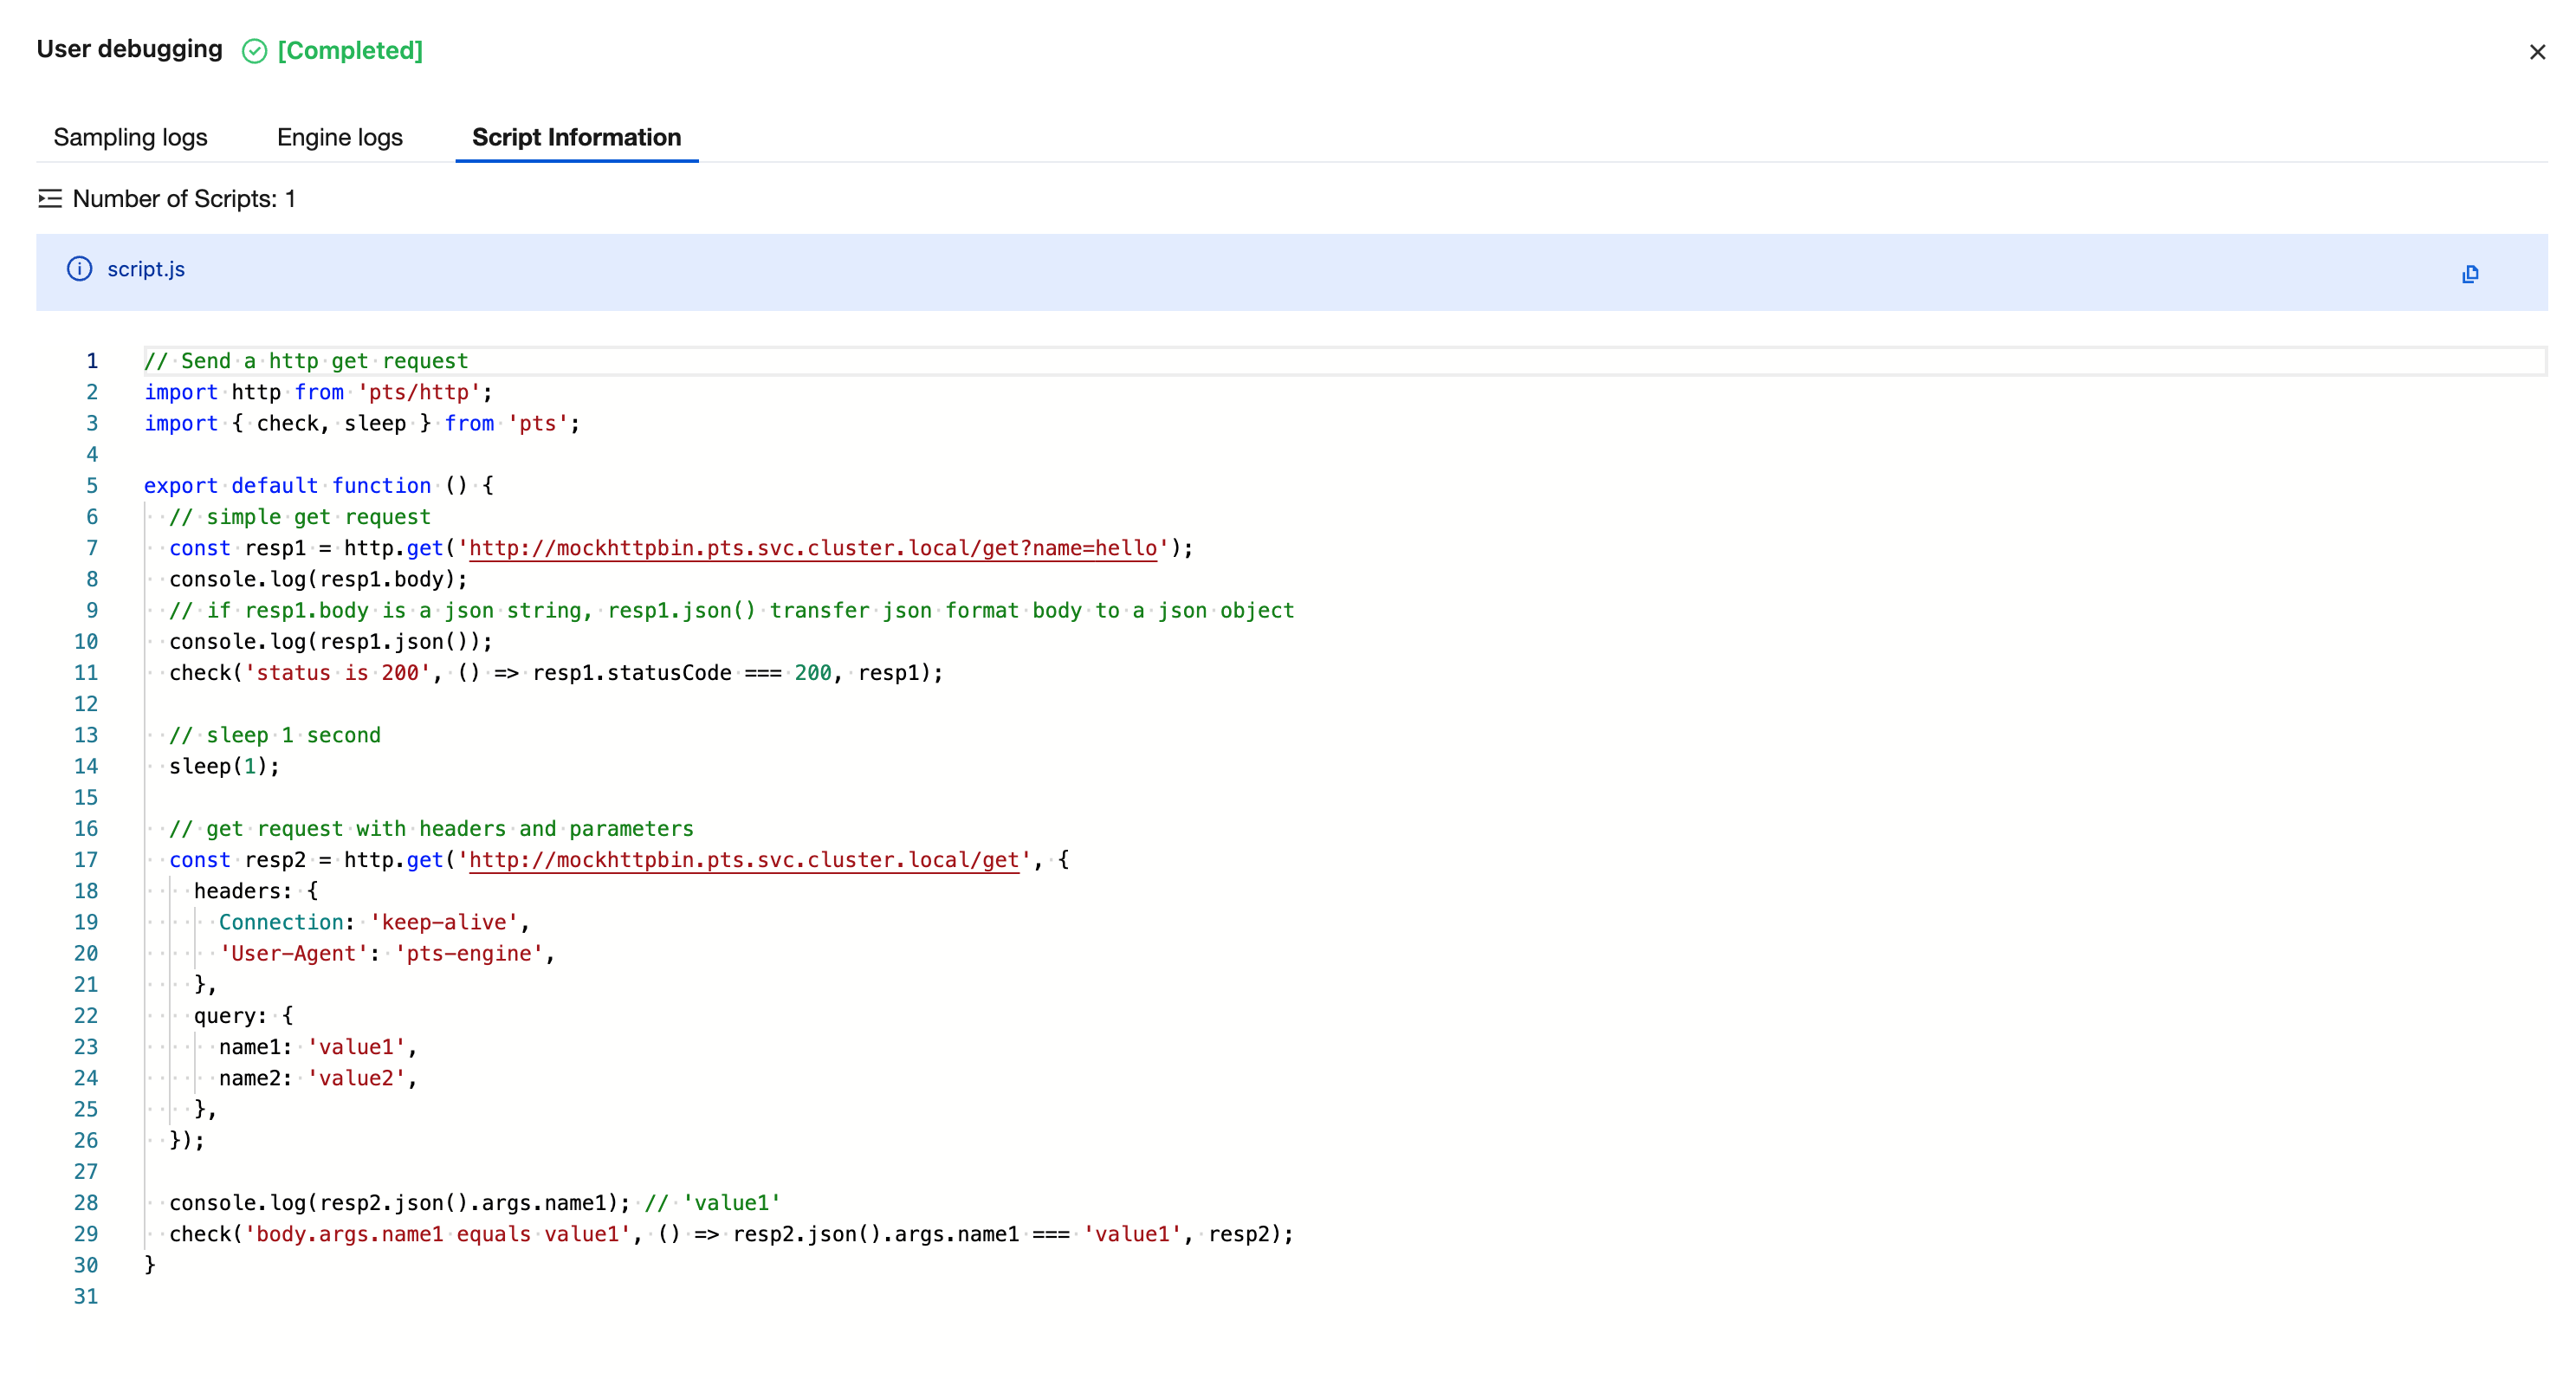
On the script information page, you can browse the snapshot of the scenario script used at the time of this stress test:
5. To exit debug mode, click the "Off" icon in the upper right corner to return to the scenario page.