2. In the left navigation bar, select Mobile App Performance Monitoring > Crash. Select the business system, app, and time range to analyze crashes.
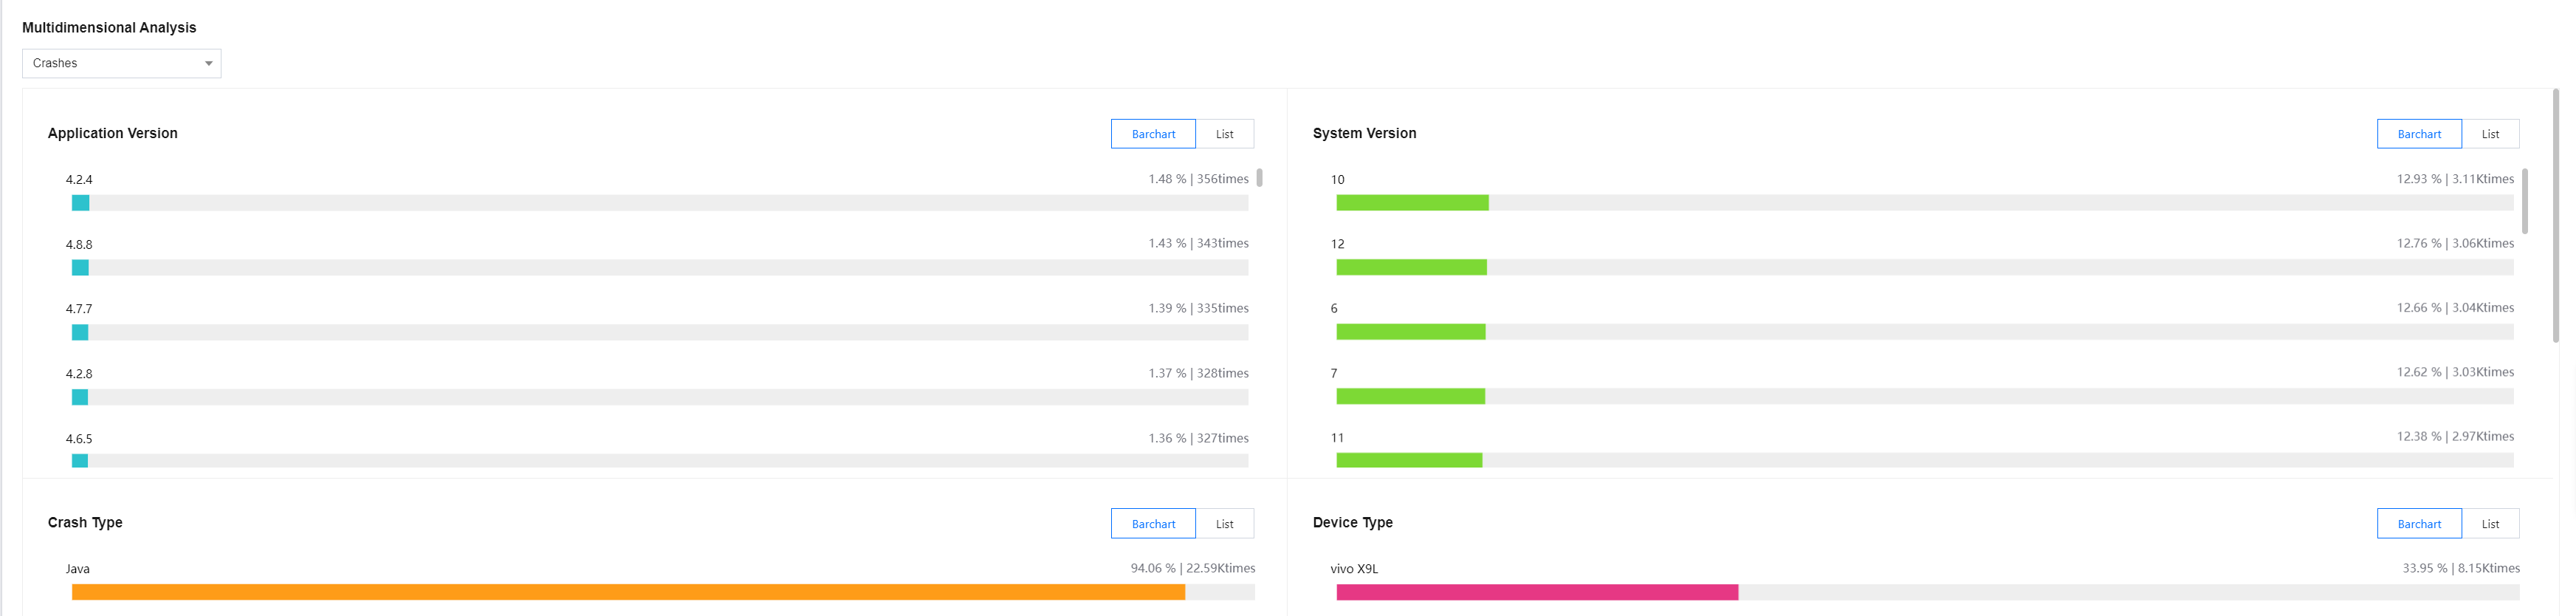
Multidimensional Analysis
The Multidimensional Analysis page shows the analysis of key metrics from multiple dimensions such as app version, system version, crash type, device type, and app status. It facilitates targeted root cause analysis of specific crash events.
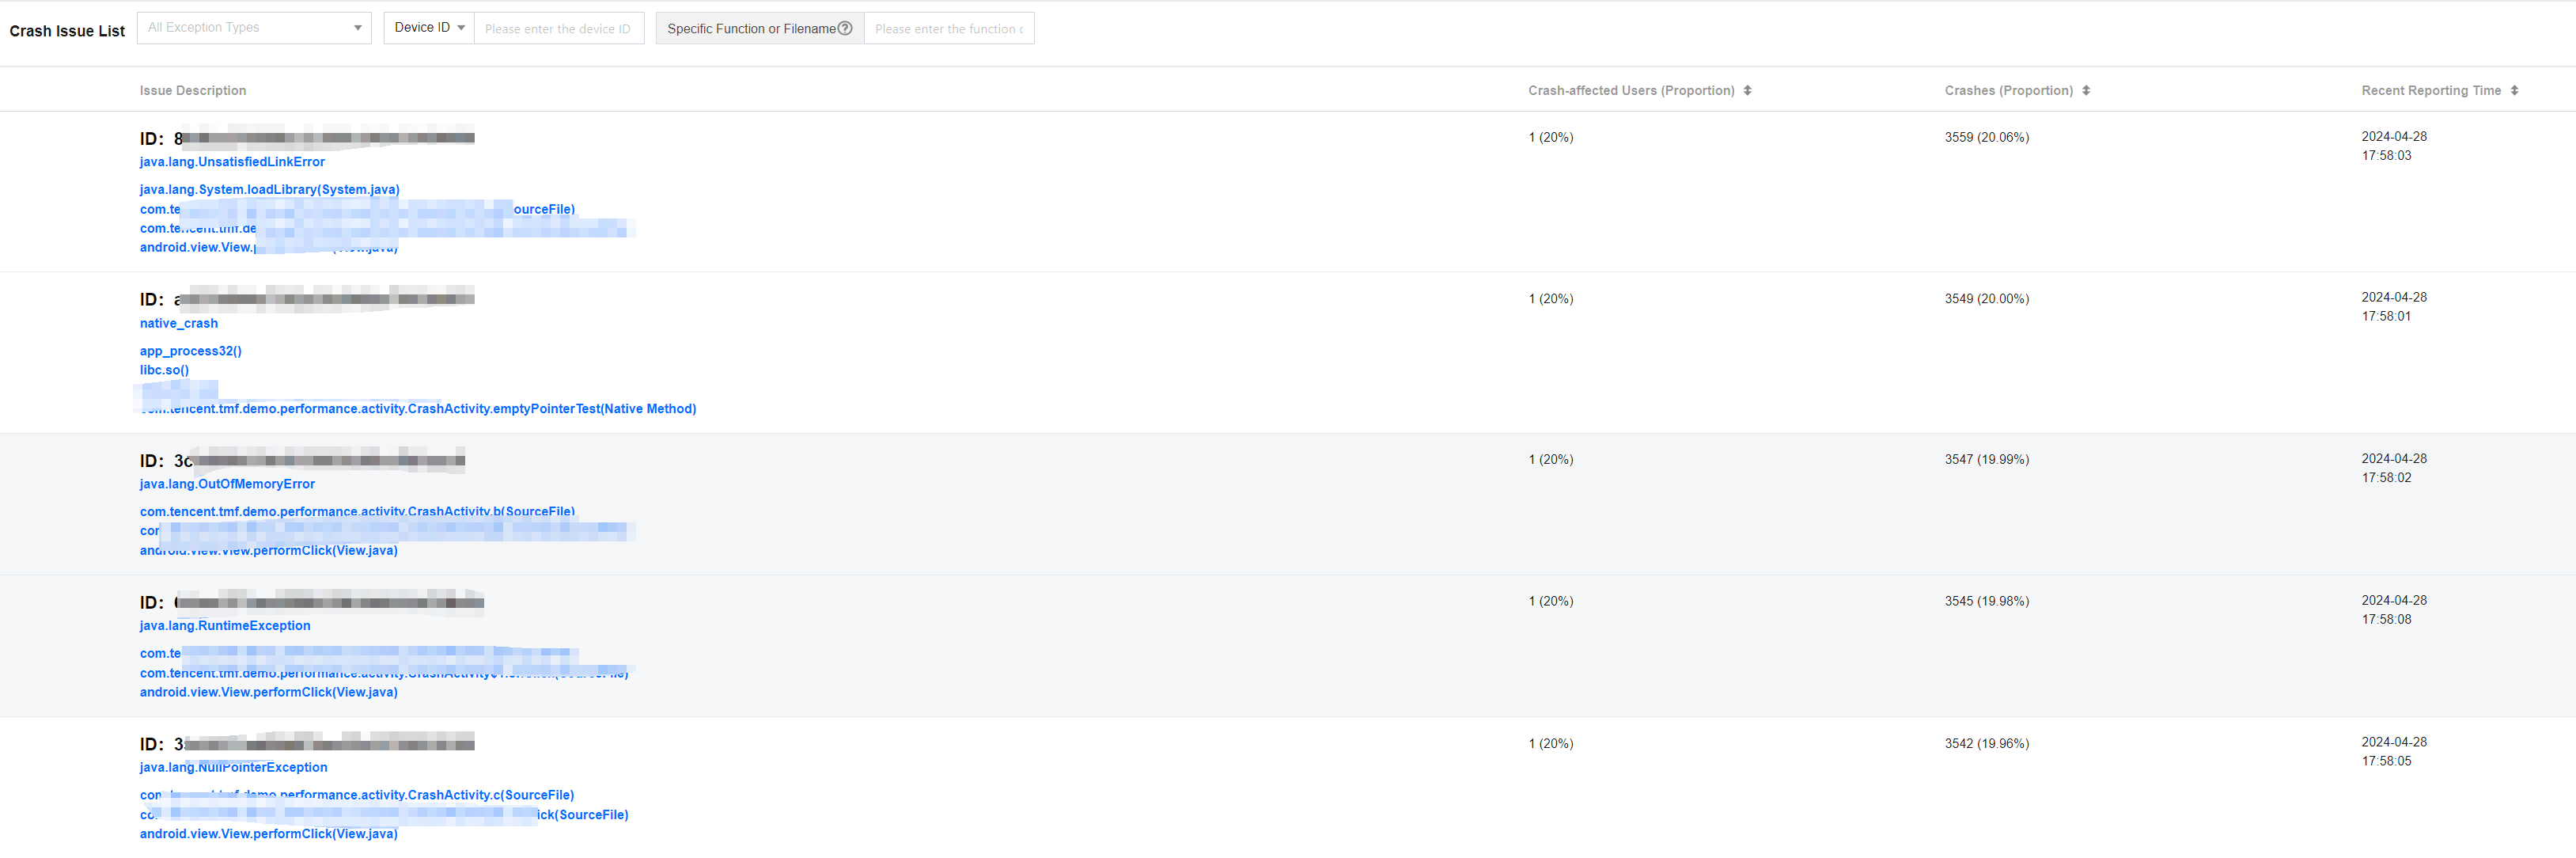
Crash Issue List
The crash issue list shows crashes of all devices. You can quickly filter crashes by error type, device ID, function, or filename. You can also click Issue Description to view the details of crashes and pinpoint the root causes of crashes.
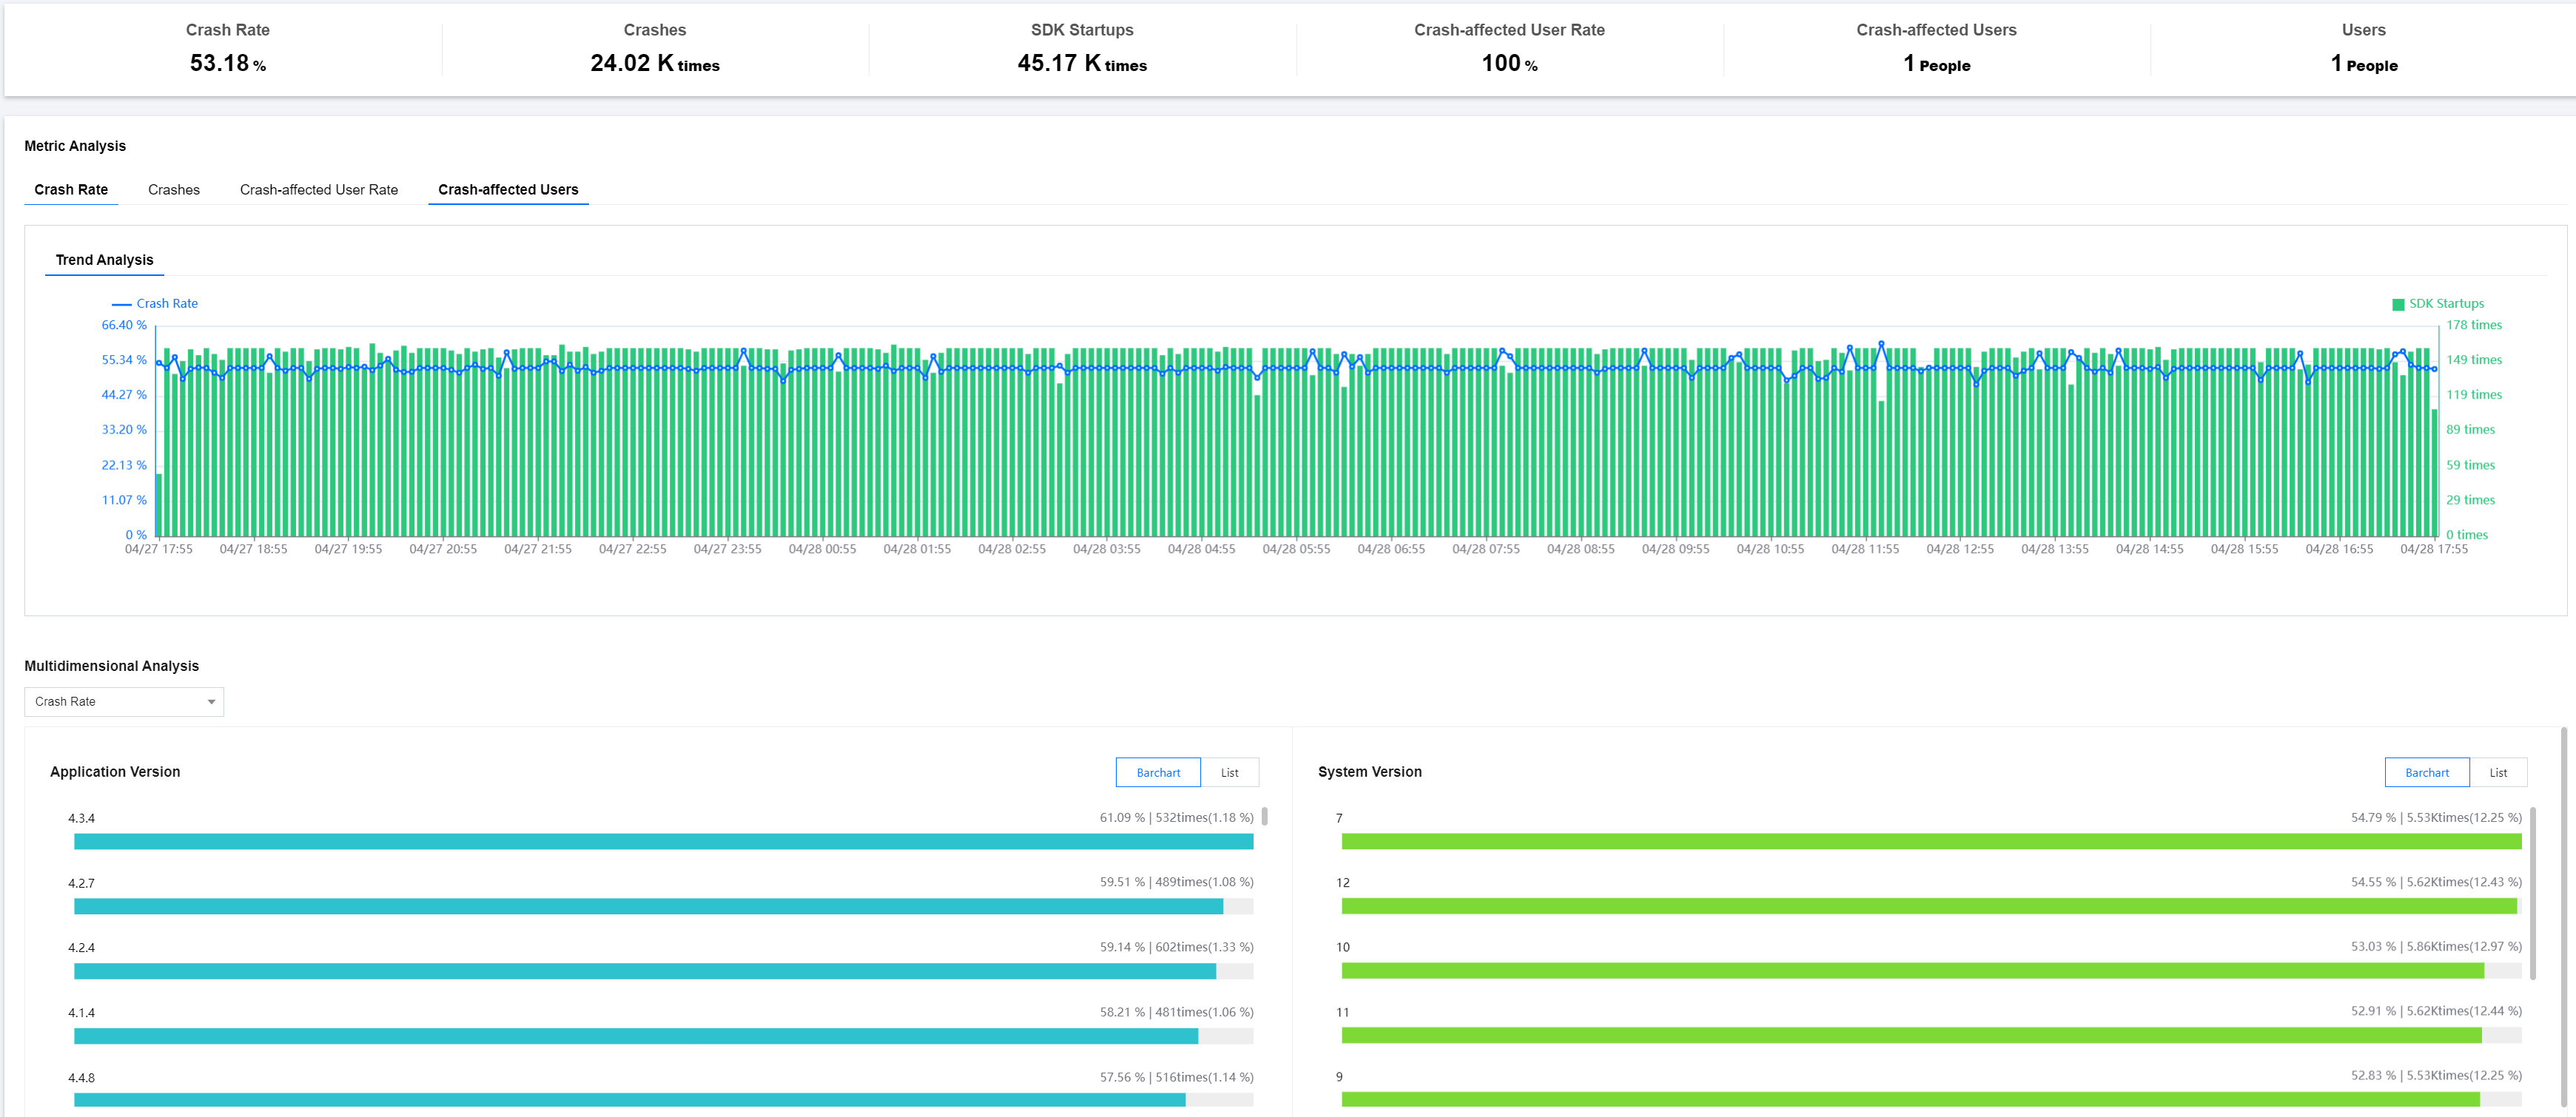
Metrics Description
Related Metrics are as follows:
Metric Name
Metrics Description
Crash Rate
Number of crashes/Number of app launches within a specified time range
Crash-affected User Rate
Number of users affected by crashes/Number of users launching the app within a specified time range
Crashes
Number of crashes within a specified time range
Crash-affected Users
Number of users affected by crashes within a specified time range
Crash Type
Classified into Java crashes and Native crashes based on the location of the crash occurrence