Viewing Audit Instances
Download
포커스 모드
폰트 크기
This document describes how to view the list and status information ofTencent Cloud Distributed Cacheinstances that have the audit feature enabled.
Use Cases
When you encounter the following management requirements, you can centrally view and manage them through the audit instance list:
Audit Coverage Inventory for Instances: Centrally view the audit activation status of each database instance, quickly confirm whether core business is fully covered by audit, to meet enterprise security compliance and regulatory requirements.
View audit configuration details: Check the audit configuration details of specific instances, such as the current audit storage status, retention period for high-frequency and low-frequency storage, and whether degradation protection has been triggered, to ensure the configuration meets expectations.
Multi-project Ops Grouping: Targeting scenarios with multiple independent project groups or business lines within the enterprise, it supports combined filtering via associated projects or custom tags, helping the Ops team achieve isolated management and quick identification across business lines and projects.
Operation Steps
1. Log in to the Tencent Cloud Distributed Cache console.
2. In the left sidebar, select Database Audit under the Distributed Cache (Redis OSS-Compatible) menu.
3. At the top of the Database Audit page, select the region to view. On the Audit Instance tab, you can view all instances in that region that have Database Audit enabled. In the search box above the database instance list, you can filter target instances by keyword: it supports searching by instance ID, Instance Name, Tag Key, and Tag.
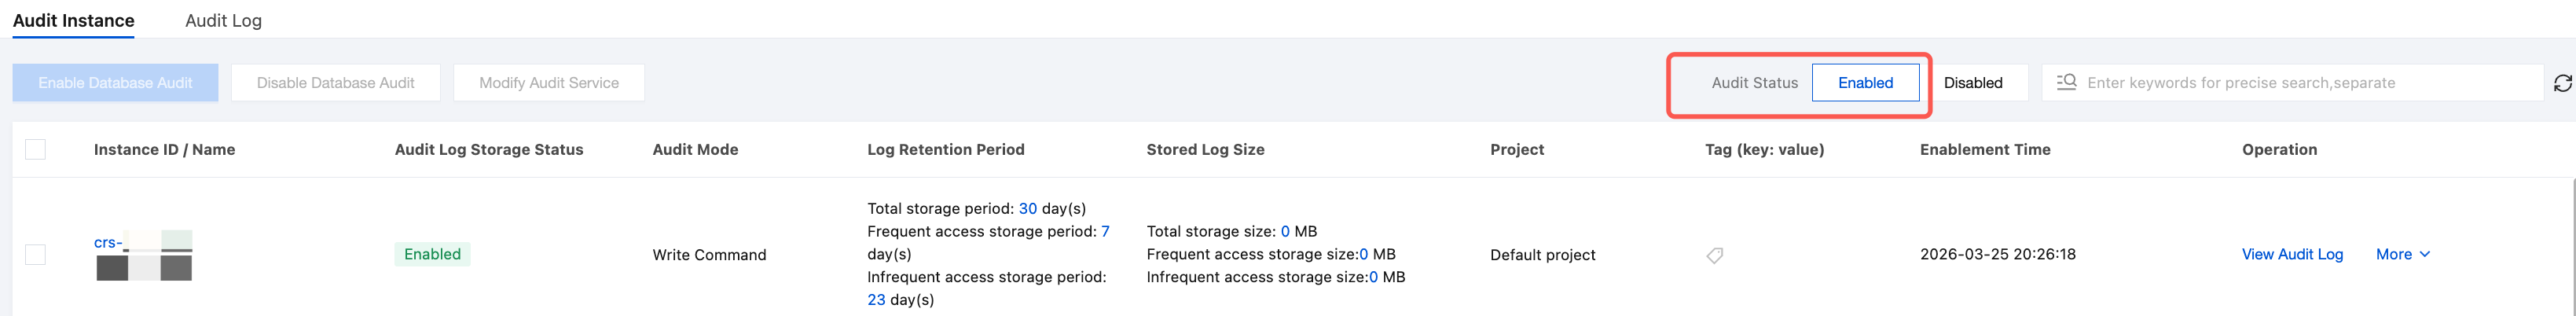
Parameter Name | Note |
Instance ID/Name | The unique identifier (ID) and custom name of the target database instance. |
Audit Log Storage Status | The current operational status of the audit feature for the instance, including: Enabled, Disabled. |
Audit Mode | The audit data capture type configured for the current instance. Write Command(default): Data modification commands covering write operations for all data structures such as strings, hashes, lists, sets, and sorted sets. Read Command: Data query commands covering read operations for all data structures and metadata query operations. All Commands: Audits the execution of all commands. |
Log Retention Period | Lifecycle configuration for audit logs. It consists of the following three items: Total storage period: The total number of days audit logs are retained (that is, the sum of high-frequency and low-frequency storage durations). Expired data will be automatically purged. Frequent access storage period: The number of days logs are stored in high-performance media, providing faster query response, suitable for recent high-frequency search. Infrequent acess storage period: The number of days logs are stored after the high-frequency duration is exceeded, used for long-term archiving. While identical in functionality, query performance is relatively lower. |
Stored Log Size | Refers to the actual physical storage space occupied by the audit logs of the current instance. Specifically composed of the following three metrics: Total storage size: The total space occupied by all audit logs of the current instance (that is, the sum of high-frequency storage volume and low-frequency storage volume). Frequent acess storage size: The storage space occupied by logs within the "high-frequency storage duration" period. This data is stored in high-performance media to support fast query and search. Infrequent acess storage size: The storage space occupied by logs that have been automatically tiered down to cold storage after the high-frequency retention period is exceeded. This data is stored in archival media to meet long-term compliance storage requirements. |
Project | The project to which the instance belongs in the organizational structure, used for resource isolation management. |
Tag (key: value) | Custom key-value pairs bound to the instance, commonly used for multi-dimensional resource categorization and group search. |
Enablement Time | The specific time when the instance first successfully enabled the Database Audit Service. |
Operation | Click View Audit Log to view detailed information of the instance's audit logs. For specific information, see Managing Audit Logs. Click More > Modify Audit Service to modify audit configuration information, including audit type, audit log retention period, and other settings. For specific information, see Modify Audit Configuration. Click More > Disable Database Audit to stop the audit feature. For specific information, see Disable Database Audit. |
FAQs
Q1:
In the "Audit Status" filter box on the audit instance list page, select "Enabled", and the list will display only instances with audit enabled.
Q2: Can audit instances be filtered by region?
The current page supports multi-dimensional combined filtering by region, instance ID/name, project, tag, and audit status.
Q3: Why has my instance been writing data at a high frequency, but the "log storage volume" displayed on the list page has not increased immediately?
The " Stored Log Sise" displayed on the console list page (including total storage size and high/low-frequency storage size) primarily reflects the actual physical space occupancy at the underlying layer. There may be some delay in data aggregation and flushing to disk (typically hour-level or periodic refresh). We recommend that you refresh the page after peak business hours to obtain the most accurate storage volume data.
피드백