Monitoring Through Prometheus
Download
포커스 모드
폰트 크기
This practice tutorial uses Prometheus-3.1.0 to monitor TencentDB for Redis®. To download the required version, visit the official website of Prometheus: Prometheus.
Configuring prometheus.yml
In the configuration file prometheus.yml of Prometheus, open the scrape_configs section and add a scraping job to monitor the Spring Boot application. The configuration item description is as follows:
### Monitor the SpringBoot project.- job_name: 'monitor'scrape_interval: 5smetrics_path: '/actuator/prometheus'static_configs:- targets: ['172.27.XX.XX:8080']
Starting Prometheus
1. Run the following command to start up TencentCloud Managed Service for Prometheus (TMP). After startup, monitor the log output to ensure there is no error. If an error occurs, perform troubleshooting according to the prompt messages in logs and resolve issues.
./prometheus --config.file=prometheus.yml
2. The default listening port for Prometheus is 9090. After Prometheus is started normally, visit
http://localhost:9090 through the browser to view the Prometheus management interface.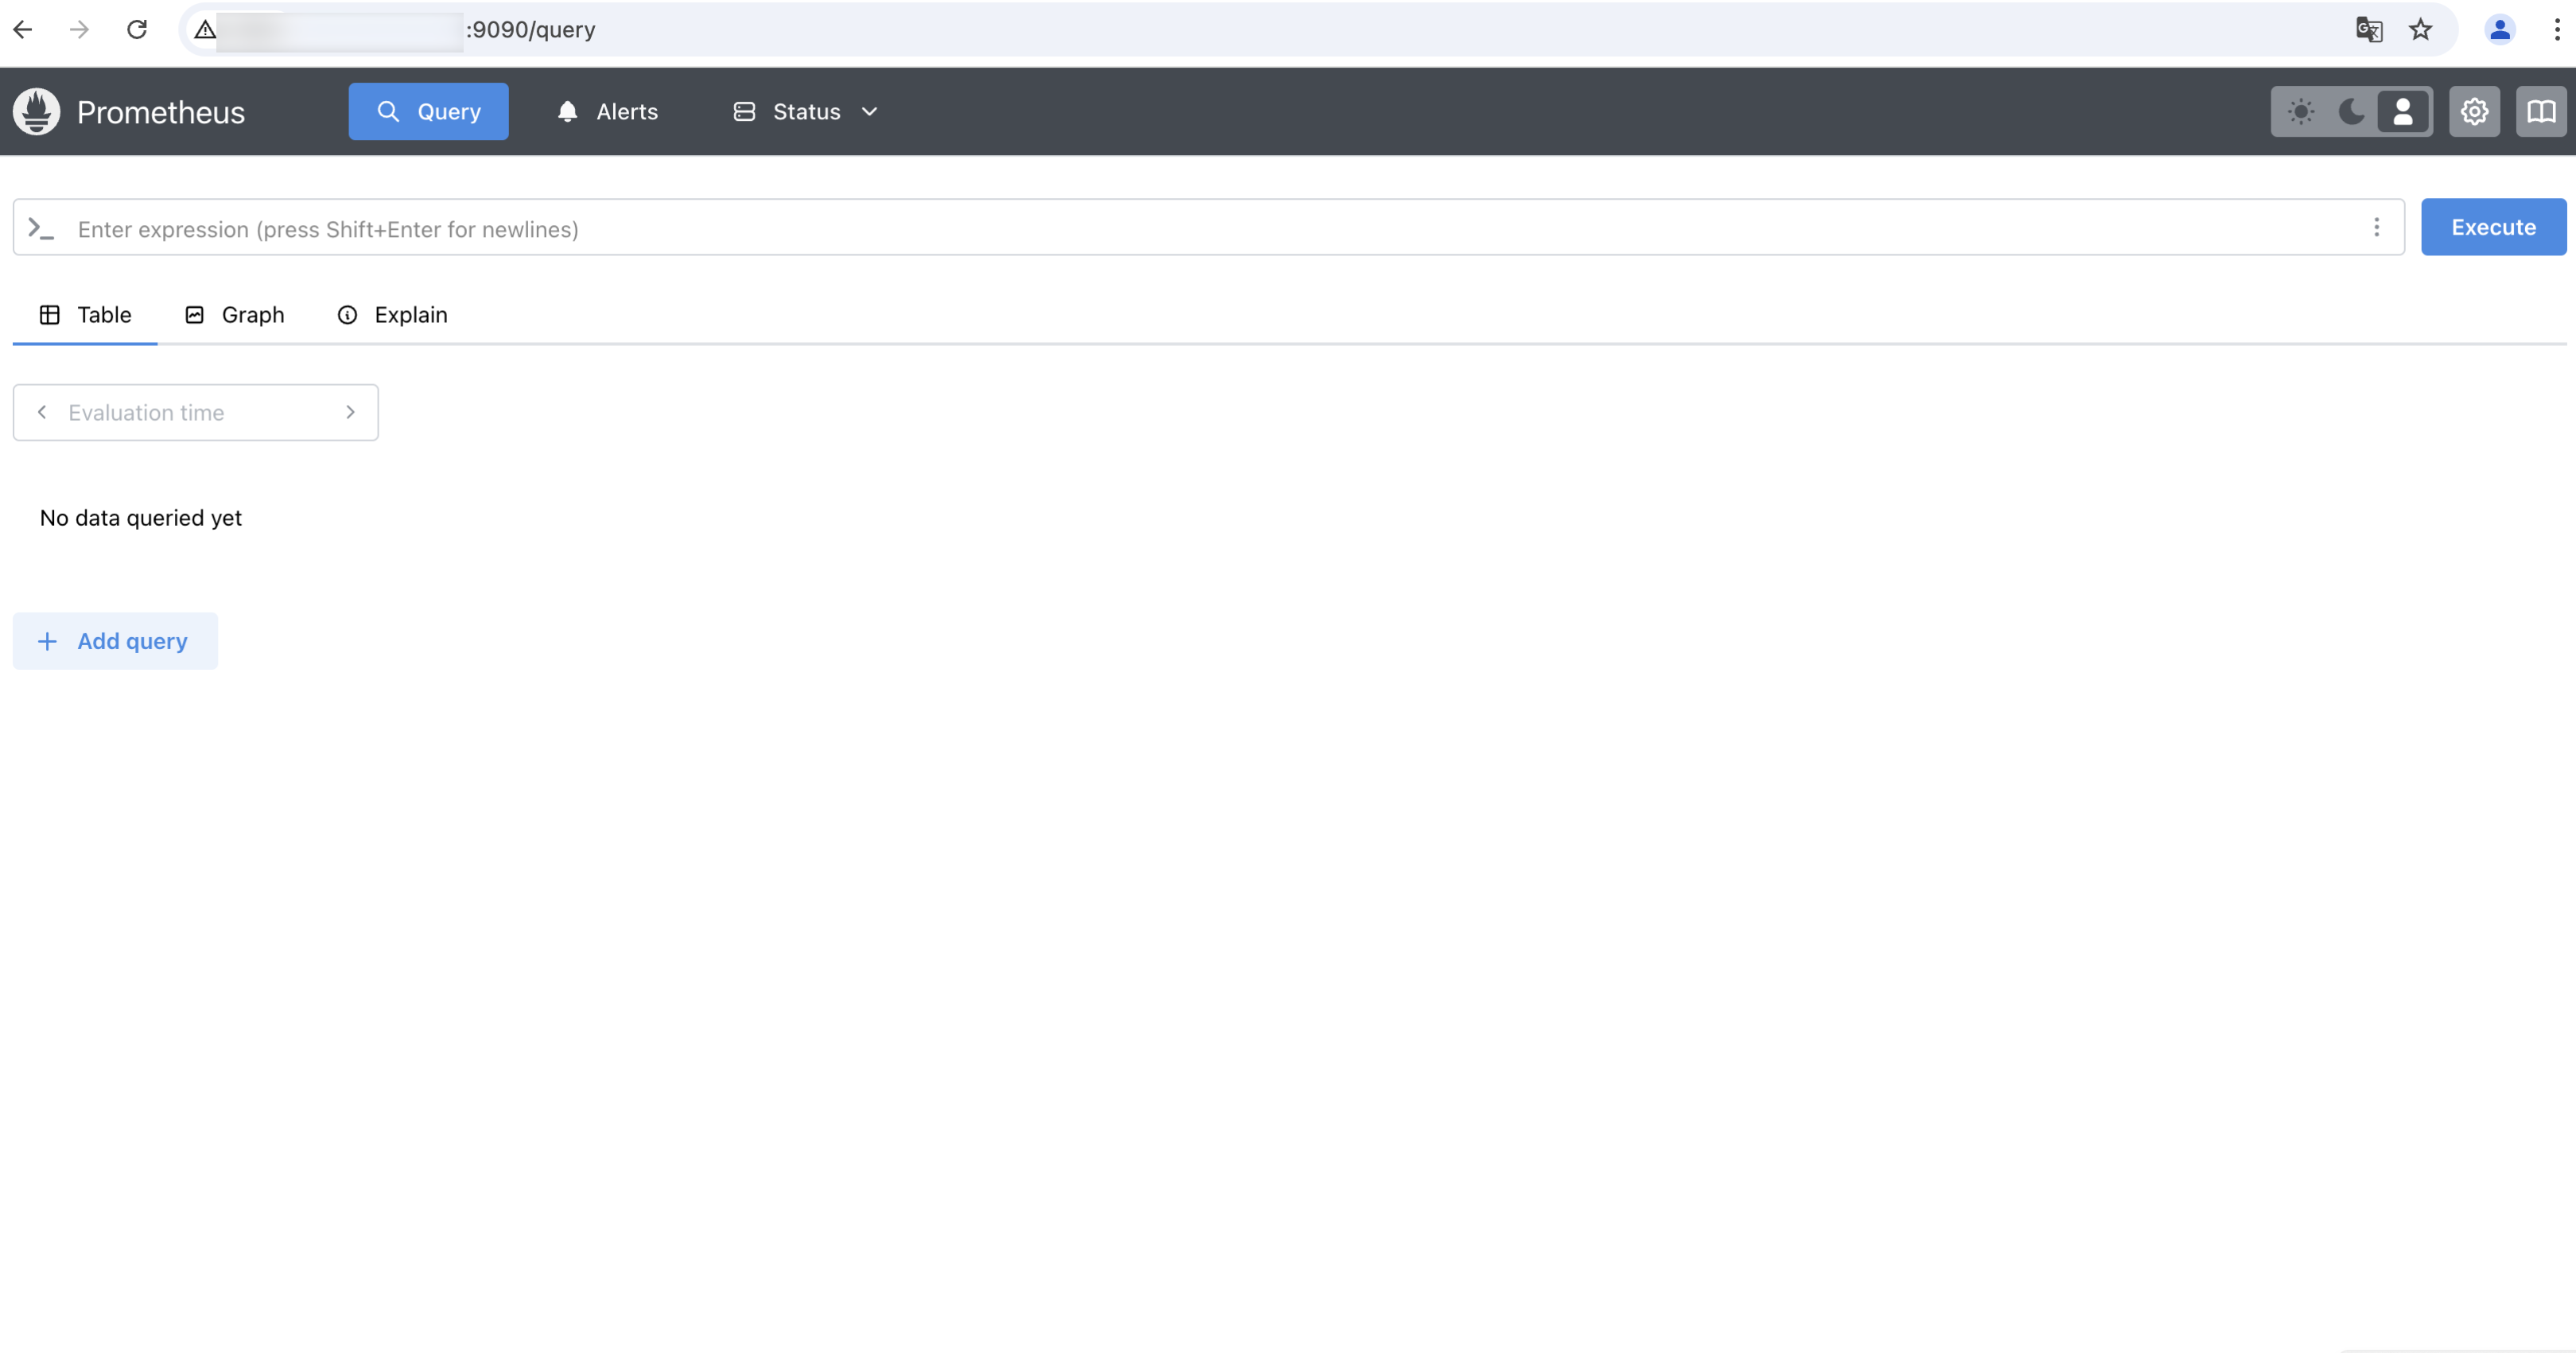
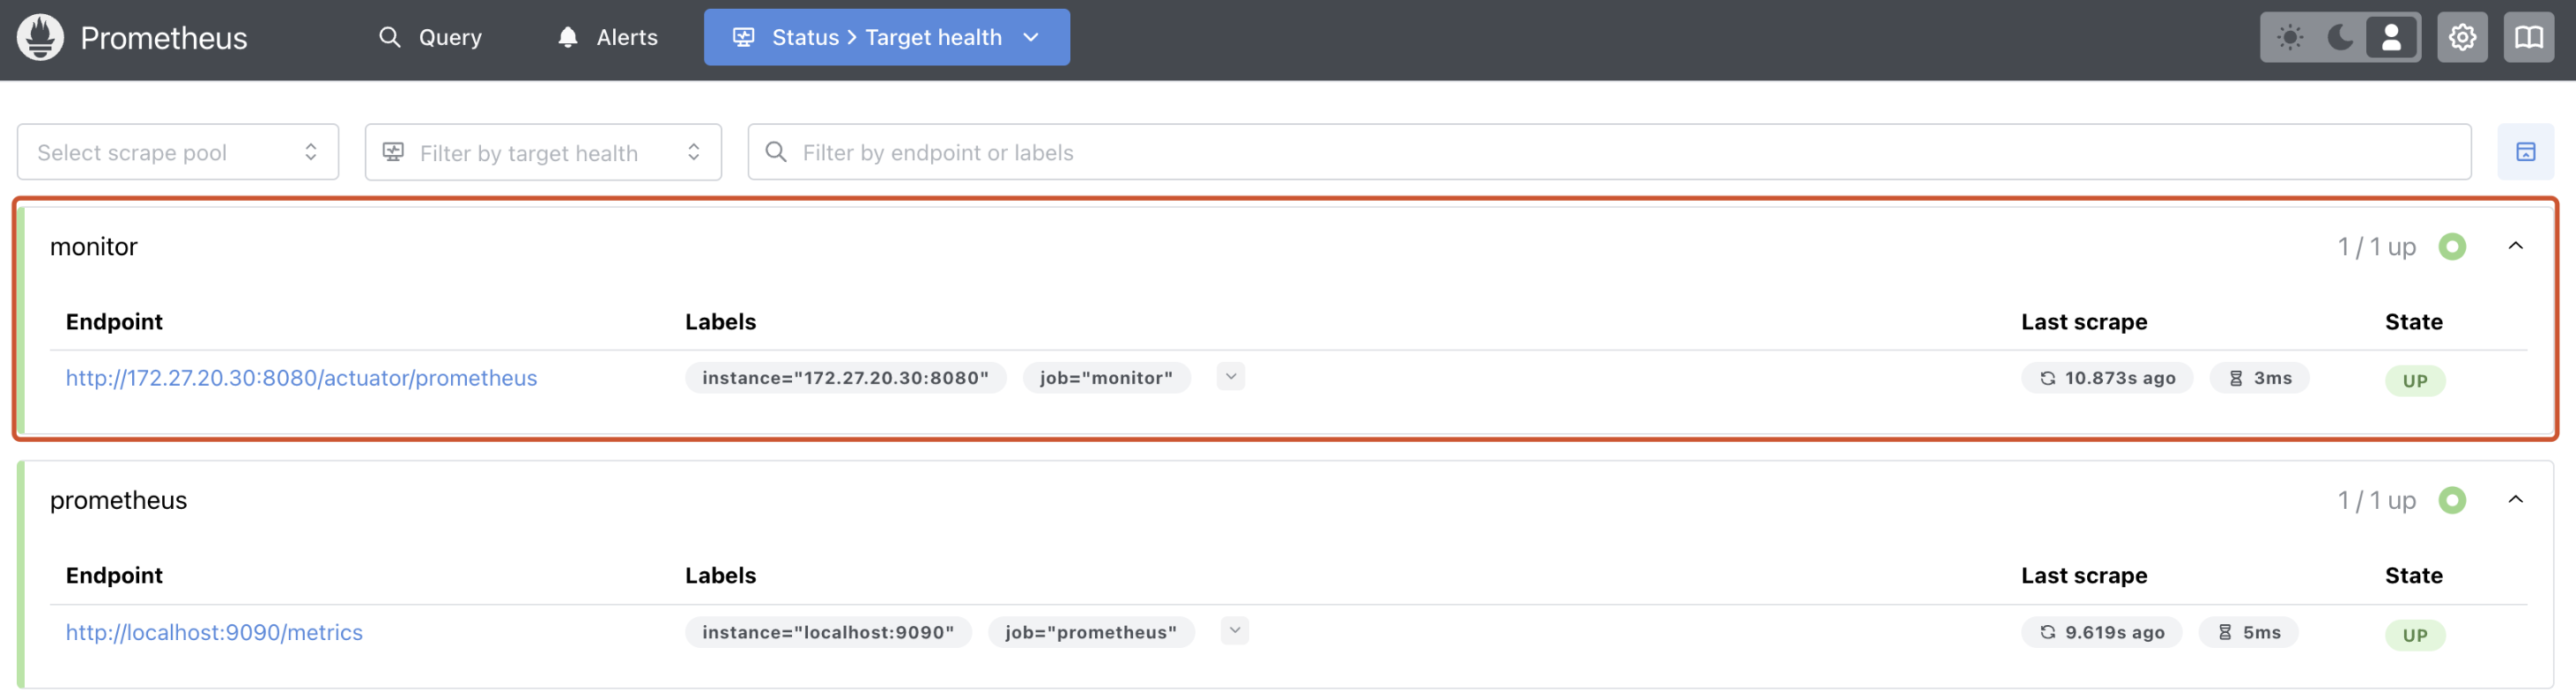
3. In the top navigation bar, choose Status > Target health to view the configured monitor task and check whether the State is UP.
Using Prometheus
1. Use the implemented web service to perform operations on TencentDB for Redis®, generating monitoring data. This practice tutorial uses a bash script to continuously perform SET and GET operations on TencentDB for Redis®.
#!/bin/bash# Initialize the counter.counter=1# Infinite loop.while true; do# Generate the current key and value, which changes every time.key="test${counter}"value="Hello${counter}"# Run the CURL command to call the SET API of the web service and perform the SET operation on TencentDB for Redis®.echo "Setting key: ${key} with value: ${value}"curl -X POST "http://localhost:8080/redis/set?key=${key}&value=${value}"echo -e "\\n"# Run the CURL command to call the GET API of the web service and perform the GET operation on TencentDB for Redis®.echo "Getting value for key: ${key}"curl -X GET "http://localhost:8080/redis/get?key=${key}"echo -e "\\n"# Add a counter.counter=$((counter + 1))# Wait for 5 seconds.sleep 5done
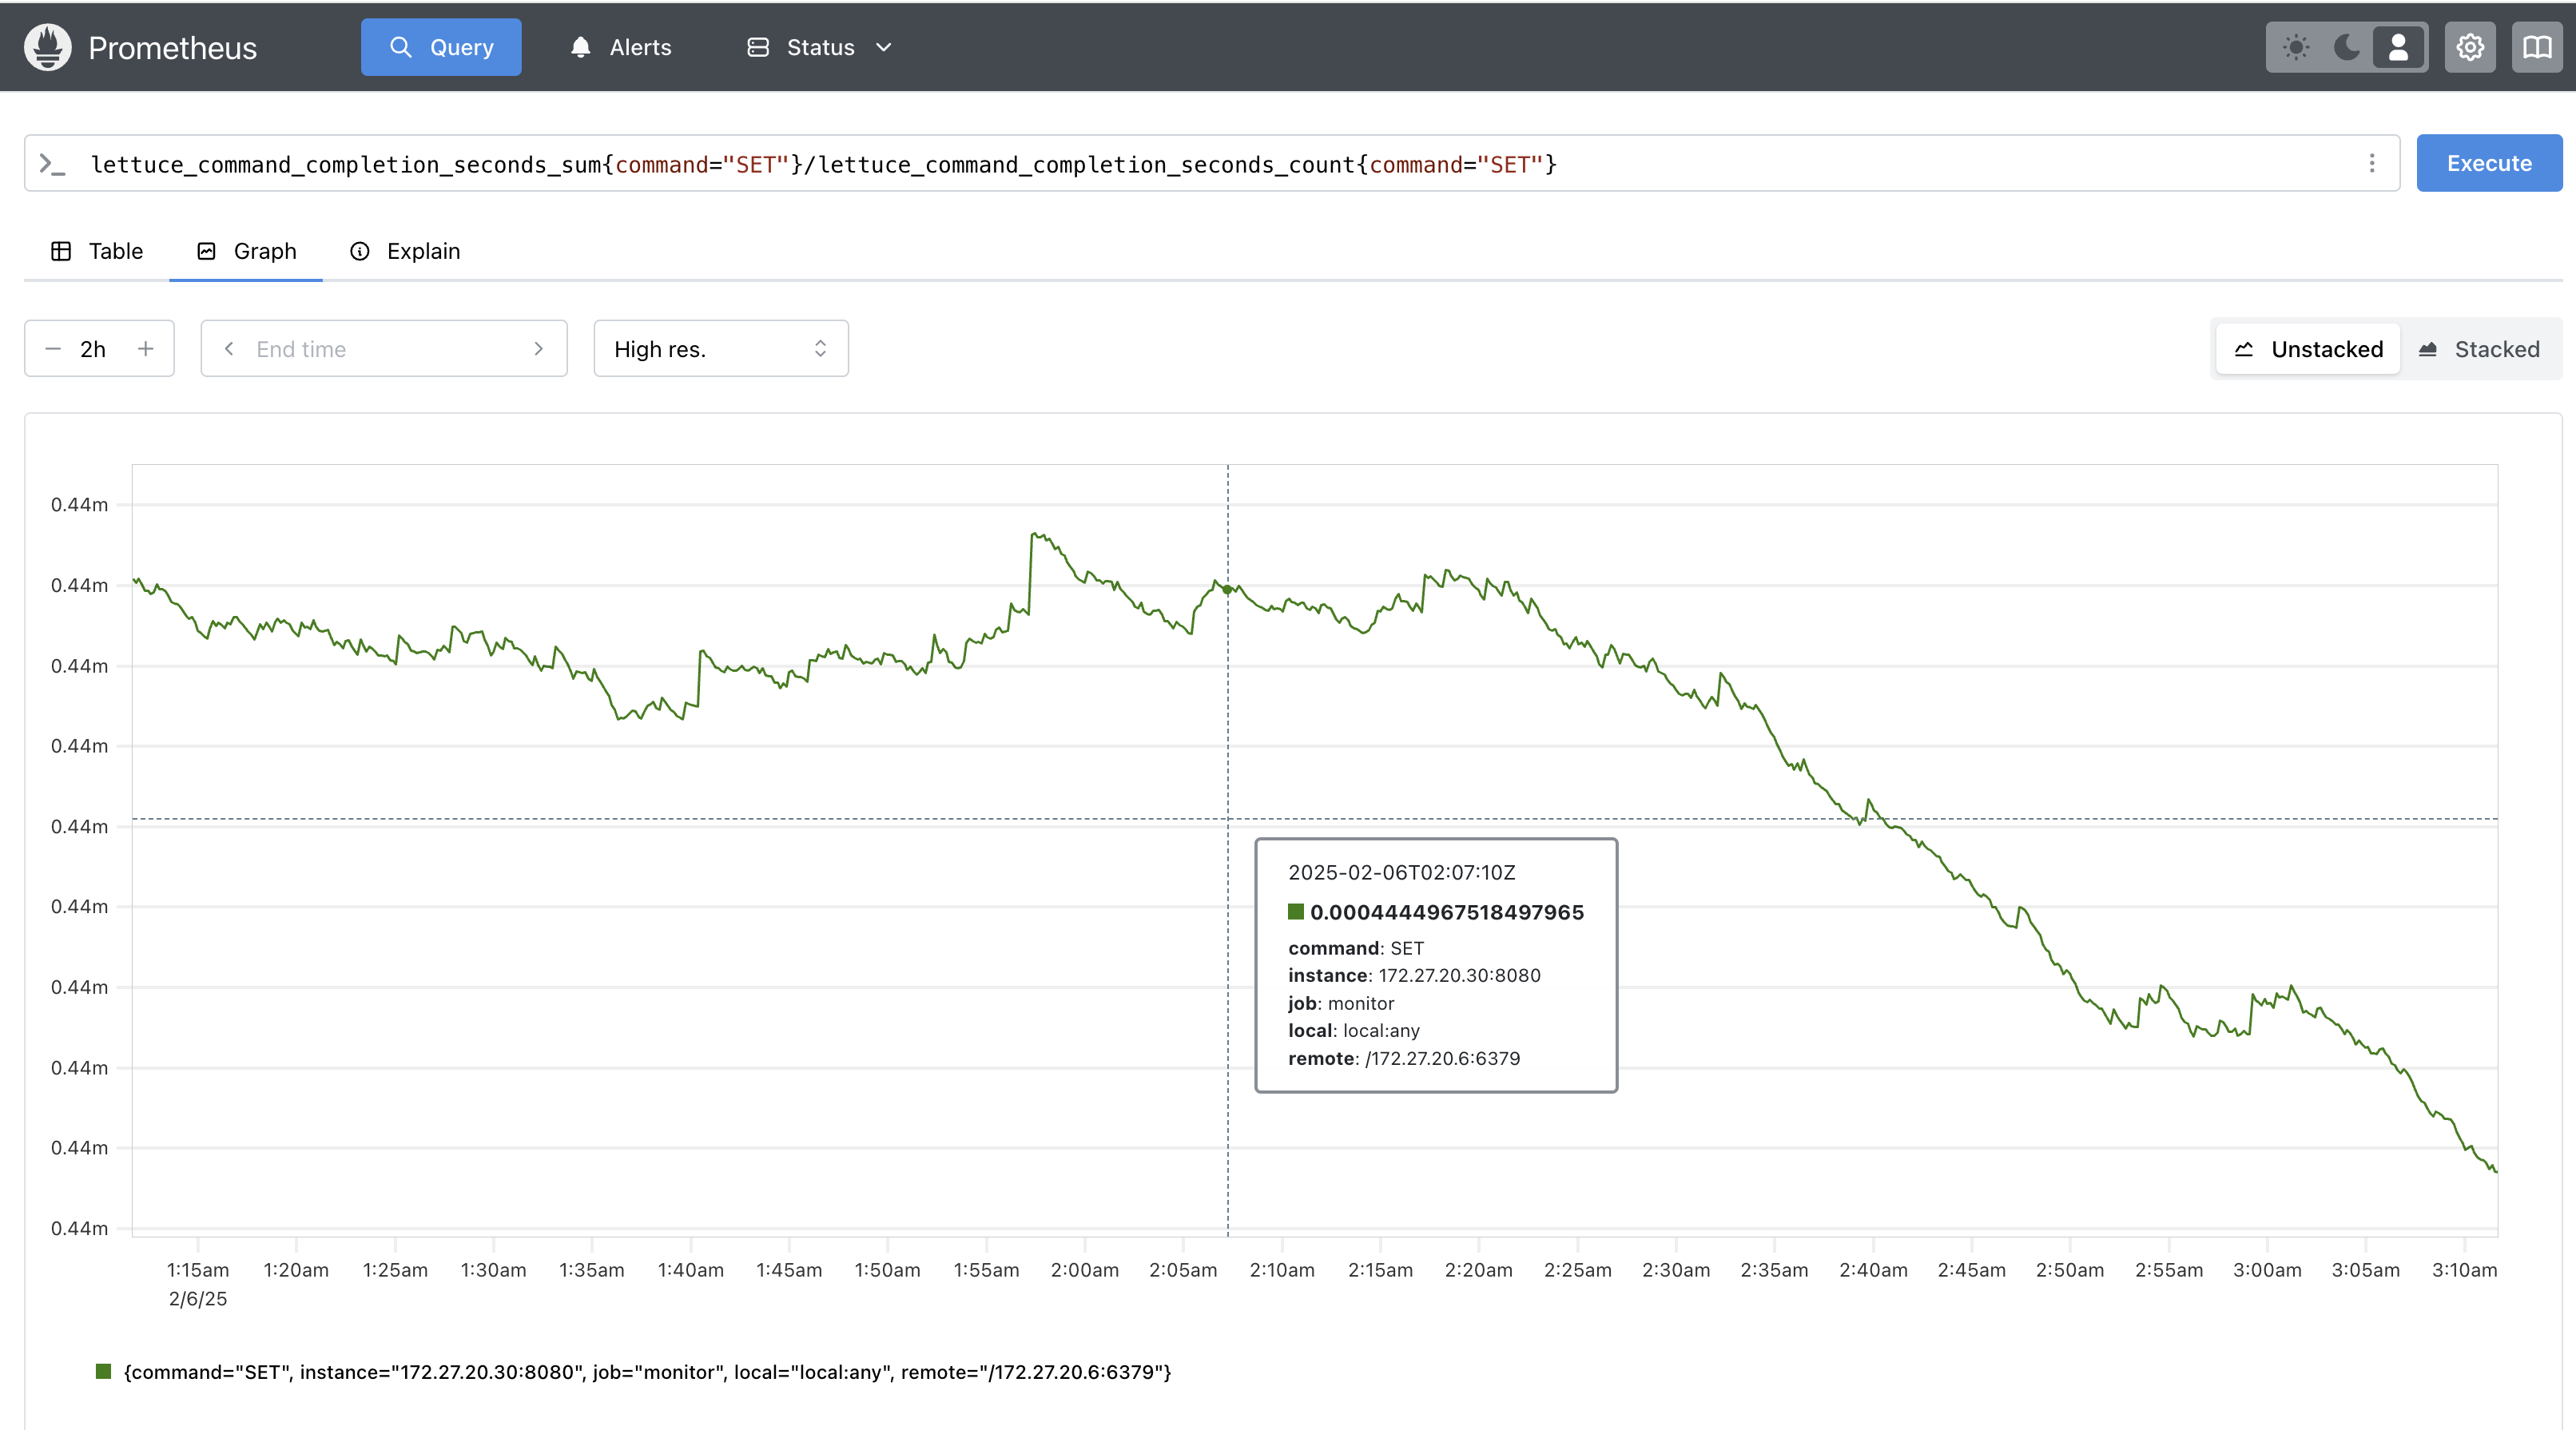
2. Access the Prometheus operation interface, run the following command in the command box on the Query page to obtain the monitoring view for the average latency of the SET command.
lettuce_command_completion_seconds_sum{command="SET"}/lettuce_command_completion_seconds_count{command="SET"}
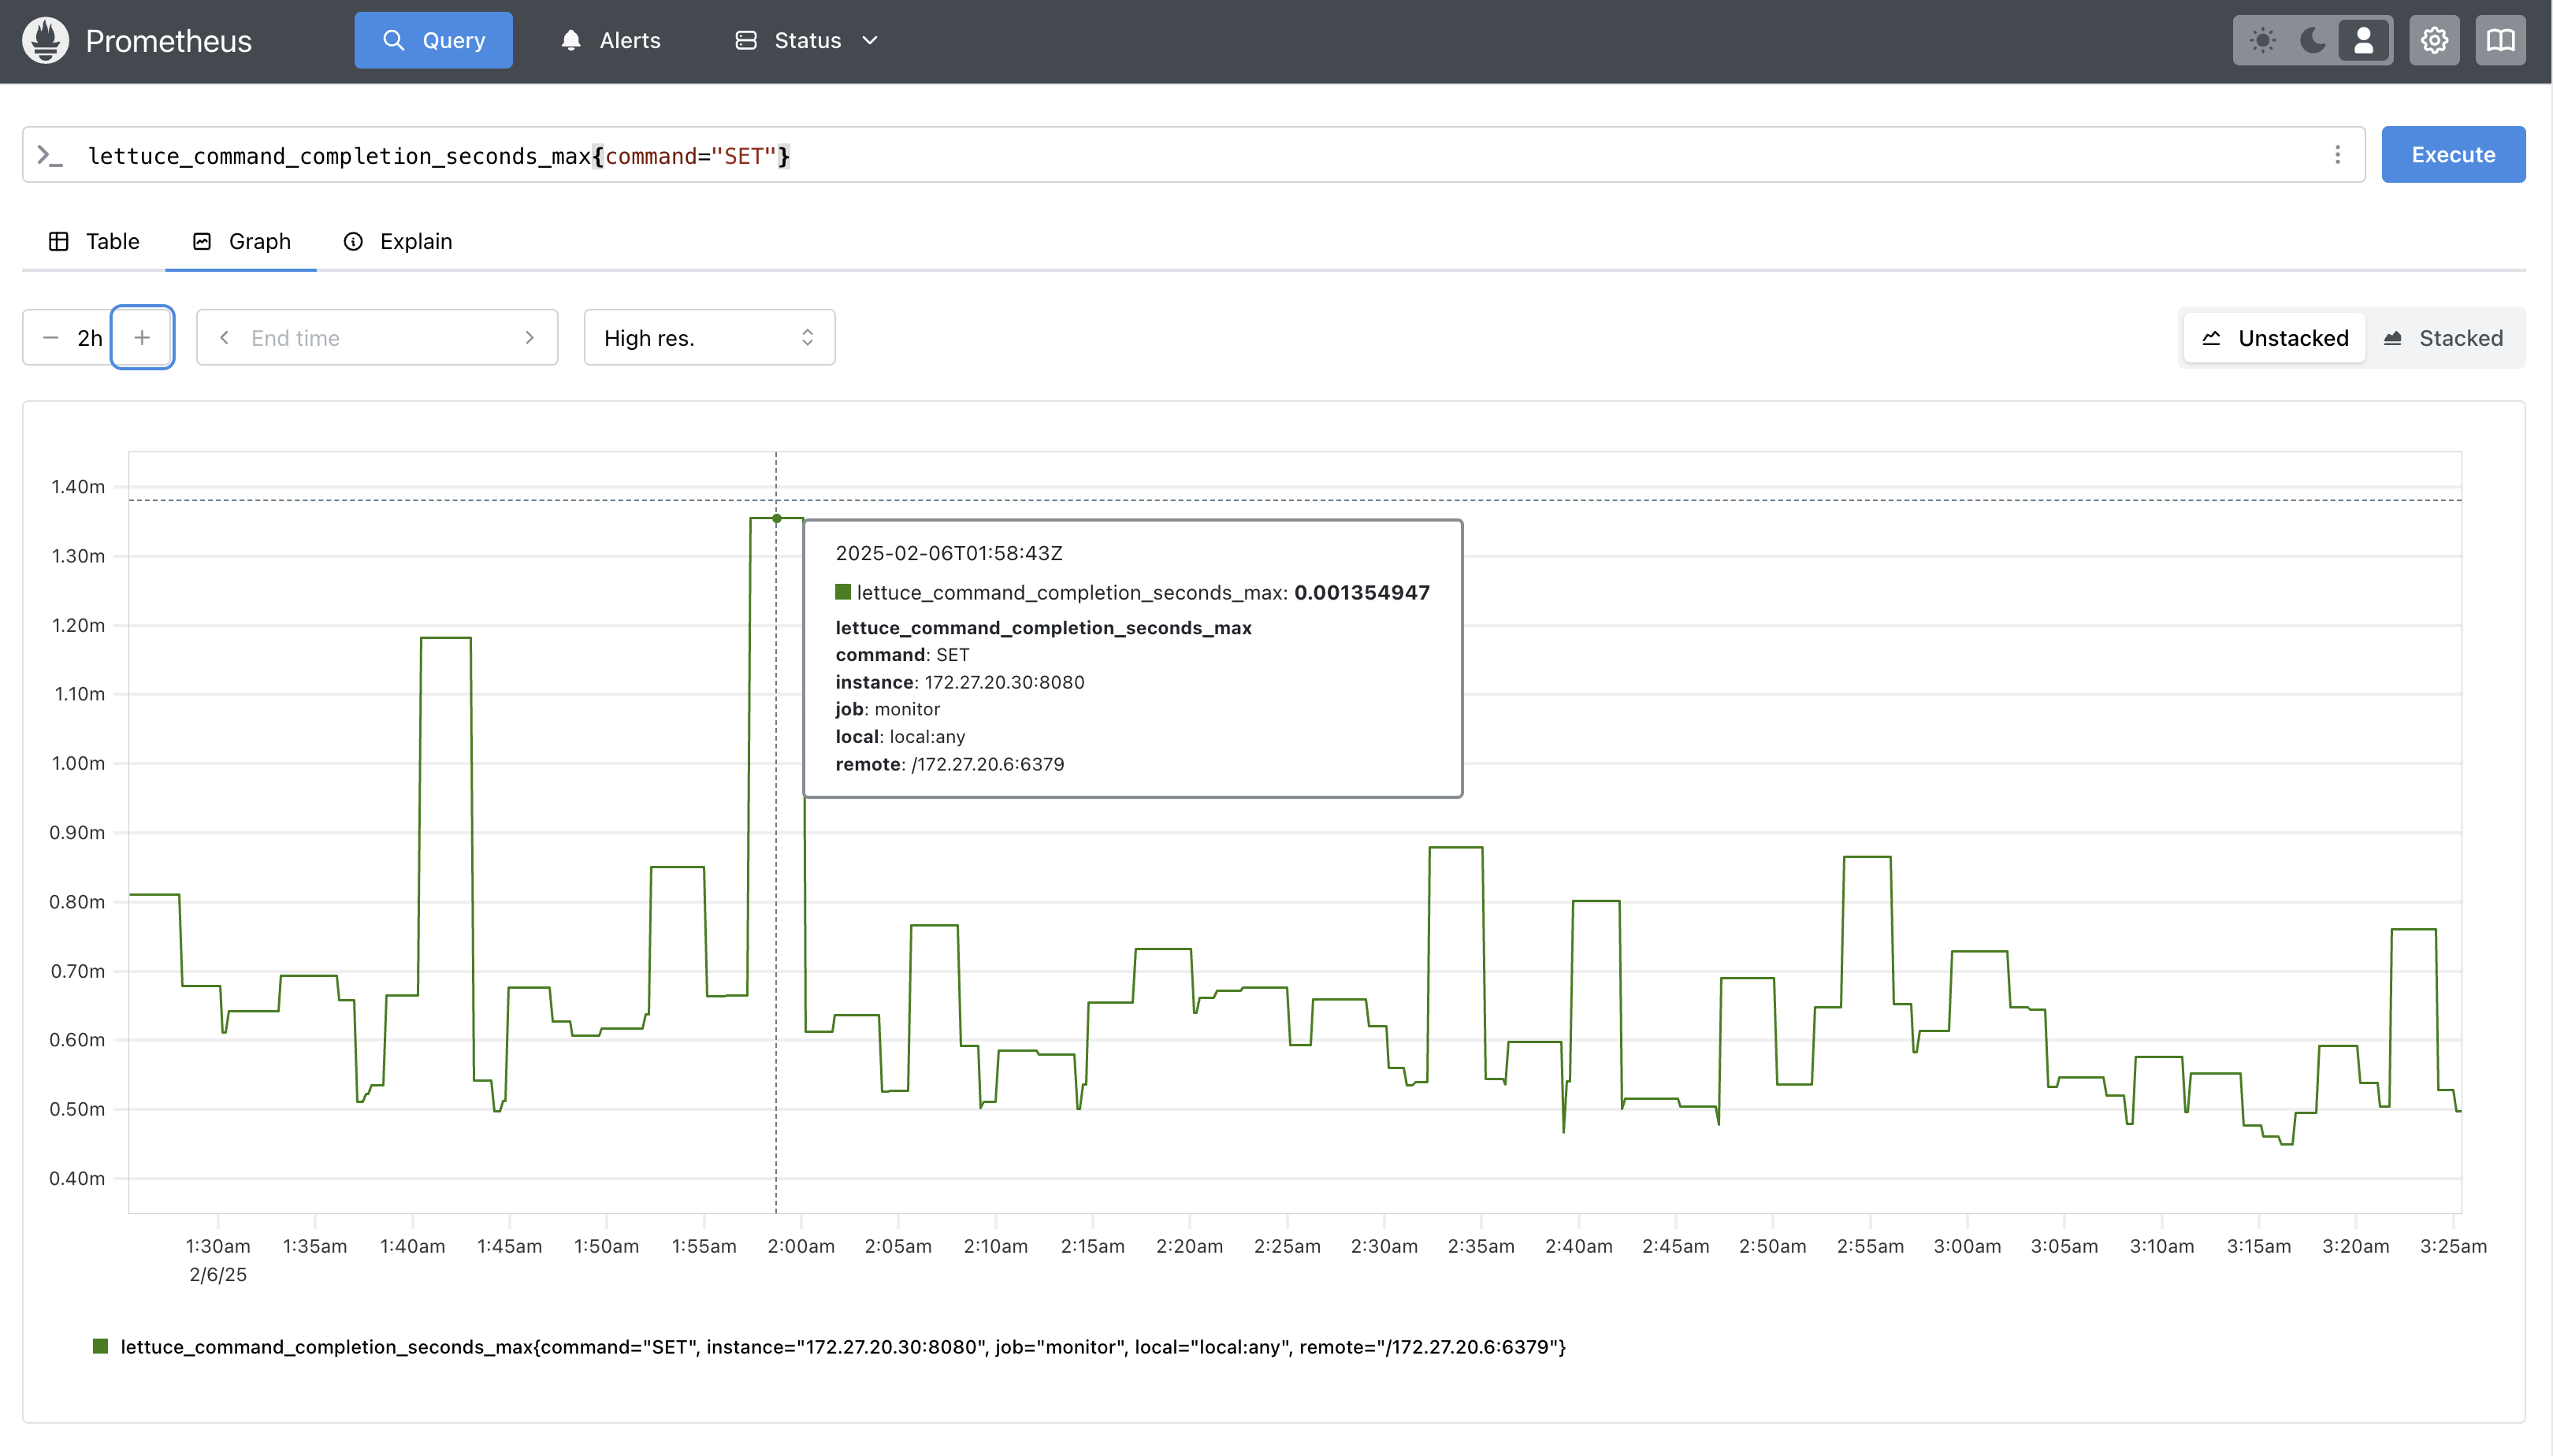
3. Enter
lettuce_command_completion_seconds_max{command="SET"} in the command box to check the maximum latency of the SET command. As shown in the figure, the maximum latency is about 1.35 ms.Note:
This tutorial counts the metrics from the moment a command is sent to TencentDB for Redis® until a complete response is received from TencentDB for Redis®. Lettuce also provides time from when a command is sent to TencentDB for Redis® until the first byte of the TencentDB for Redis® response is received. Clients can perform monitoring through the following metrics:
lettuce_command_firstresponse_seconds_count
lettuce_command_firstresponse_seconds_sum
lettuce_command_firstresponse_seconds_max
피드백