Dashboards are smart monitoring panels provided by Tencent Cloud Observability Platform that allow you to monitor the metric data of Tencent Cloud services. Dashboards also provide visualization and analysis features.
You can create dashboards for Tencent Cloud service metrics. The dashboards will automatically display monitoring data in intuitive and elegant charts, helping you analyze metrics through trends and exceptional values.
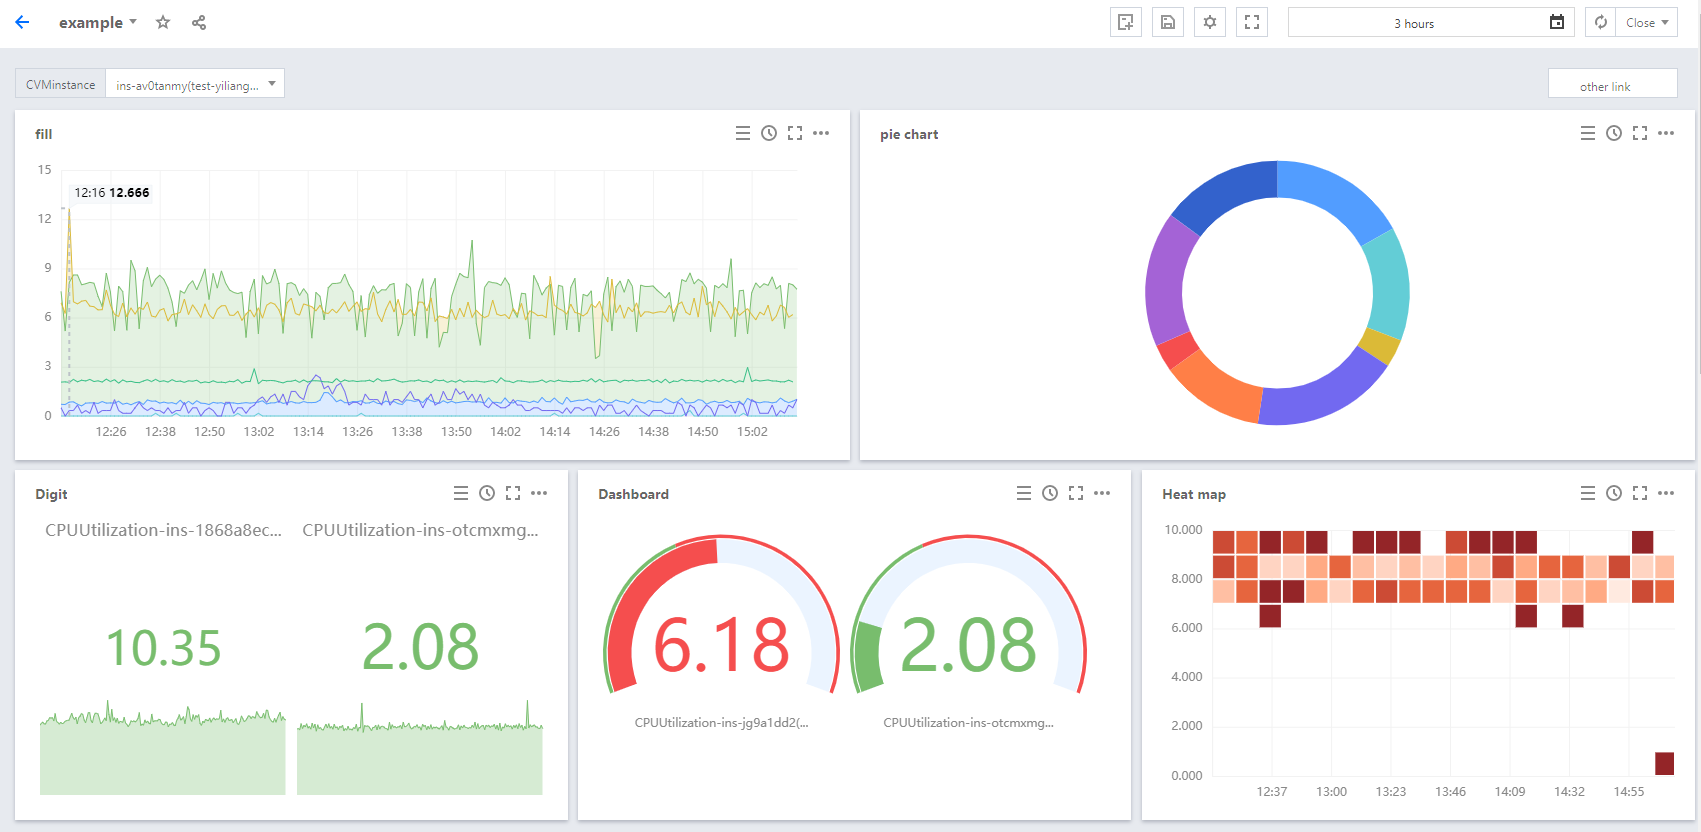
Feature Overview
Flexible chart configuration, supporting visualized charts in customizable layouts.
Displaying multiple instances or multiple metrics of the same instance in a single chart, facilitating the monitoring of key metrics of instances during troubleshooting.
Template variables, custom links, legend sorting, and other features to assist you in the overall coupling analysis of the metrics data.
Instant sharing of monitoring charts or monitoring dashboards to facilitate efficient and collaborative troubleshooting.
Use Cases
Common scenarios:
When you receive a metric alarm, you can use dashboards to analyze the cause of the alarm.
After a new feature is released, you can use dashboards to check for resource exceptions.
Through real-time metric display, you can optimize performance during business peaks.
You can view the loads on dashboards to determine whether resource scaling is needed.
Advantages:
Ready-to-use dashboards reduce the costs of human resources and time for OPS personnel when building open-source visualization software such as Grafana.
This feature meets the demand for the visualization of metric data in various monitoring scenarios, helping you analyze metric data and troubleshoot efficiently.
Use Limits
Category
Upper Limit
Number of custom dashboards
20
Number of charts on each dashboard
20
Number of instances that can be bound with each chart