通过 Kibana 使用 CLS
下载
聚焦模式
字号
操作场景
前提条件
注意:
仅支持日志主题,日志需开启索引才能使用对应的 DSL,详情请参见 索引配置。
日志服务的兼容接口基于 Elasticsearch 7.10版本,仅支持 Kibana 7.x 版本访问。
低频存储不支持聚合 DSL,不支持 Kibana 中的大多数统计图表。
部署架构
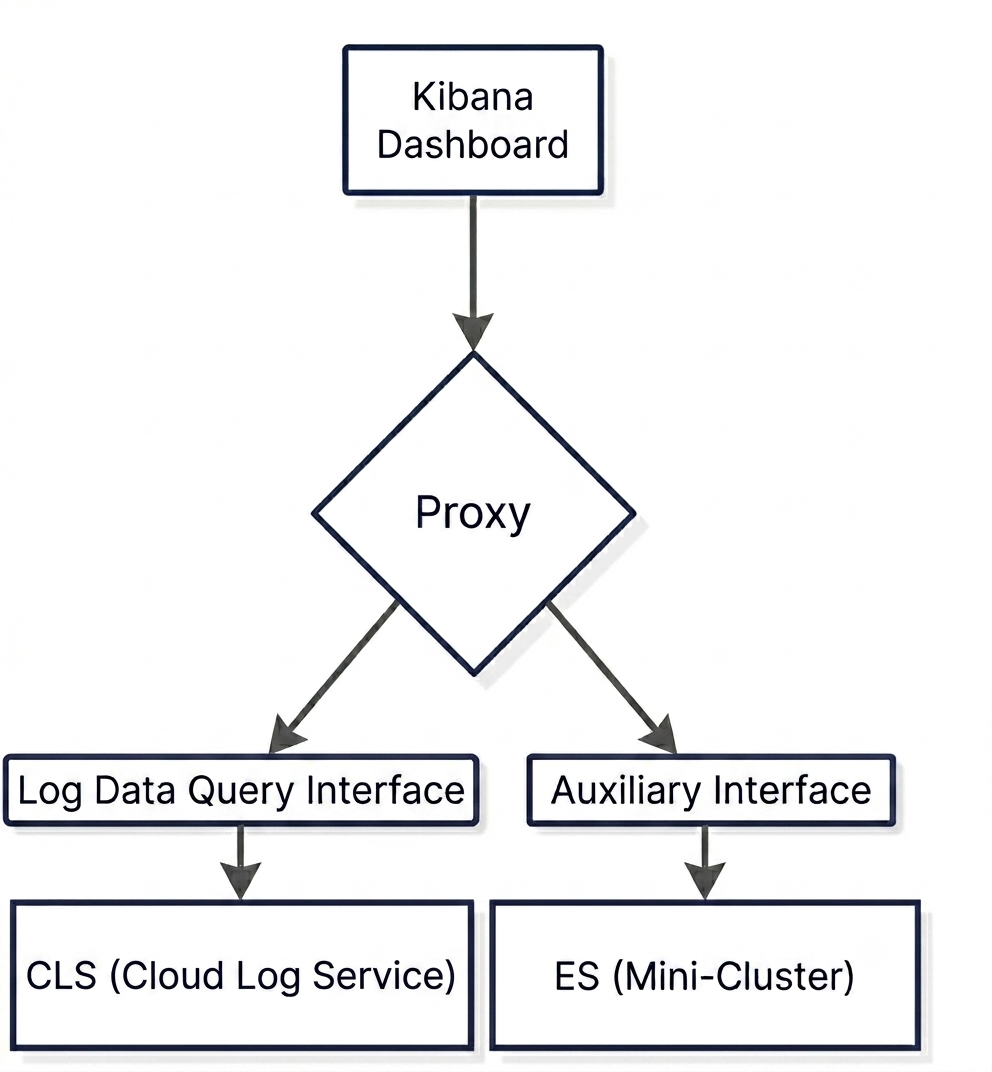
Kibana:用于查询数据,可按照操作步骤部署新的 Kibana,也可使用已有 Kibana(需参照操作步骤将 Kibana 访问 ES 的地址修改为 Proxy 地址)
Proxy:用于分发 Kibana 请求,将日志数据查询请求分发至日志服务 CLS,将 Kibana 其它配置请求分发至 ES 集群
CLS:日志服务 CLS 中的日志主题
ES:迷你集群,用于存储 Kibana 的配置信息,数据量极低,可按照操作步骤部署新的 ES,也可使用已有 ES
操作步骤
步骤1:创建子用户,授权 Kibana 访问 CLS
1. 建议您单独创建一个子账号,使用该账号的 SecretId 及 SecretKey。该账号仅授予如下接口权限即可,配置方式请参见 子账号授权。
{"version": "2.0","statement": [{"effect": "allow","action": ["cls:DescribeTopics","cls:SearchLog"],"resource": ["*"]}]}
步骤2:部署 Kibana 相关环境
1. 部署 ES (迷你集群),请替换其中的
{es_password}为您需要设定的 ES 访问密码。docker run -d \\--name elasticsearch-7.10.2 \\-p 9200:9200 \\-e "discovery.type=single-node" \\-e "ES_JAVA_OPTS=-Xms1g -Xmx1g" \\-e "xpack.security.enabled=true" \\-e "ELASTIC_PASSWORD={es_password}" \\docker.elastic.co/elasticsearch/elasticsearch:7.10.2
2. 部署 Proxy。
docker run -d \\--name cls-kibana-proxy \\-p 9201:9201 \\-e META_ES_ENDPOINT={es地址, http://ip:port} \\-e META_ES_USERNAME={es_user} \\-e META_ES_PASSWORD={es_password} \\-e CLS_REGION={region} \\-e CLS_SECRET_ID={SECRET_ID} \\-e CLS_SECRET_KEY={SECRET_KEY} \\-e CLS_SYNC_ENABLED=true \\-e CLS_SYNC_FILTERS=* \\gz-cls-images.tencentcloudcr.com/public/kibana-proxy:alpha-v0.6
docker run -d \\--name cls-kibana-proxy \\-p 9201:9201 \\-e META_ES_ENDPOINT={es地址, http://ip:port} \\-e META_ES_USERNAME={es_user} \\-e META_ES_PASSWORD={es_password} \\-e CLS_REGION={region} \\-e CLS_SECRET_ID={SECRET_ID} \\-e CLS_SECRET_KEY={SECRET_KEY} \\-e CLS_SYNC_ENABLED=true \\-e CLS_SYNC_FILTERS=* \\-e CLS_REGION_1={region_1} \\-e CLS_SECRET_ID_1={SECRET_ID} \\-e CLS_SECRET_KEY_1={SECRET_KEY} \\-e CLS_SYNC_FILTERS_1=* \\gz-cls-images.tencentcloudcr.com/public/kibana-proxy:alpha-v0.6
变量说明如下:
变量 | 必填 | 说明 |
META_ES_ENDPOINT | 是 | ES(迷你集群)访问地址,格式为 http://ip:port |
META_ES_USERNAME | 是 | ES 访问用户名,默认为 elastic |
META_ES_PASSWORD | 是 | ES 访问密码 |
CLS_REGION | 是 | |
CLS_SECRET_ID | 是 | 子账号 SecretId |
CLS_SECRET_KEY | 是 | 子账号 SecretKey |
CLS_SYNC_ENABLED | 否 | 是否开启自动同步,开启后可自动将日志主题添加到 Kibana Index Pattern 中 默认 false,不开启自动同步,开启需要配置 true |
CLS_MAX_INDEX_PATTERNS | 否 | Kibana 中 IndexPattern 最大数量,默认 1000,超出后不再自动新增 Index Pattern |
CLS_SYNC_FILTERS | 否 | 开启自动同步时,将满足筛选条件的日志主题同步至 Kibana Index Pattern 中 空/不配置:不同步任何日志主题 * :同步所有日志主题 筛选条件:使用 json 字符串设定筛选条件,支持的筛选条件参见 获取主题列表 API 中的 Filters 参数,例如 '{"logsetName": ["logset-dev"]}' |
LOG_LEVEL | 否 | 日志级别:DEBUG、INFO、WARN, 默认 INFO |
PROXY_AUTH | 否 | Proxy 是否开启认证,默认 true |
CLS_ES_ENDPOINT | 否 | 日志服务 Elasticsearch 兼容接口地址,默认为外网地址。 外网地址:https://${region}.cls.tencentcs.com 内网地址:https://${region}.cls.tencentyun.com |
CLS_API_ENDPOINT | 否 | 日志服务 API 地址,默认为外网地址。 外网地址:https://cls.tencentcloudapi.com(仅支持非金融区) 内网地址:https://cls.internal.tencentcloudapi.com |
注意:
有多个地域或者账号时,在对应变量名后增加
_{自增 id},例如 CLS_REGION_1、CLS_REGION_2。3. 部署 Kibana。
3.1 创建 Kibana 配置文件。
cat > ./kibana.yml << 'EOF'server.host: "0.0.0.0"# Elasticsearch 配置elasticsearch.hosts: ["{proxy_address}"]elasticsearch.username: "{es_user}"elasticsearch.password: "{es_password}"elasticsearch.shardTimeout: 30sxpack.security.enabled: truexpack.data_enhanced.enabled: falseEOF
{proxy_address}:Proxy 访问地址,格式为
http://ip:port。{es_user}:ES(迷你集群)访问用户名,默认为 elastic。
{es_password}:ES(迷你集群)访问密码。
3.2 启动 Kibana。
docker run -d \\--name kibana-7.10.2 \\-p 5601:5601 \\-v ./kibana.yml:/usr/share/kibana/config/kibana.yml:ro \\docker.elastic.co/kibana/kibana:7.10.2
1. 创建配置文件
values.yaml,内容如下。请替换其中的{es_password}为您需要设定的 ES 访问密码,替换其中的{region}为日志主题所属地域,替换{SECRET_ID}、{SECRET_KEY}为子账户密钥。elasticsearch:enabled: truepassword: "{es_password}"kibana-proxy:image:tag: "v0.9.0"env:CLS_SYNC_ENABLED: "true"CLS_MAX_INDEX_PATTERNS: "1000"clsRegions:- CLS_REGION: "{region}"CLS_SECRET_ID: "{SECRET_ID}"CLS_SECRET_KEY: "{SECRET_KEY}"CLS_SYNC_FILTERS: '*'
elasticsearch:enabled: truepassword: "{es_password}"kibana-proxy:image:tag: "v0.9.0"env:CLS_SYNC_ENABLED: "true"CLS_MAX_INDEX_PATTERNS: "1000"clsRegions:- CLS_REGION: "{region}" # 多地域/账户配置CLS_SECRET_ID: "{SECRET_ID}"CLS_SECRET_KEY: "{SECRET_KEY}"CLS_SYNC_FILTERS: '*'- CLS_REGION: "{region}" # 多地域/账户配置CLS_SECRET_ID: "{SECRET_ID}"CLS_SECRET_KEY: "{SECRET_KEY}"CLS_SYNC_FILTERS: '*'
变量说明如下:
变量 | 必填 | 说明 |
CLS_REGION | 是 | |
CLS_SECRET_ID | 是 | 子账号 SecretId |
CLS_SECRET_KEY | 是 | 子账号 SecretKey |
CLS_SYNC_ENABLED | 否 | 是否开启自动同步,开启后可自动将日志主题添加到 Kibana Index Pattern 中。 默认 false,不开启自动同步,开启需要配置 true |
CLS_MAX_INDEX_PATTERNS | 否 | Kibana 中 IndexPattern 最大数量,默认 1000,超出后不再自动新增 Index Pattern |
CLS_SYNC_FILTERS | 否 | 开启自动同步时,将满足筛选条件的日志主题同步至 Kibana Index Pattern 中。 空/不配置:不同步任何日志主题 * :同步所有日志主题 筛选条件:使用 json 字符串设定筛选条件,支持的筛选条件参见 获取主题列表 API 中的 Filters 参数,例如 '{"logsetName": ["logset-dev"]}' |
CLS_ES_ENDPOINT | 否 | 日志服务 Elasticsearch 兼容接口地址,默认为外网地址。 外网地址:https://${region}.cls.tencentcs.com 内网地址:https://${region}.cls.tencentyun.com |
CLS_API_ENDPOINT | 否 | 日志服务 API 地址,默认为外网地址。 外网地址:https://cls.tencentcloudapi.com(仅支持非金融区) 内网地址:https://cls.internal.tencentcloudapi.com |
说明:
2. 在容器服务 TKE 集群中执行如下命令。
helm install cls-kibana-proxy-stack https://cls-kibana-proxy-1254077820.cos.ap-guangzhou.myqcloud.com/cls-kibana-proxy-stack-0.0.1.tgz -f values.yaml -n cls --create-namespace
3. 等待部署完成后,根据您的集群环境,启用 Kibana 服务外部访问。
步骤3:在 Kibana 中创建 Index pattern
说明:
如果在 Proxy 配置中已经启用了自动同步,CLS_SYNC_ENABLED=true,无需再执行本步骤。
1. 打开浏览器,访问 Kibana 地址(例如:http://<your-kibana-host>:5601)。
2. 输入用户名和密码登录。
3. 单击左侧导航栏的 Stack Management。
4. 在左侧菜单中找到 Kibana 分类,单击 Index Patterns。
5. 单击页面右上角的 Create index pattern。
6. 在 Index pattern name 输入框中输入要查询的日志主题 ID,Timestamp field 选择 @timestamp。
7. 单击 Create index pattern 按钮完成创建。
步骤4:在 Kibana 中查询日志
1. 单击左侧导航菜单按钮,打开导航栏,单击 Discover。
2. 在左侧选择上一步中创建的 Index pattern,开始查询日志。
文档反馈