安全概览
Download
聚焦模式
字号
本文将为您介绍安全概览页的功能和操作。
概述
安全概览是主机安全的首页,实时展示您的主机安全评分、待处理风险、安全防护状态、风险趋势以及主机安全的实时动态;推送安全播报,方便您了解主机安全最新威胁情报;提供帮助文档和服务建议,帮助您抵御黑客入侵及攻击威胁,保障企业主机安全。
操作指南
安全状态
1. 在安全状态区域中,可查看安全评分结果和风险情况,并提供快捷处理入口。

安全评分:基于安全事件的威胁等级和事件数量两个维度进行综合评分,具体评分标准请参见 安全评分说明。
风险情况:划分为入侵检测、漏洞风险、基线风险三类,统计并展示待处理风险数和受影响主机数。
入侵检测:包含文件查杀、异常登录、密码破解、恶意请求、反弹 Shell、本地提权、高危命令。
漏洞风险:包含漏洞管理中的Linux 软件漏洞、Windows 系统漏洞、Web-CMS 漏洞、应用漏洞。
基线风险:仅含基线管理。
网络风险:统计攻击事件待处理风险数和受影响主机数。
2. 单击立即处理,将打开风险处理详情弹框,可以查看入侵检测、漏洞风险、基线风险和网络风险具体详情。单击对应风险卡片,页面将跳转至相对应的风险处理界面。
主机安全状态划分为3个等级:
等级 | 体检评分 | 字体颜色 | 状态说明 |
优 | 90分 - 100分 | 绿色 | 资产安全状态较好,需继续保持,定期巡检。 |
中危 | 60分 - 89分 | 橙色 | 资产存在较多安全风险,建议您及时处理安全事件。 |
高危 | 20分 - 59分 | 红色 | 资产存在严重安全风险,请您尽快处理安全事件。 |
说明:
主机安全状态体检评分最低分数为 20分。
按安全事件分类计算扣分项,安全事件等级分类及扣分规则:
等级 | 安全事件(按事件数计算) | 扣分/个 | 叠加最大扣分 |
严重 | 木马文件、暴破成功、恶意请求 | -40分 | -50分 |
高危 | 严重漏洞、高危漏洞、严重基线、高危基线、异常登录(高危)、本地提权、反弹 Shell | -10分 | -20分 |
中危 | 中危漏洞、中危基线 | -3分 | -10分 |
低危 | 低危漏洞、低危基线 | -2分 | -5分 |
其他 | 基础版防护、未安装主机安全客户端 | -1分 | -5分 |
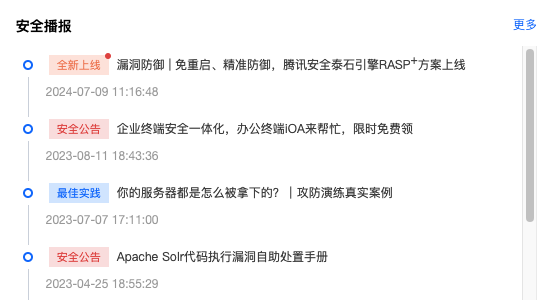
安全播报
在安全播报区域中,将展示功能更新、行业荣誉、紧急通知和版本发布信息的播报内容。
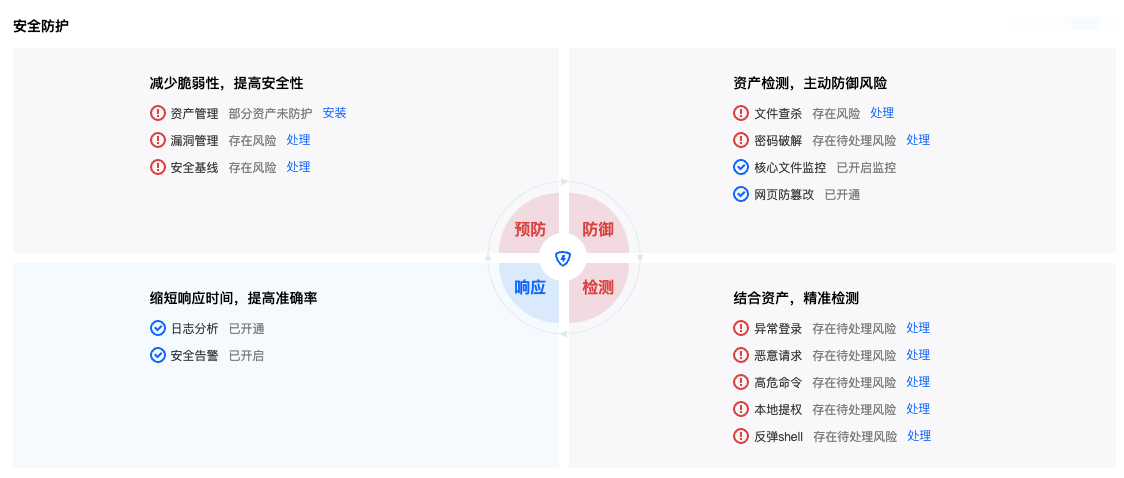
安全防护
在安全防护区域中,展示了主机安全应对入侵所提供的全流程解决方案(预防-防御-检测-响应),明确了各流程所需的安全防护项。
若各防护项均开启,可直观了解您当前主机安全的情况,并提供安全风险快捷处理入口。
防护详情
在防护详情区域中,展示了主机安全各项服务的使用情况统计。
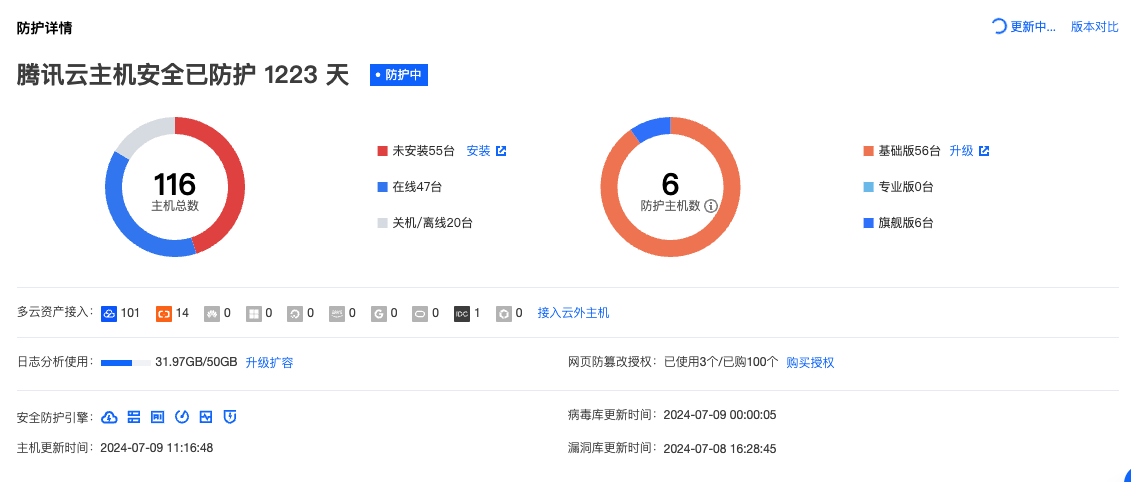
防护天数:指服务器安装主机安全客户端的时间并集。
主机总数:指腾讯云服务器(云服务器、轻量应用服务器、黑石物理服务器1.0、边缘计算机器)及非腾讯云服务器的总数。
防护主机数:由于基础版防护程度相对较弱,防护主机数仅包含专业版、旗舰版防护的主机。
安全防护引擎:若您已购买专业版/旗舰版防护授权,将自动开启6个防护引擎:查杀引擎、BinaryAI 引擎、TAV 引擎、异常行为、威胁情报、攻击防御。
病毒库更新时间:每日零点自动更新病毒库。
主机更新时间:可点击右上角立即更新,可手动更新主机列表信息。
漏洞库更新时间:不定时更新。
风险趋势
在风险趋势区域中,各项风险数的统计通过折线图展示,直观呈现了主机的风险趋势。
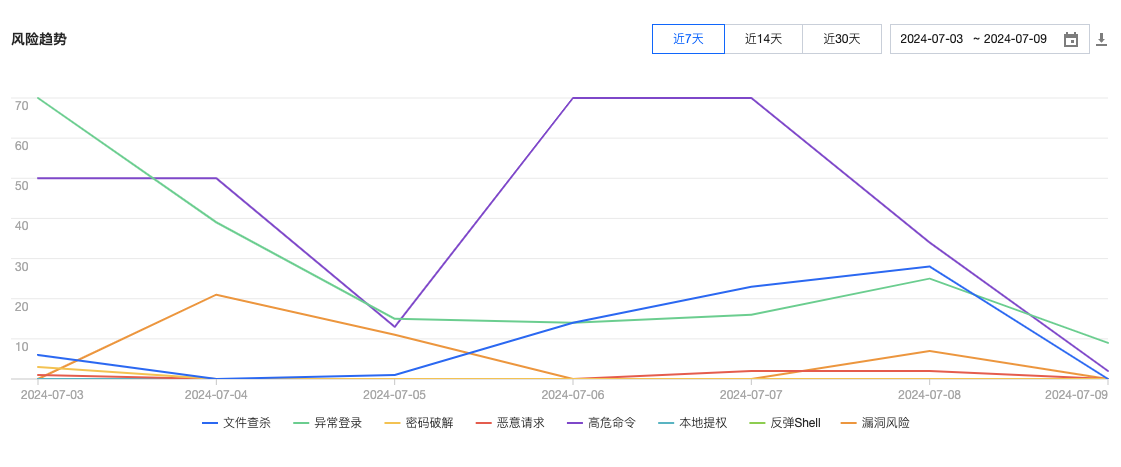
支持筛选近7天、近14天、近30天或自定义时间段查看,单击下载,将导出所选时间段内的各项风险数。
说明:
风险数为当日新增待处理事件数,每小时更新一次。
实时动态
在实时动态区域中,将实时展示最新发现的安全事件。
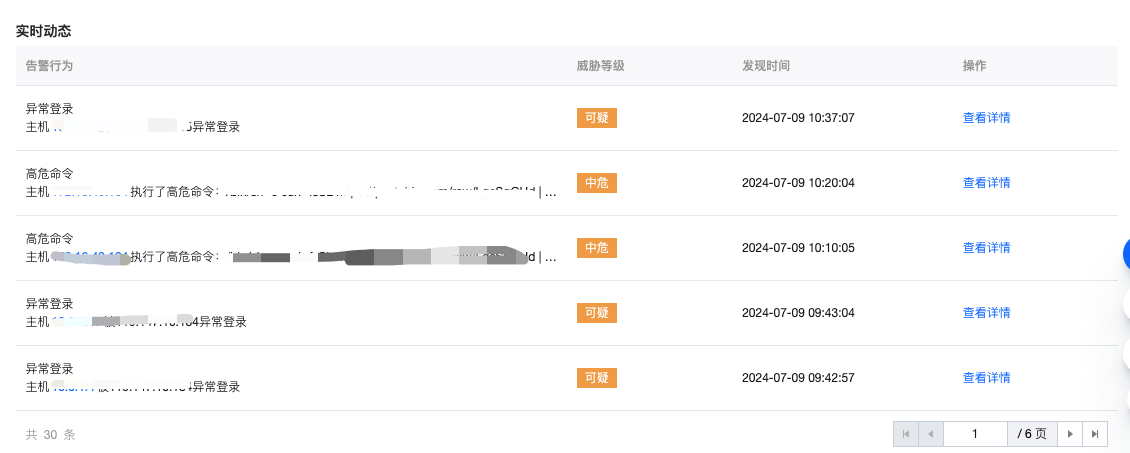
单击主机 IP 或查看详情,将跳转至该主机详情页对应风险项处。
文档反馈