Page View
다운로드
포커스 모드
폰트 크기
This document provides an overview of the Page View monitoring module for the React Native platform and explains how to use its features. For detailed information, refer to the React Native Integration Guide.
Filter region
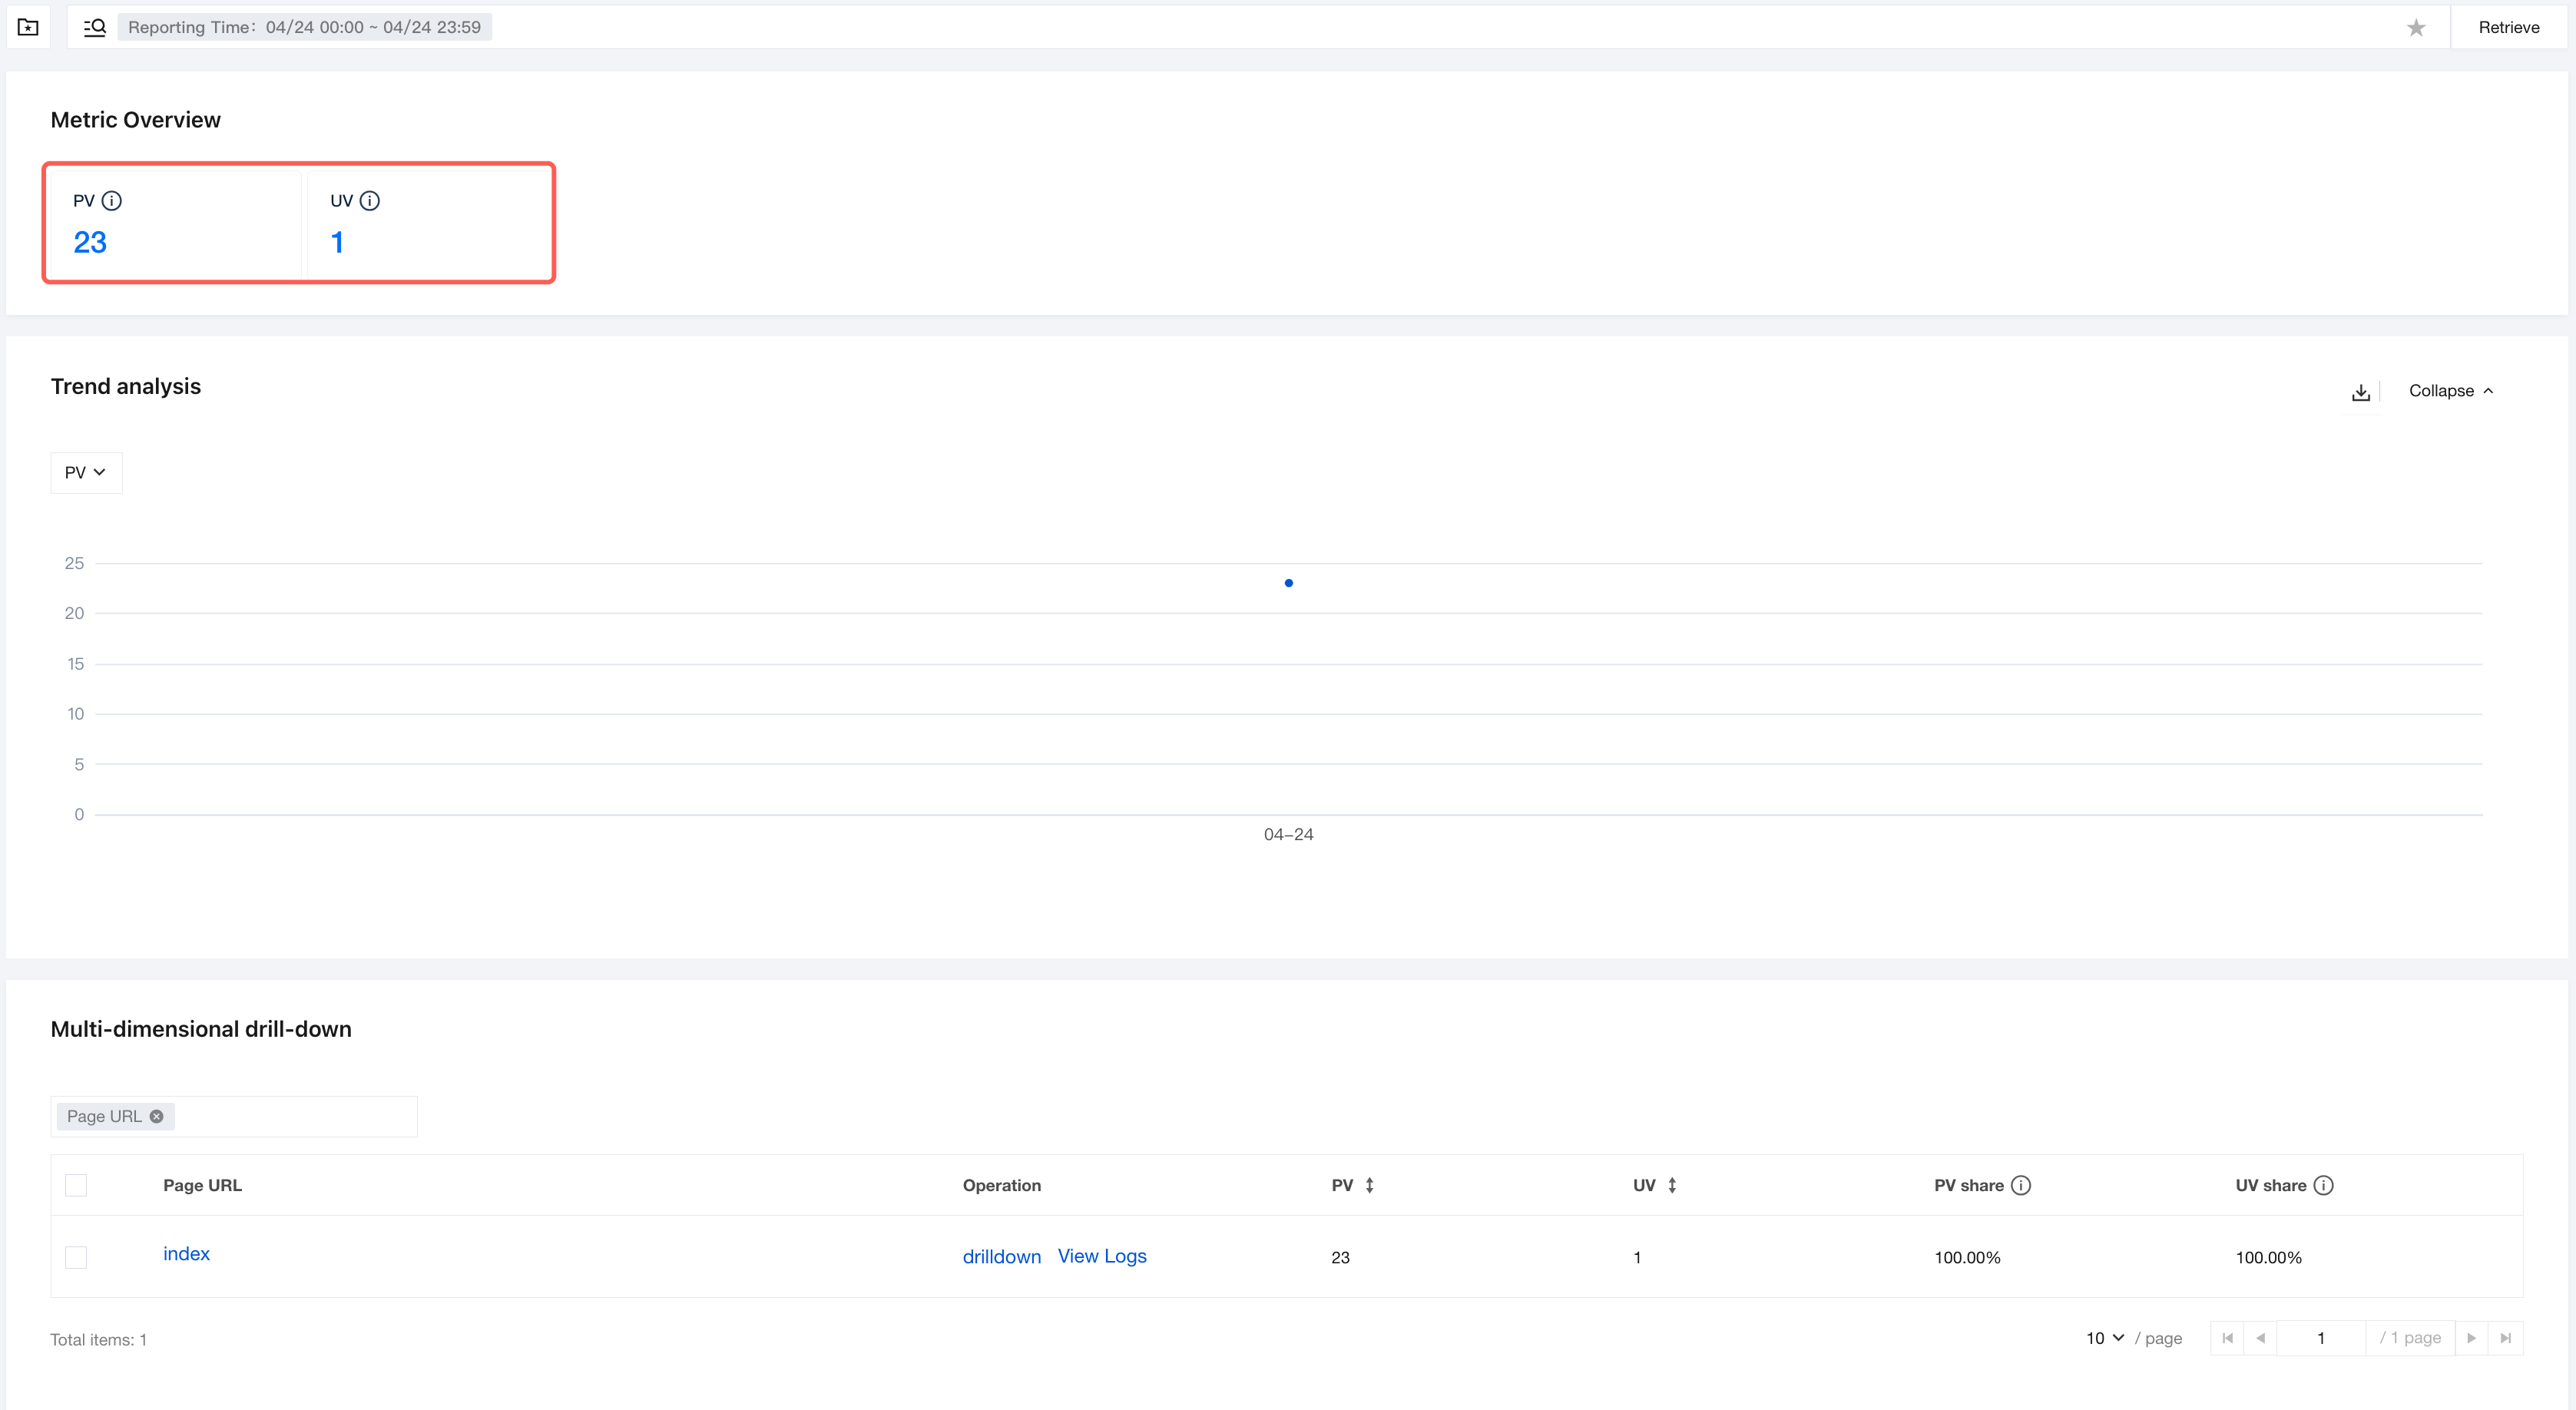
Metrics Overview
Displaying core summary metrics for page view.
PV (Page Views): The total number of page views.
UV (Unique Visitors): The number of unique users accessing the page.
Trend analysis
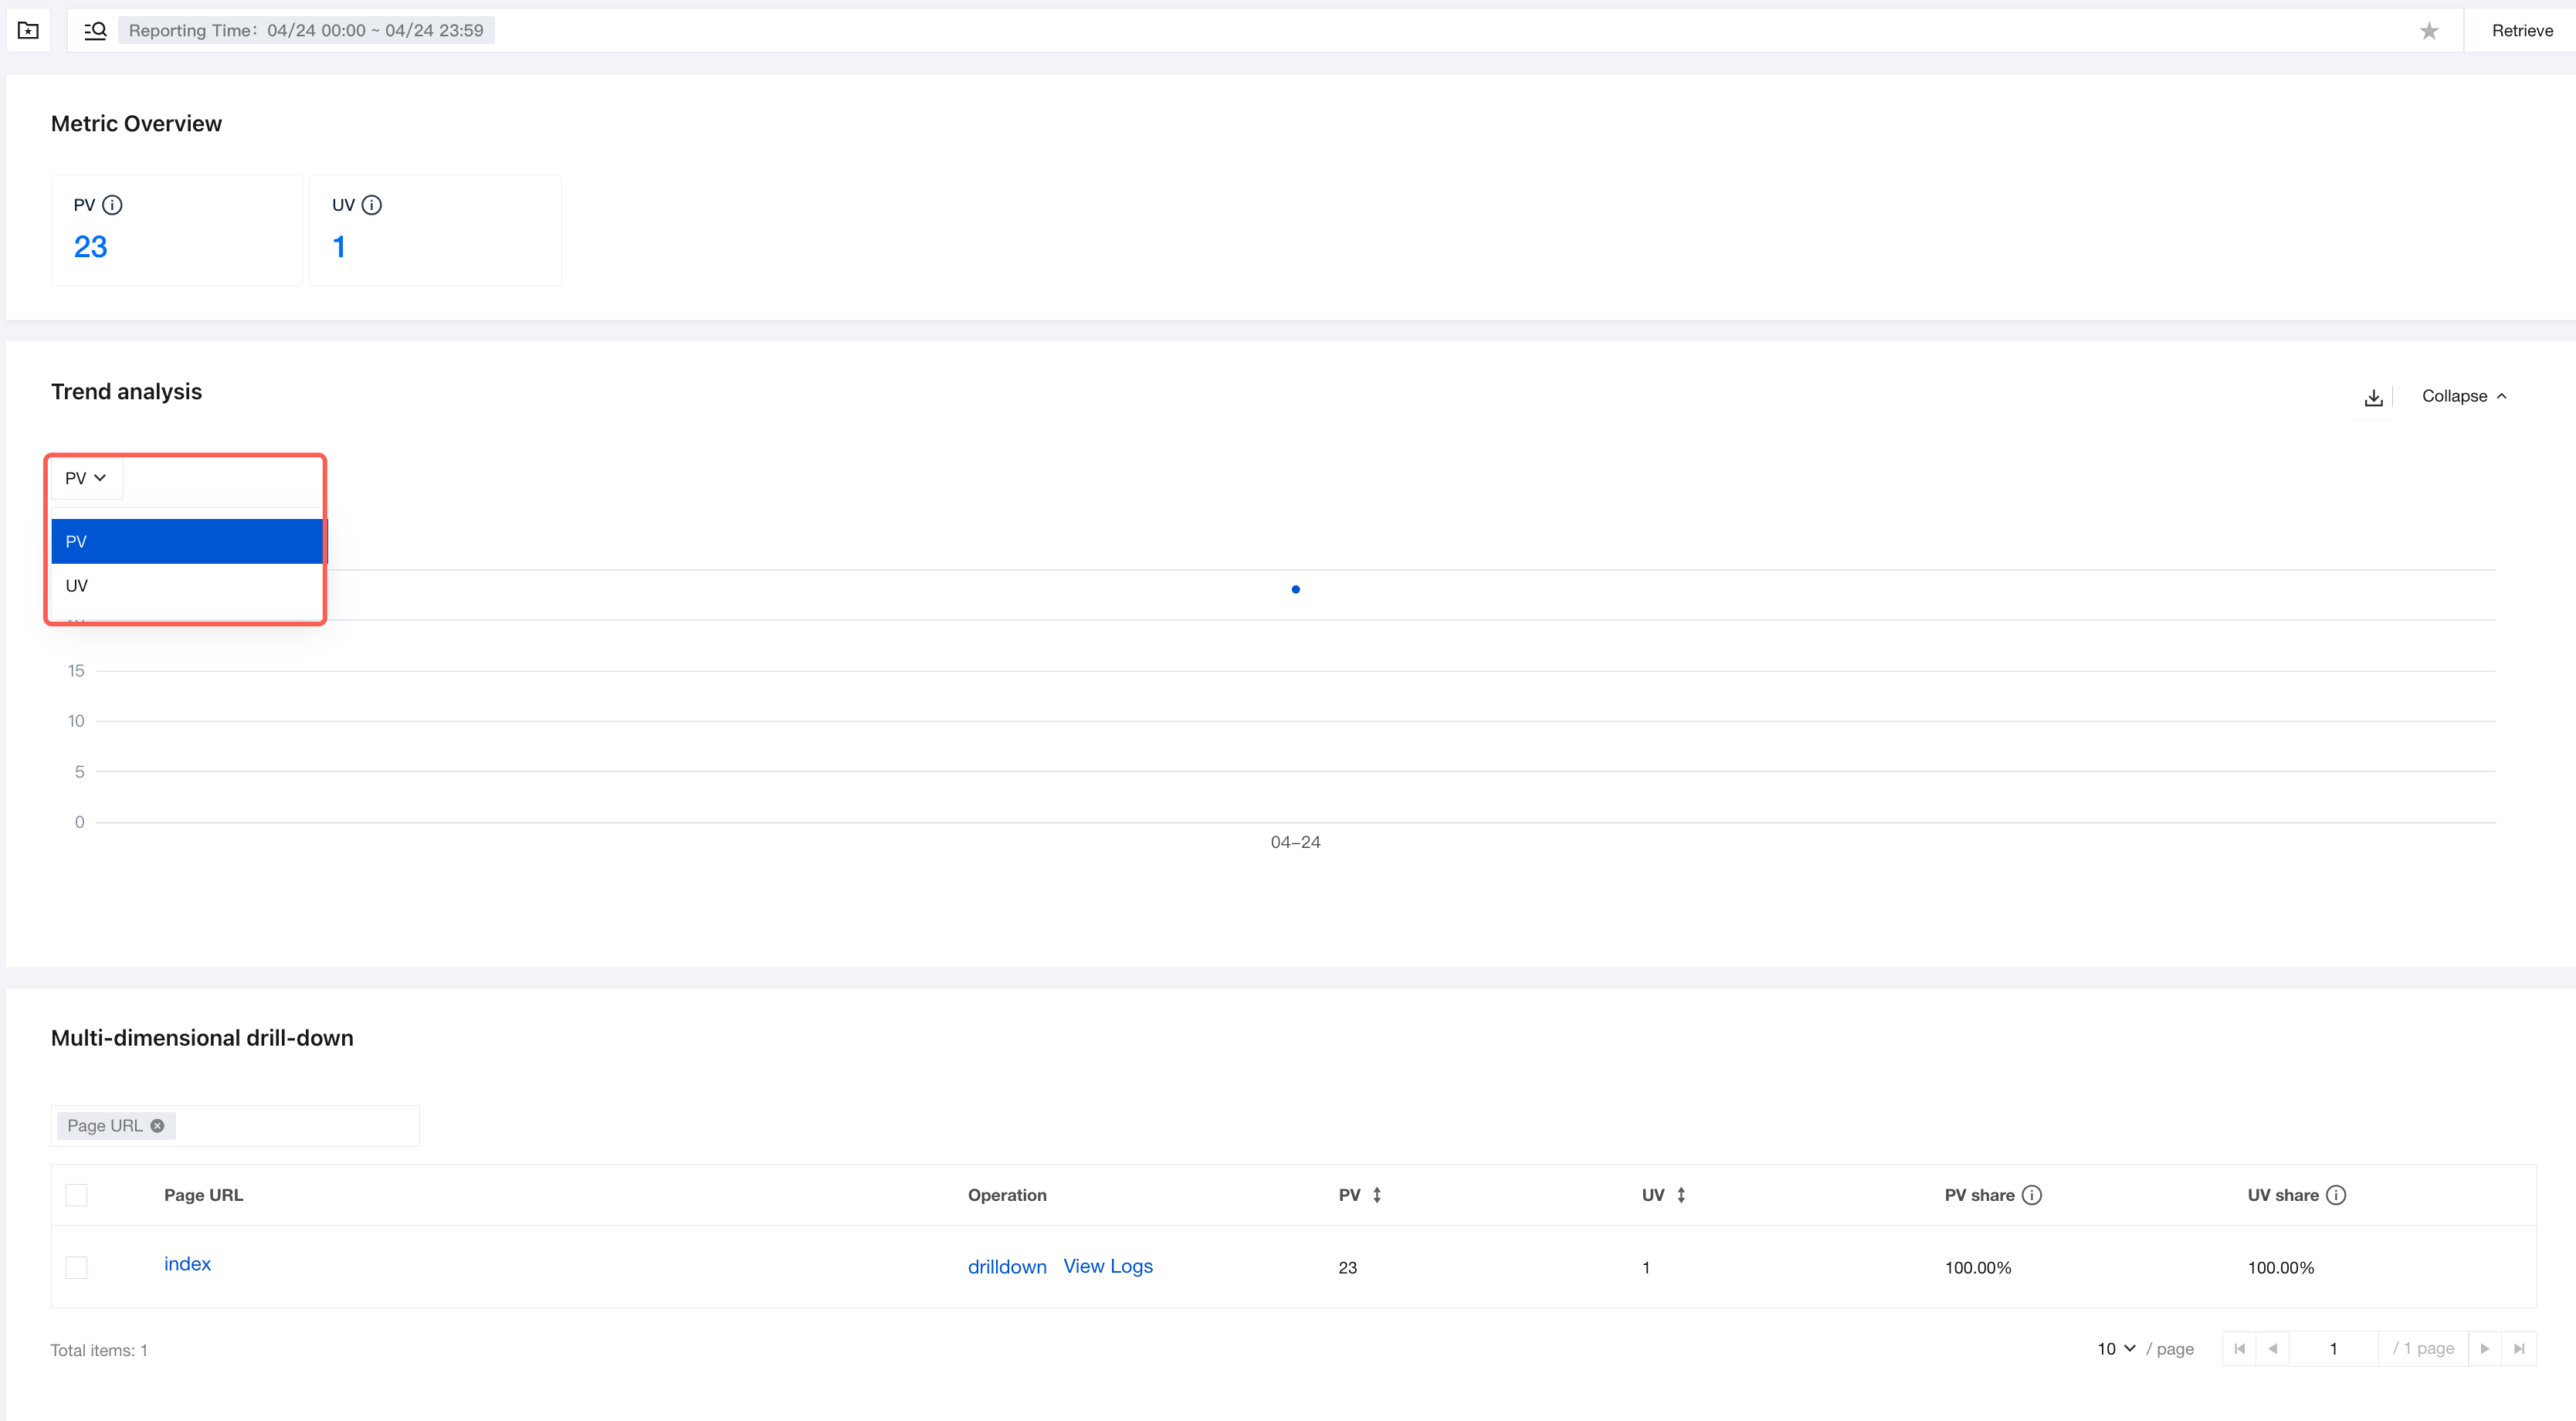
Displaying the time trends of PV (Page Views) and UV (Unique Visitors) to facilitate observation of traffic pattern changes.
Metric Switching: The left dropdown can switch the display of PV or UV trends.
Line Chart Description: The chart displays the numerical changes of the corresponding metric over the time axis (the current example shows the trend of PV), enabling intuitive identification of peak/off-peak traffic periods.
Click the Download icon on the right to export trend analysis data within the current time range.
Supports clicking Collapse and Expand to adjust the display state of the module.
Multi-dimensional drill-down
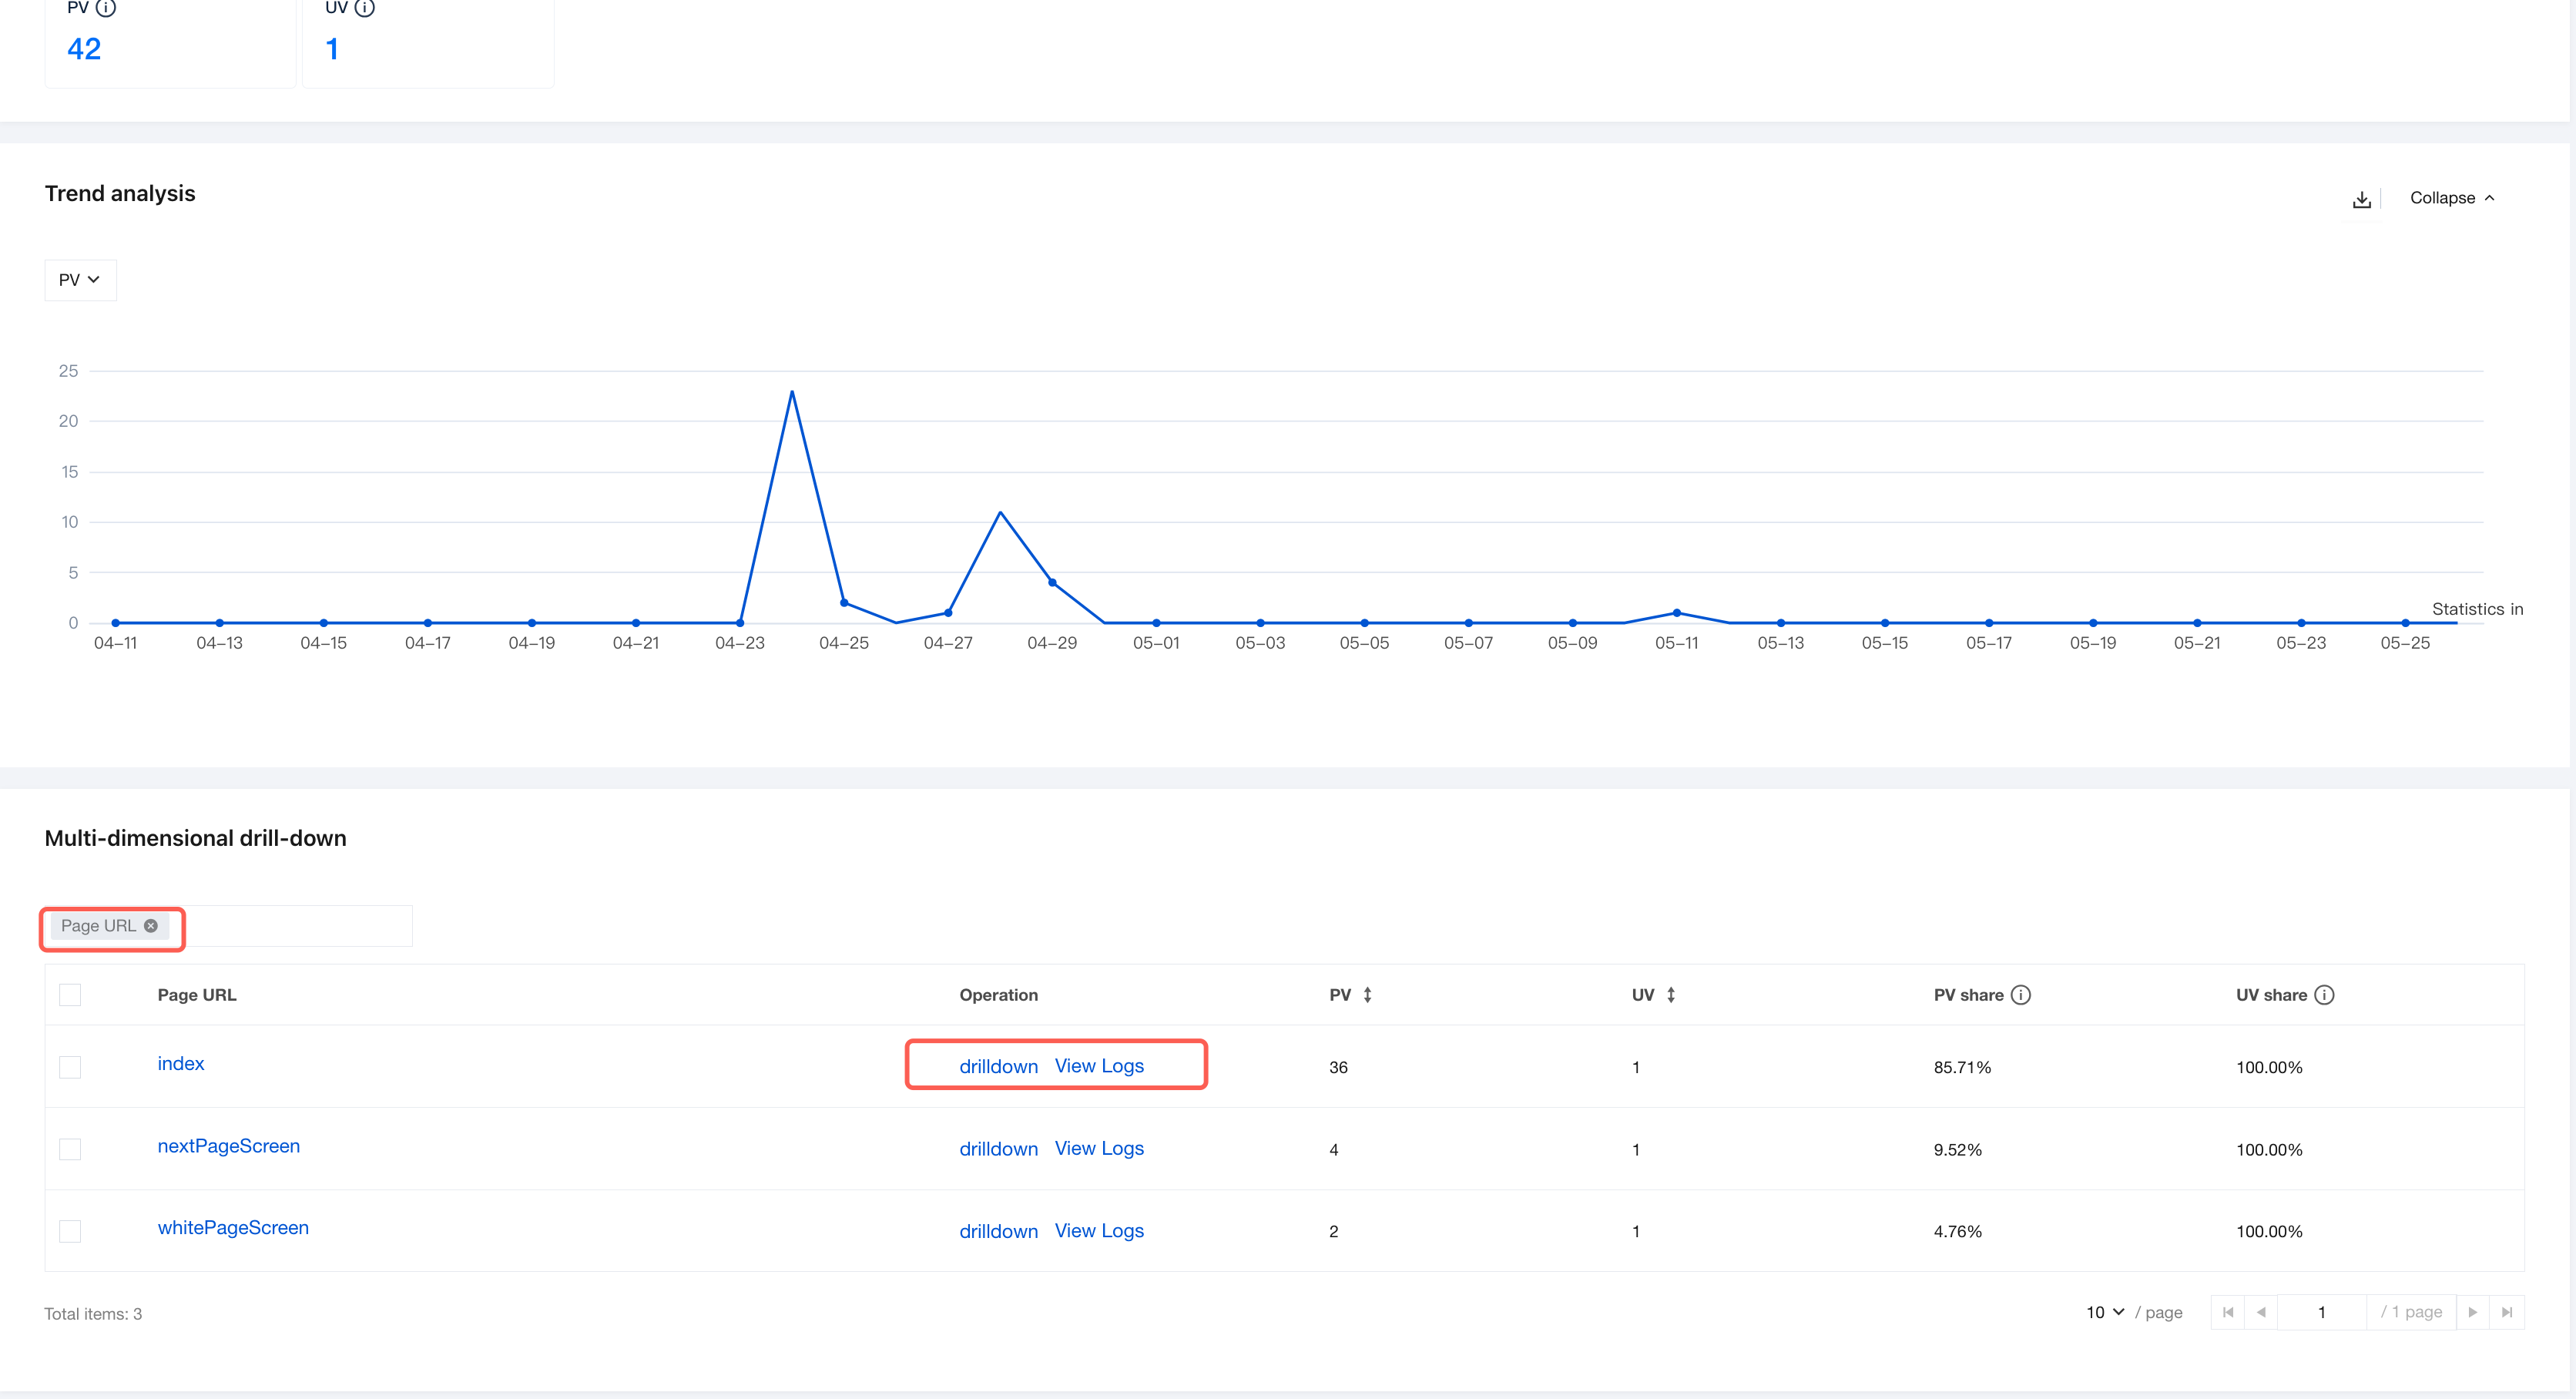
This section displays detailed data for specific page URLs, supporting granular viewing.
Page URL: Displays the specific address of the page.
Operation Bar: Supports drilldown and View Logs.
drilldown: View data at a more granular dimension.
View Logs: View API request logs.
Statistical Fields: Include PV, UV, PV share, and UV share.
피드백