Exception Monitoring
Download
Focus Mode
Font Size
This document describes how to view and analyze an application exception.
Prerequisites
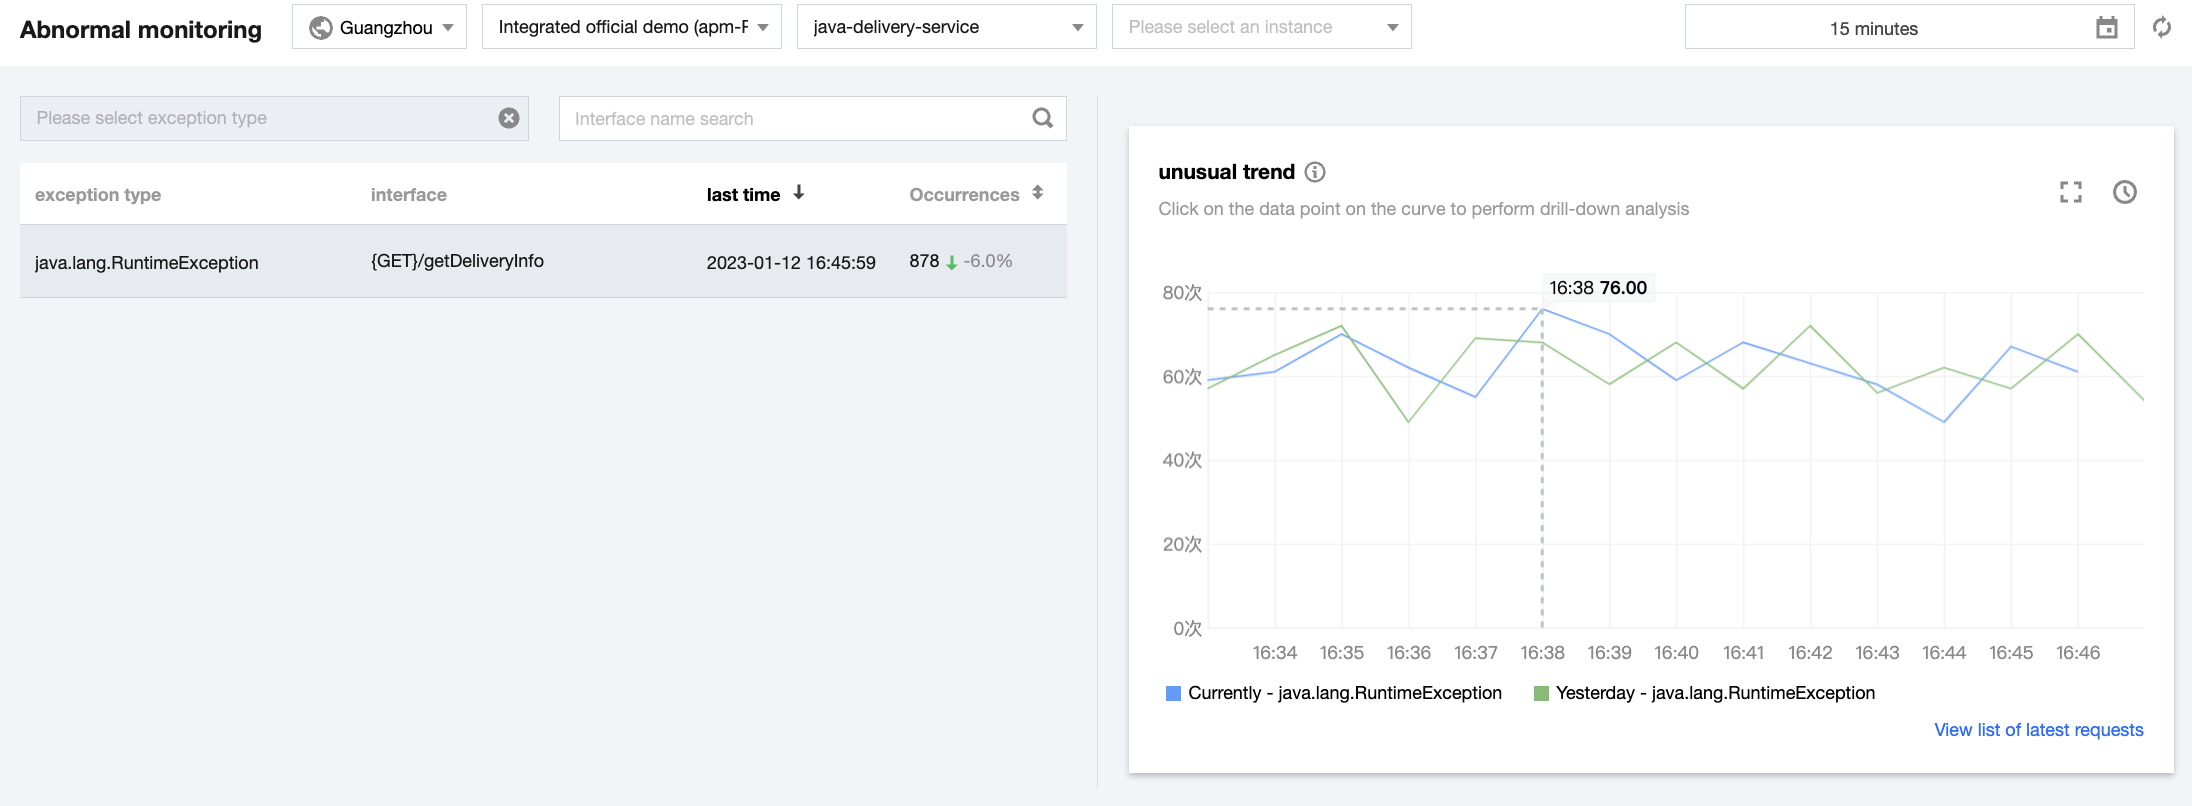
Exception list
It displays all exceptions within the specified time range on the left of the Exception monitoring page, including the service exception type, API, and number of occurrences.
Exception trend
The chart on the right displays the exception trend, i.e., number of exception occurrences per minute.
Exception analysis
Click the target application. Then, the number of occurrences of the exception and day-over-day comparison will be displayed as curves on the right of the Exception monitoring page.
Note:
You can click Select comparison curve above the chart to add a month-over-month comparison curve. You can also click a data point in the curve to view the list of related requests. In the list, click Request details to drill down to call trace details for exception analysis.
Help and Support
Was this page helpful?
You can also Contact sales or Submit a Ticket for help.
Help us improve! Rate your documentation experience in 5 mins.
Feedback