In data analysis scenarios, you may need to view chart data values to help you understand the business situation. Follow the steps below to view the chart data:
1. Go to the project: Log in to the BI Console, then go to My Project.
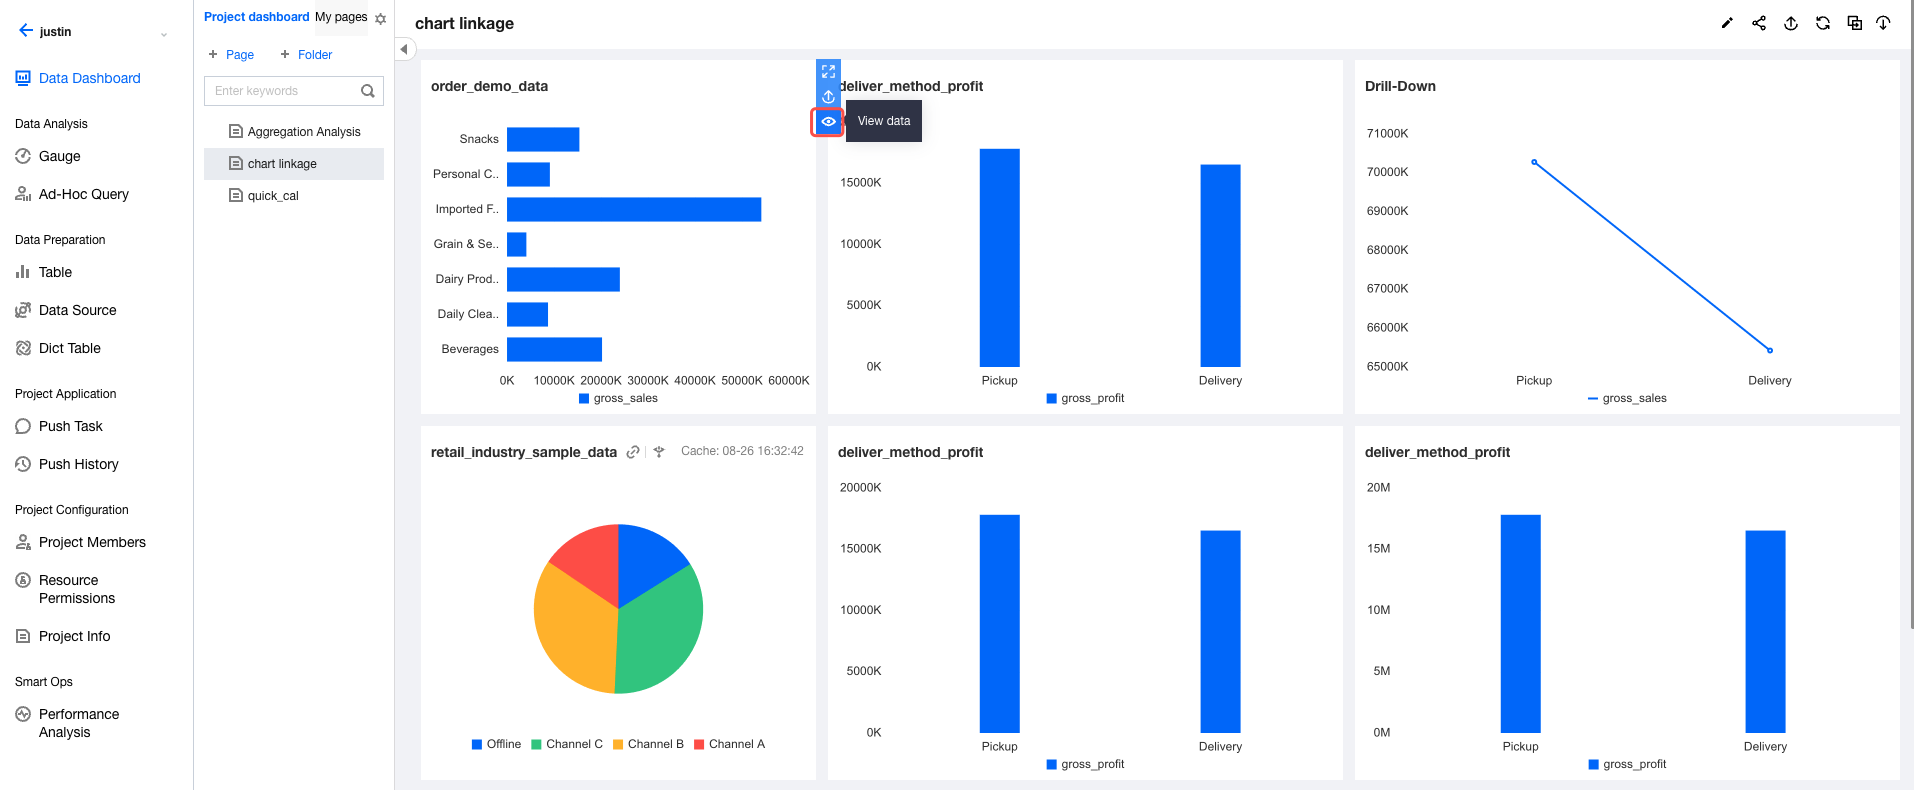
2. Go to the project dashboard: Select a project, then go to Dashboard. Select the page where the chart is located.
3. Open the page, swipe over the component, and select View from the component toolbar.
4.
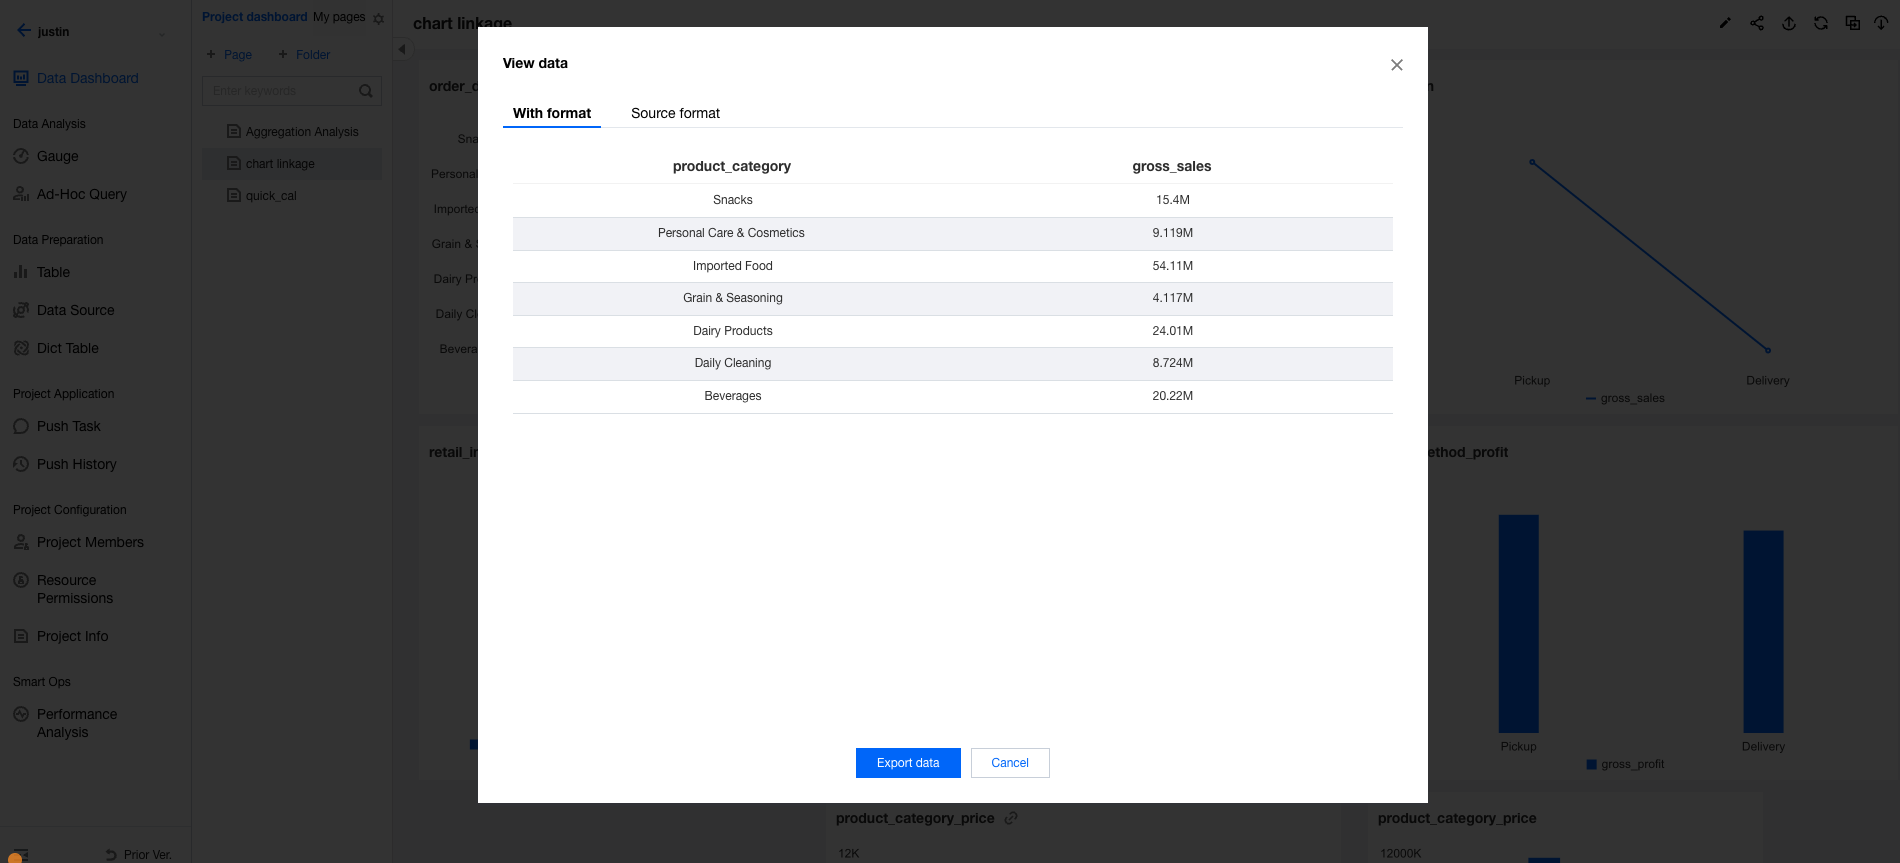
5. In the pop-up layer, users can view the chart result data and can also export the data.
6.
Note
1. Viewing chart data is only supported for chart components.
2. The viewed chart data is analysis result data, not raw data.
3. The chart data viewing feature takes effect after the page is released.