Data Lake Compute (DLC) provides monitoring services for data engines based on the Tencent Cloud Observability Platform (TCOP), ensuring you can understand the real-time status of data engines and configure data alarms. For alarm configuration methods, see Monitoring Alarm Configuration. Usage Notice
Before using the Data Lake Compute (DLC) monitoring service, you need to activate the TCOP service. If this service is not yet activated, you can use the root account to activate it.
The use of the TCOP service may incur related charges. For detailed pricing information, see Billing Overview. Monitoring Access
Access Point I: Data Lake Compute (DLC) Console
Note:
The account must have monitoring permissions for the data engine.
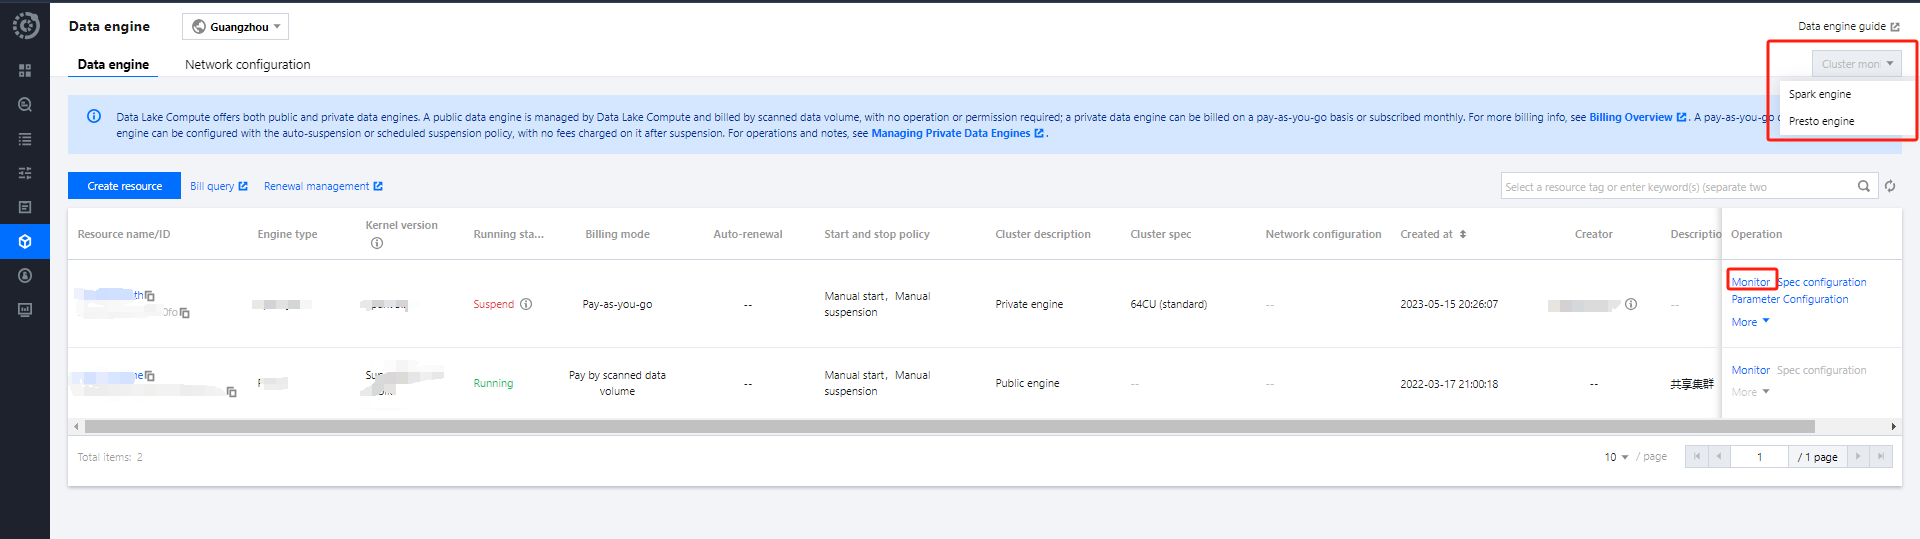
1. Log in to the DLC console and select the service region. 2. Navigate to the SuperSQL engine page from the left menu.
3. Viewing methods supported:
Method 1: Select the engine type to enter the matching engine monitoring list.
Method 2: Select the target engine from the engine list and click Monitoring to view the target engine monitoring.
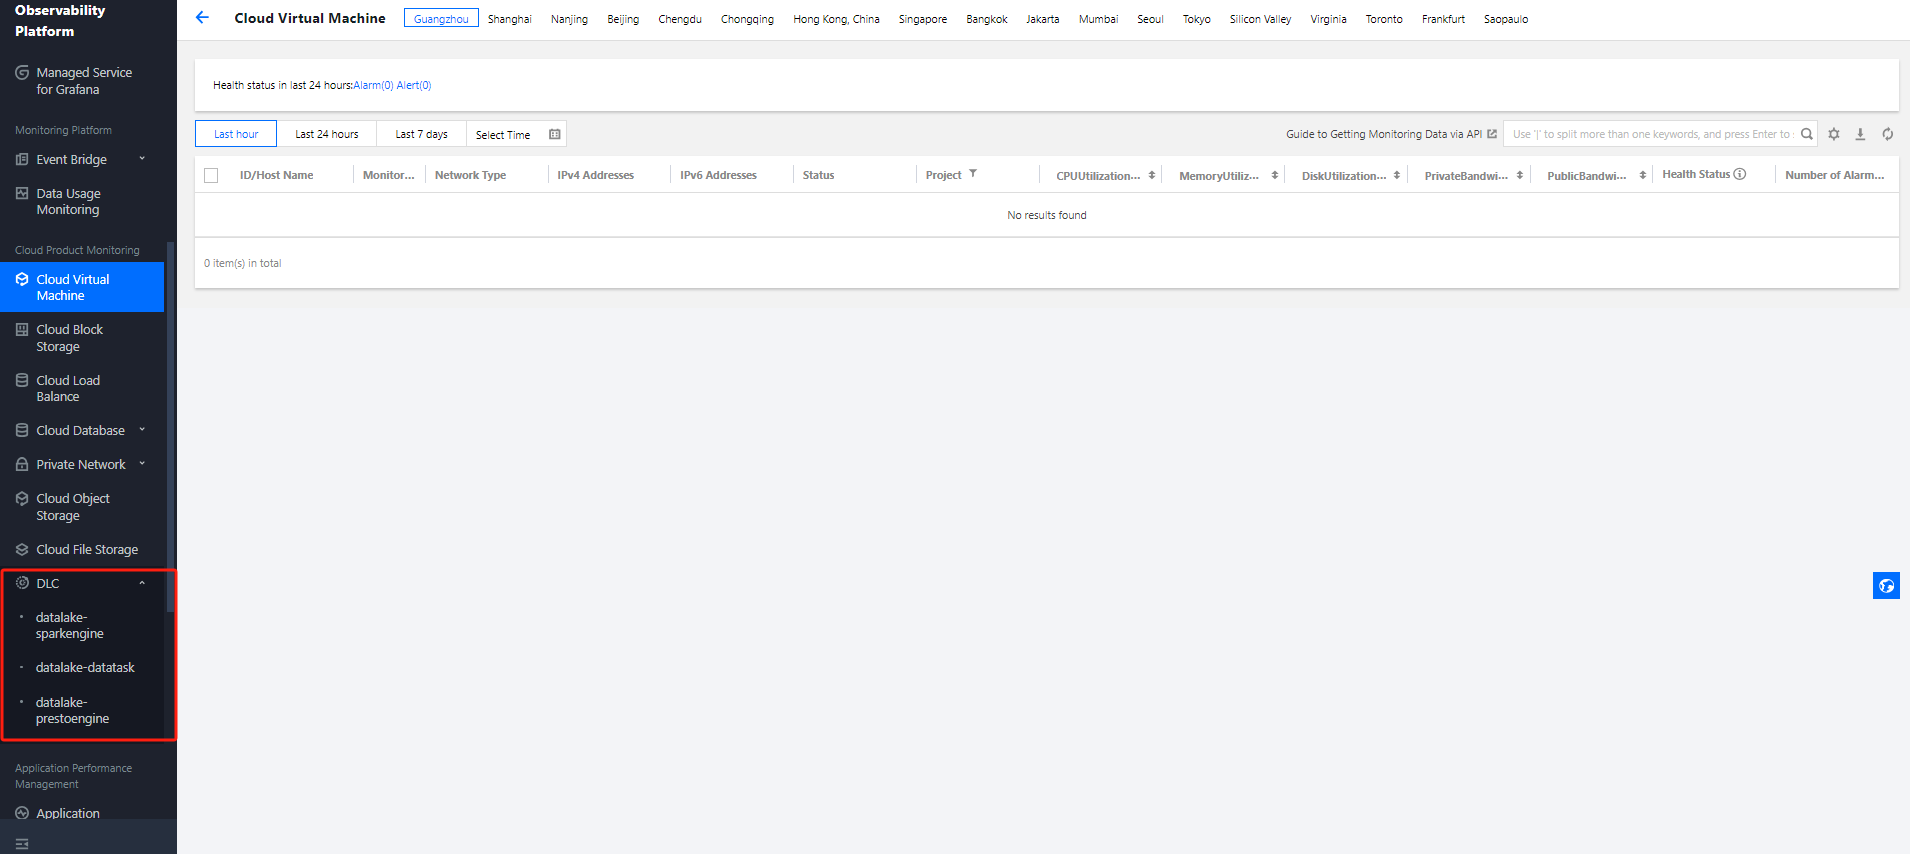
Access Point Two: TCOP
1. Log in to the TCOP with an account that has the necessary permissions. 2. Select Cloud Product Monitoring from the left menu, find Data Lake Compute DLC, and choose the type of monitoring you need to view.
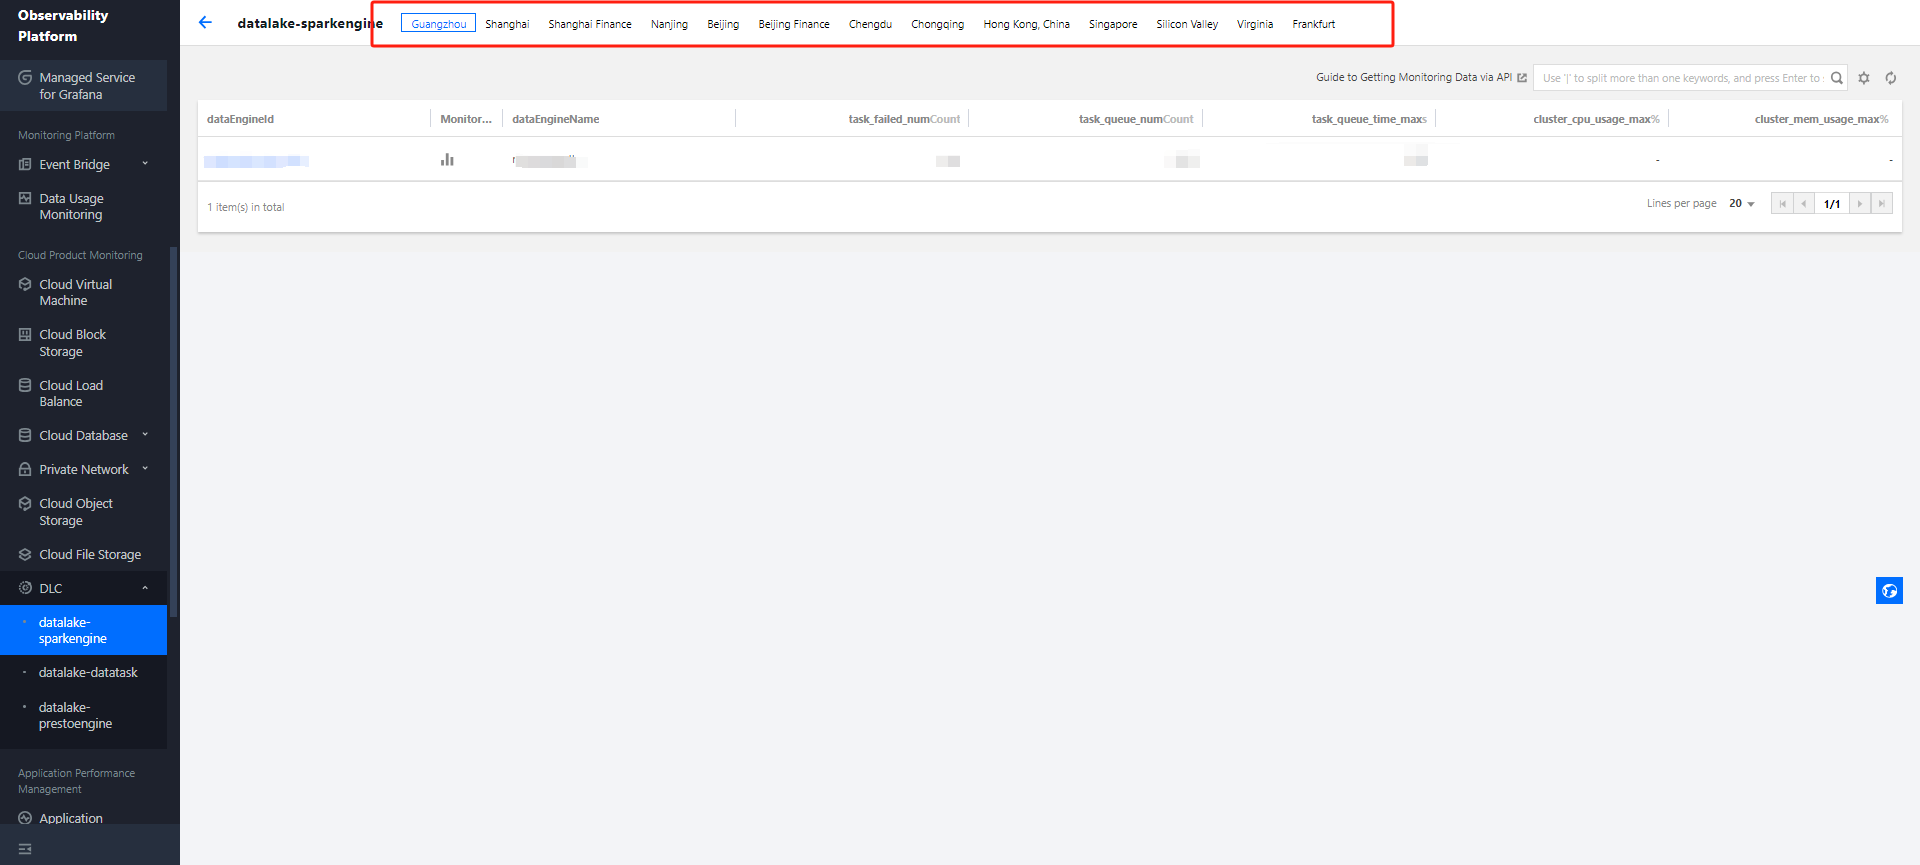
3. After selecting the monitoring type, you will enter the monitoring page. Select the corresponding region to view the monitoring resource information for that region.
4. Click the Engine ID to enter the detailed monitoring page.
Monitoring Granularity Configuration
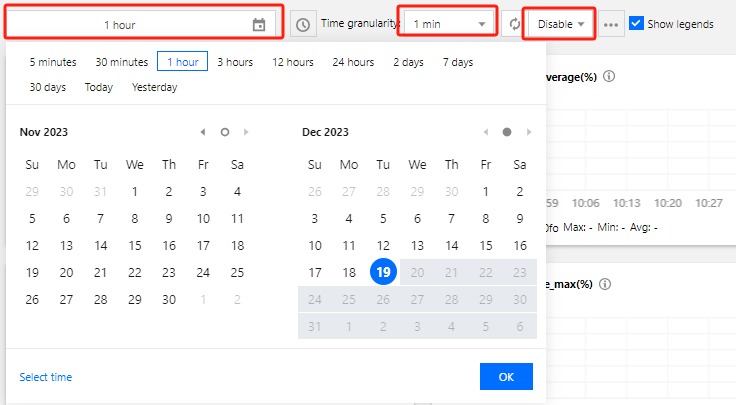
You can configure the monitoring data time range, time granularity, and auto-update interval at the top of the monitoring page.
Monitoring data time range: Accurate to the minute, supports selecting data for a specific time period.
Time granularity: Interval between monitoring points, configurable to 1 minute or 5 minutes.
Auto-update data: Configures the automatic refresh interval for page data, with options to set it to off, 30 seconds, 5 minutes, 30 minutes, or 1 hour.
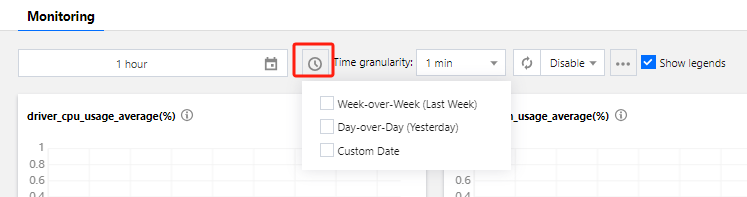
Monitoring Data Comparison
You can select a time period for data comparison. After selecting the comparison time range through one click, you can view the comparison data in the data compass below.
Monitoring Metrics
|
CPU | Maximum CPU utilization of all Driver nodes |
| Maximum CPU utilization of all Executor nodes |
| Average CPU utilization of all Driver nodes |
| Average CPU utilization of all Executor nodes |
| Maximum CPU utilization of all clusters |
| Average CPU utilization of all clusters |
Memory | Maximum memory utilization of all Driver nodes |
| Maximum memory utilization of all Executor nodes |
| Average memory utilization of all Driver nodes |
| Average memory utilization of all Executor nodes |
| Maximum memory utilization of all clusters |
| Average memory utilization of all clusters |
Tasks | Number of canceled tasks |
| Number of failed tasks |
| Number of initialized tasks |
| Average task initialization time |
| Maximum task initialization time |
| Number of queued tasks |
| Average task queue time |
| Maximum task queue time |
| Number of running tasks |
| Number of successful tasks |
Network | Maximum inbound bandwidth of all Driver nodes network |
| Maximum inbound bandwidth of all Executor nodes network |
| Average inbound bandwidth of all Driver nodes network |
| Average inbound bandwidth of all Executor nodes network |
| Maximum outbound bandwidth of all Driver nodes network |
| Maximum outbound bandwidth of all Executor nodes network |
| Average outbound bandwidth of all Driver nodes network |
| Average outbound bandwidth of all Executor nodes network |
Cloud Disk | Maximum cloud disk utilization of all Driver nodes |
| Maximum cloud disk utilization of all Executor nodes |
| Average cloud disk utilization of all Driver nodes |
| Average cloud disk utilization of all Executor nodes |
CU | Job Engine CU Count |
| CU Utilization |