The EdgeOne Performance Monitoring page was discontinued on November 21, 2024. Note that this change does not affect your existing performance monitoring services and data. You can continue to view and use related services on the Tencent Cloud Observability Platform - Real User Monitoring - Application Management page without worrying about service interruption or data loss.
Overview
Real User Monitoring is a feature interconnected with EdgeOne. It provides one-stop frontend monitoring solutions. You only need to install its SDK to your project and complete simple configuration, and then it will take care of the user page quality in an all-around manner by monitoring the page performance and frontend quality in real time, truly enabling cost-effective usage and non-intrusive monitoring.
Note:
RUM provides a free tier of 500,000 reports per day for each application. Reports exceeding the free tier (500,000) will be billed. The fees are not part of your EdgeOne plan but are charged by RUM. For billing details, see Billing Overview.
Use Cases
Page performance analysis: RUM offers metrics such as firstScreenTime, TCP connection establishment duration, time to first byte (TTFB), and SSL handshake duration. In addition, it supports latest Web Vitals standards, Google's webpage loading speed and experience metrics, helping you optimize the user experience in an all-around manner.
User access analysis: RUM displays the business PV/UV and top access metrics of each page. It analyzes the user access data in various dimensions including network, browser, and region, so that you can stay on top of and analyze the user access information.
Static resource speed test: RUM supports different types of resource speed tests on image loading, CDN resource operation, etc., so you can view diverse information such as resources used on a page and loading duration of each resource.
Directions
1. Log in to the EdgeOne console and click Speed Test Tools > Real User Monitoring on the left sidebar.
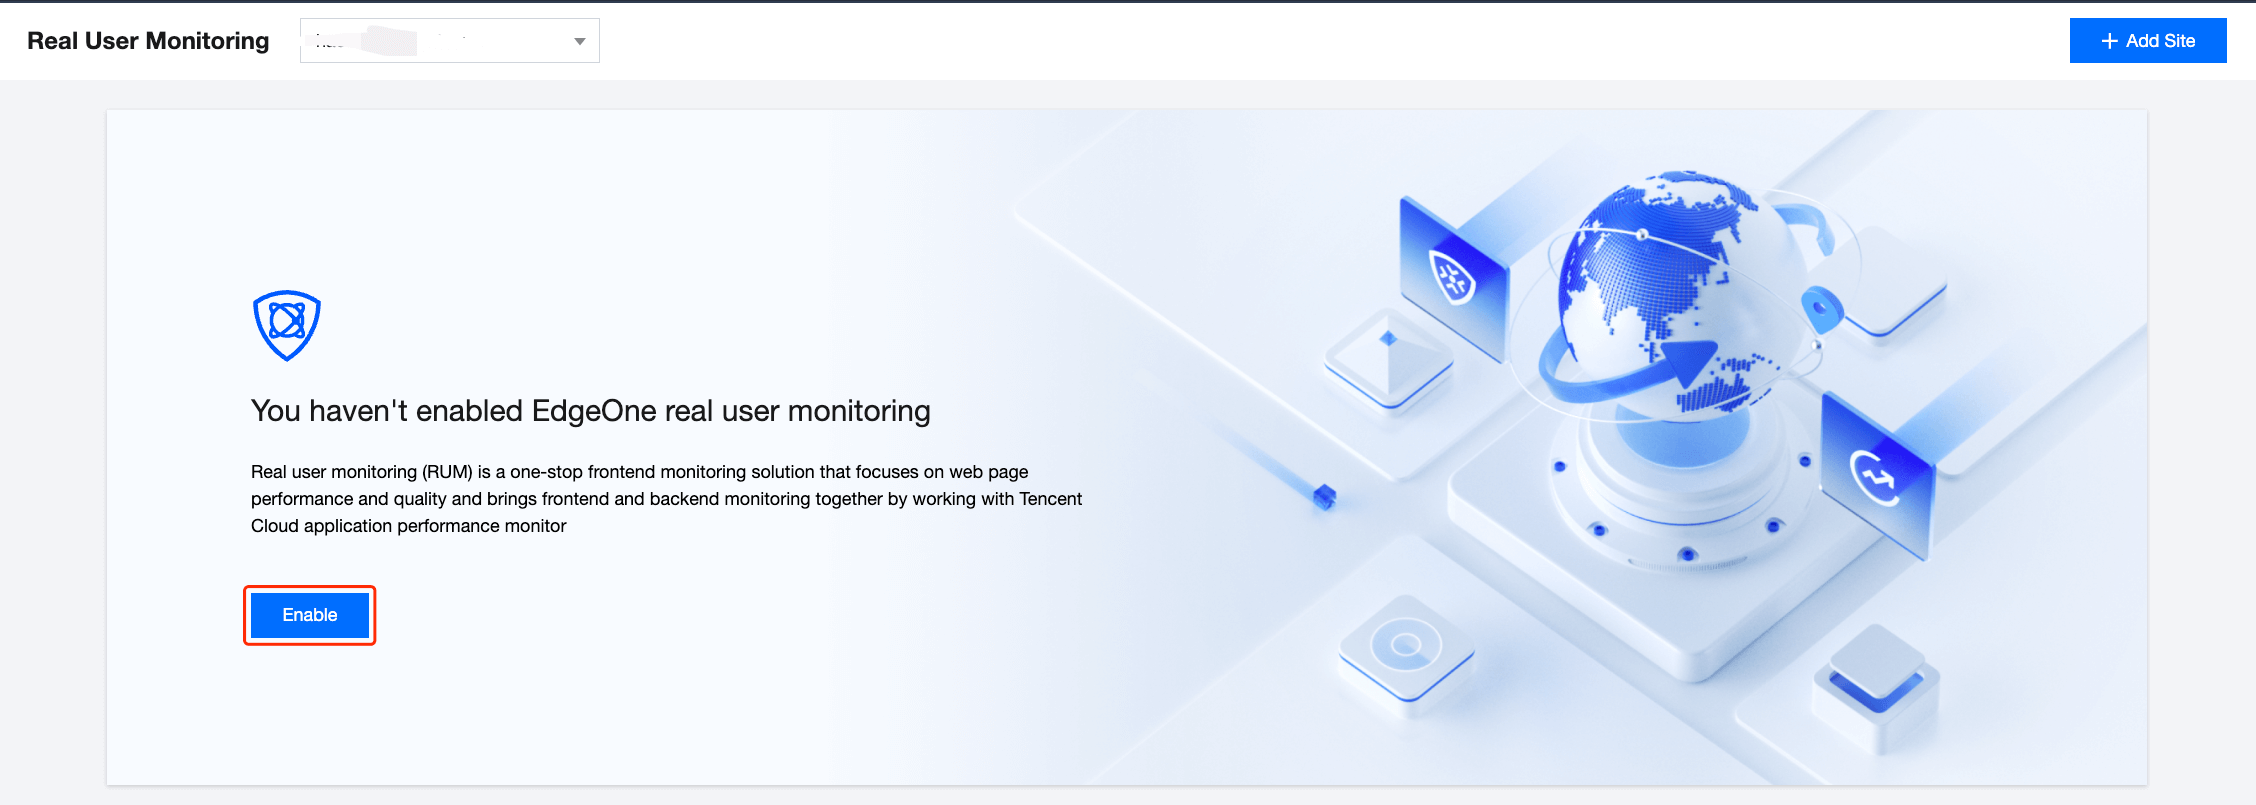
2. If you enter the Real User Monitoring page for the first time, as this feature is based on EdgeOne and RUM, you need to click Enable to grant the relevant permissions.
3. On the Real User Monitoring page, click Application connection.
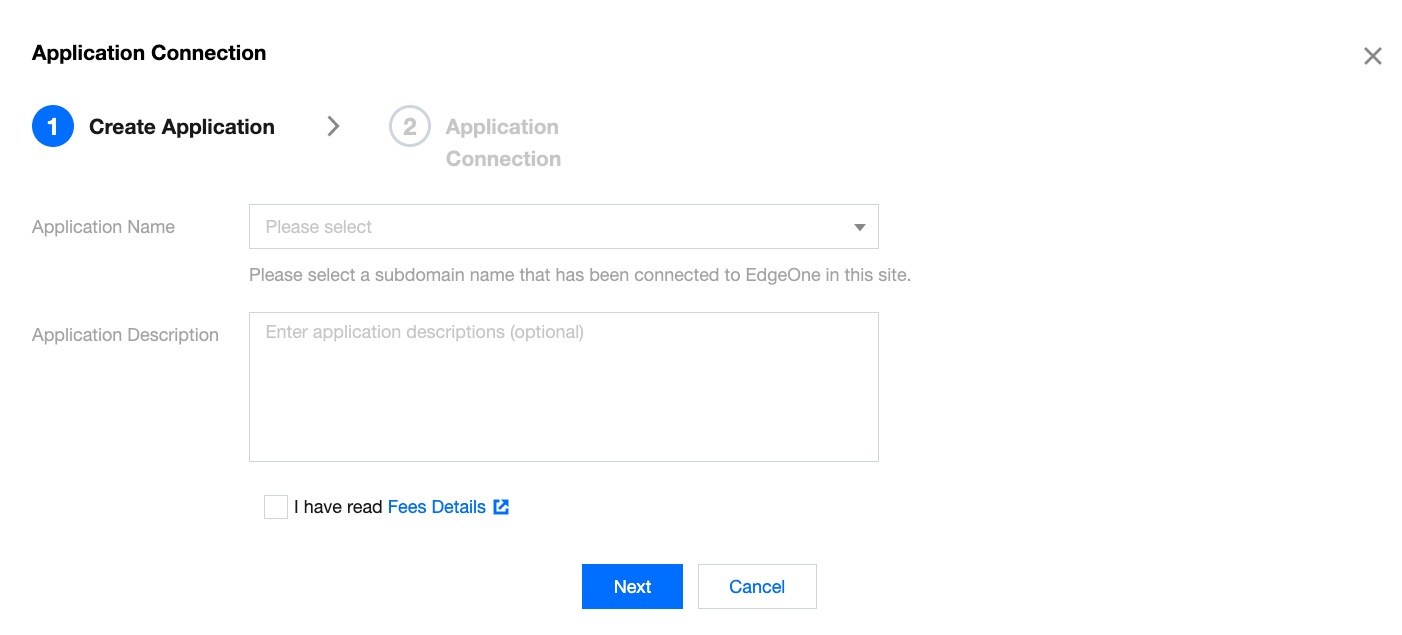
4. In the Application connection window, enter the application name and description, select I have understood the billing details, and click Next.
5. Install the SDK based on the connection type.
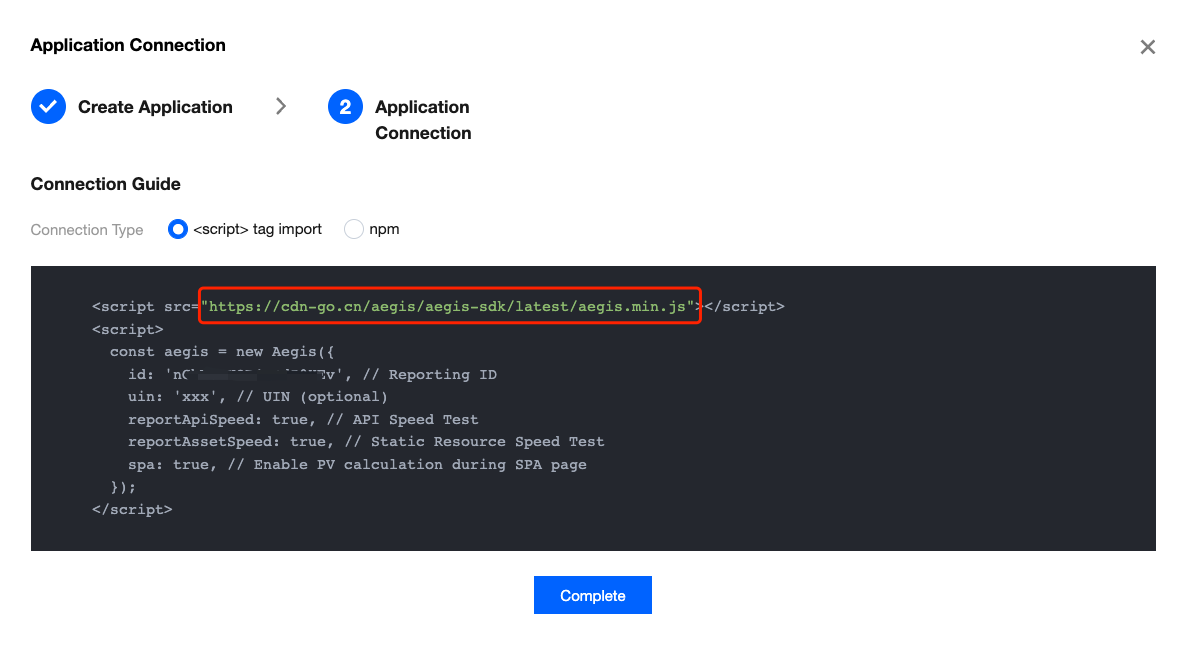
Install the SDK by importing the <script> tag
5.1.1 On the connection guide page, copy the provided <script> tag code.
5.1.2 Import the code below <script> tag import into the <head></head> tags of the site to be monitored.
Note:
This connection method uses the “h3-Q050” protocol, where cache-control is max-age=666 by default. To modify cache-control, you can add the max_age parameter, such as <script src="https://cdn-go.cn/aegis/aegis-sdk/latest/aegis.min.js?max_age=3600"></script>.
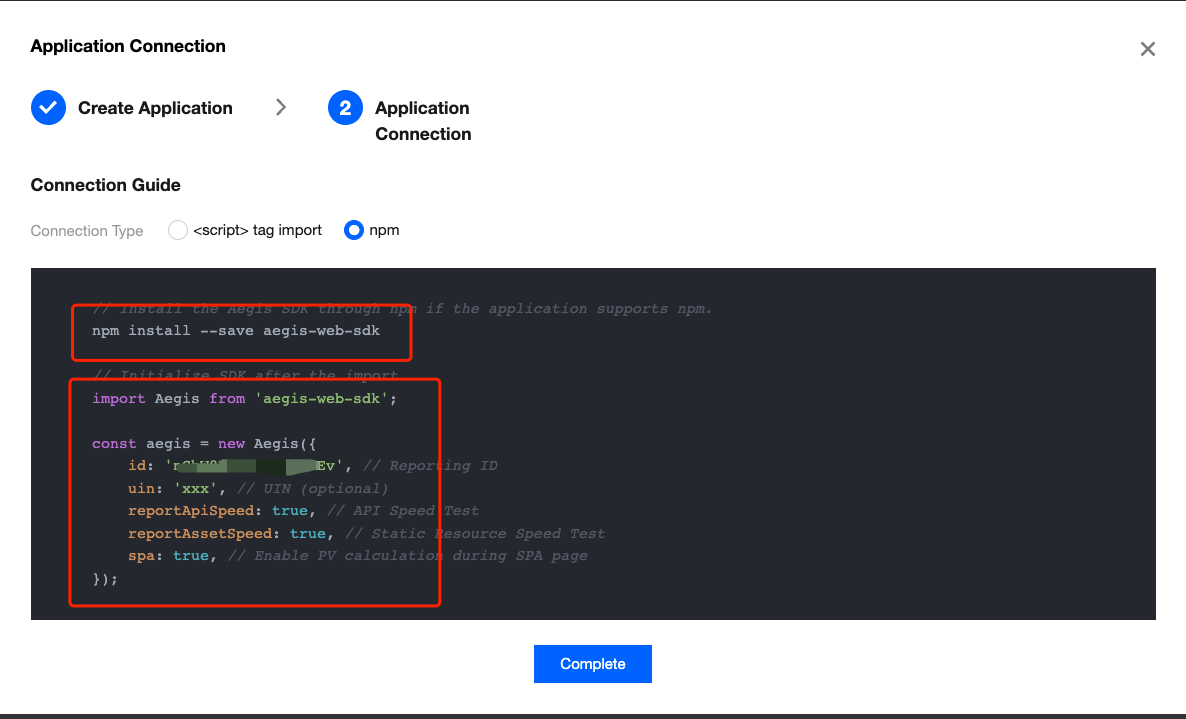
Install the SDK through npm
5.1 On the connection guide page, copy the first command line to import aegis sdk into your development environment.
5.2 Then, copy the provided code to initialize the SDK in your JavaScript code.
Data Monitoring
After performing the above connection steps, go to the Page performance, Page view, and Static resource pages to view the relevant data.
Page performance
The Page performance module supports multidimensional page performance analysis. You can analyze key page performance metrics such as firstScreenTime and request response through various views including performance change trend chart, page loading waterfall plot, and regional view. For more information, see Page Performance.
Page view
The Page view module displays the page view information such as UV, PV, WAU and MAU, and supports multidimensional page access analysis. For more information, see Page View.
Static resource
Frontend HTML pages mainly contain the following static resources: JavaScript, CSS, and image files. If such files fail to load, or it takes a long time to load them, the page will be affected or even crash. To address these problems, static resource monitoring helps you analyze the frontend static resource status. For more information, see Static Resource.