Overview
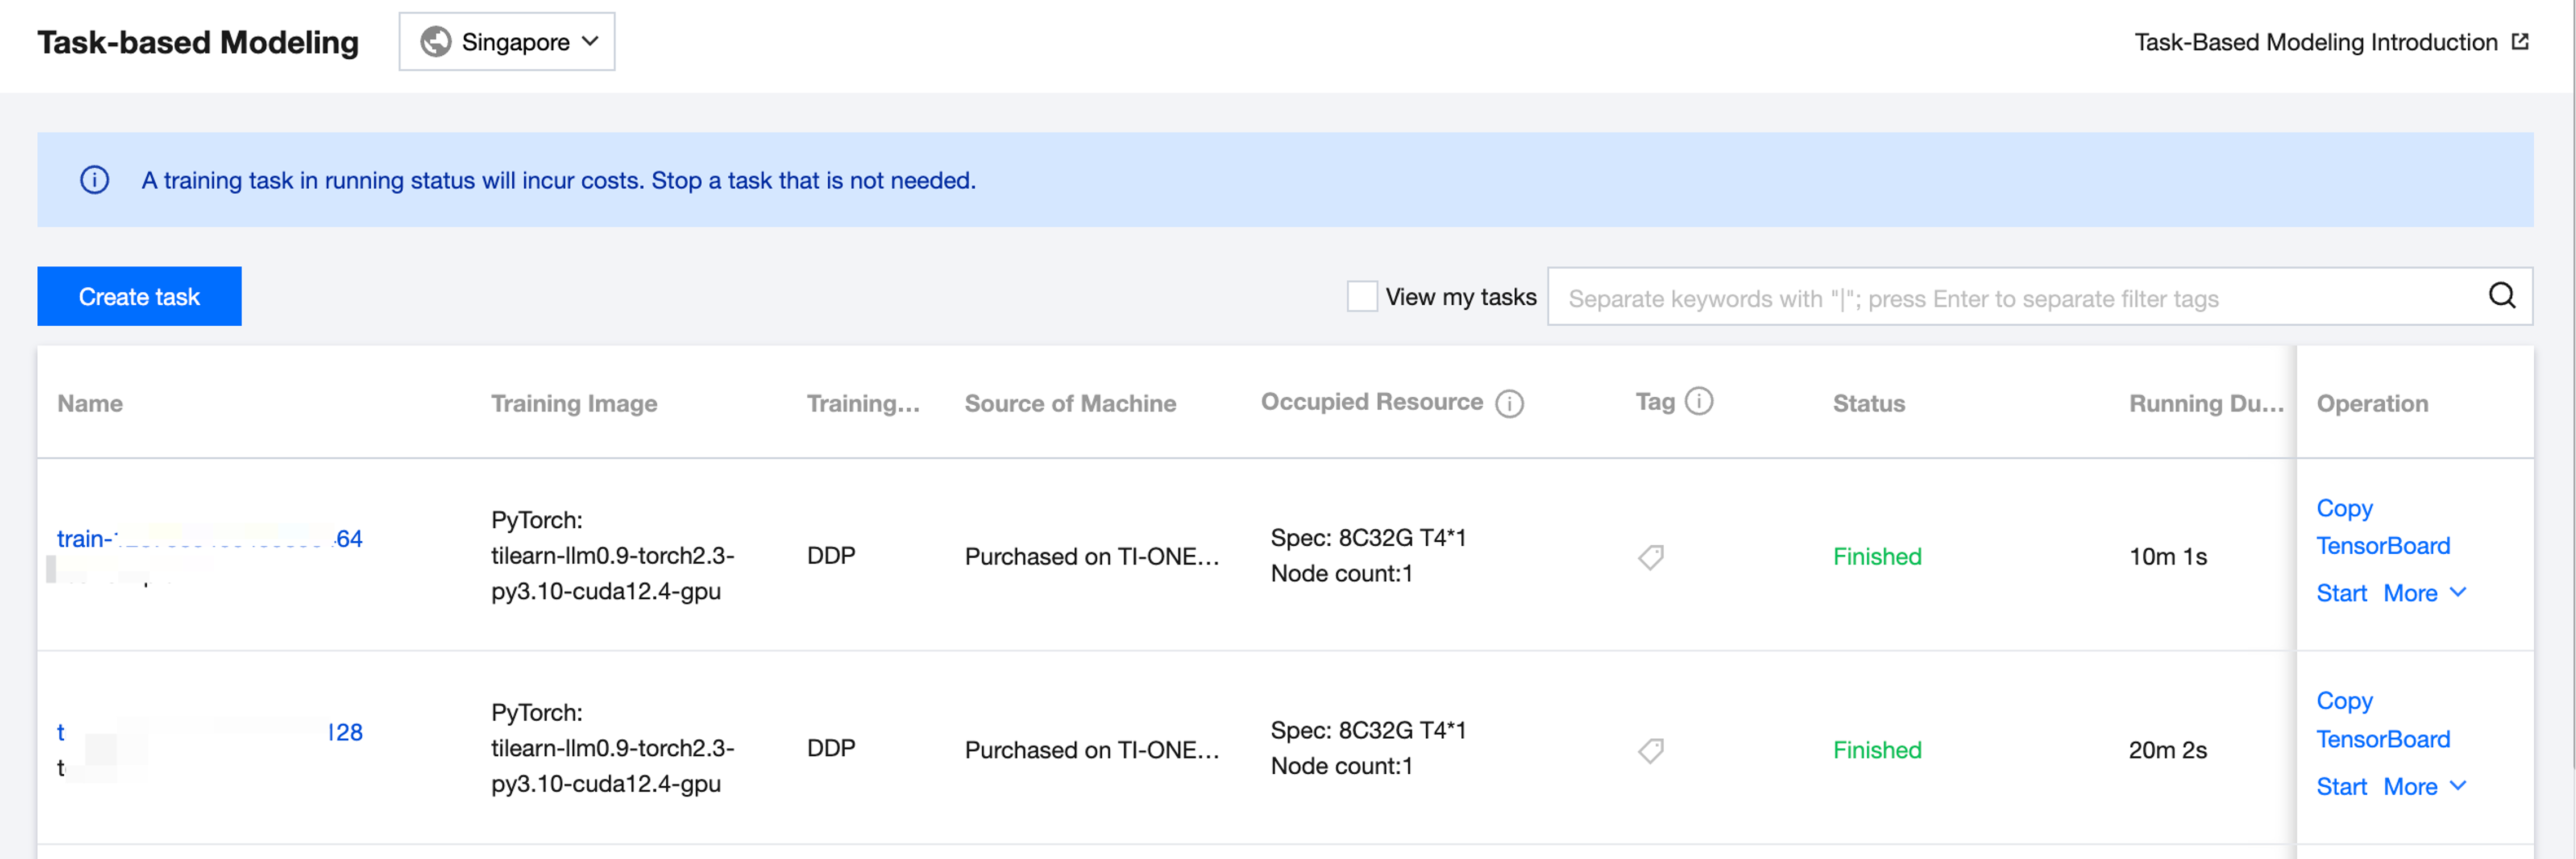
After a task is created, this training task record will be shown on the task list page. The list displays the task name, training image, machine source, occupied resources, tag, status (submitting, queuing, starting, running, abnormal, stopping, stopped, and completed), running time, creator, training start time, update time, and monitoring and operation. Operations include Replicate, TensorBoard, Stop, Start, and Delete.
Brief Introduction of Task Status:
Submitting: Status of a task from the moment it successfully initiates a submission request until it enters the queue.
Queuing: Status of a task after it is successfully submitted and enters the queue. When the status is Queuing, you can click to display the queuing duration and priority of the task.
Starting: Status of a task after it is successfully dequeued, scheduled with resources, and starts initialization.
Running: Status of a task after it is successfully loaded and running.
Exception: Status of a task if it exits exceptionally.
Stopping: Status of a task if it is manually stopped by the user and its resources are repossessed.
Stopped: Status of a task if it is manually stopped by the user and terminated.
Completed: Status of a task if training is completed and it exits normally.
Viewing My Tasks
There is a shortcut option to view my tasks in the upper-right corner of the list page. After the shortcut option is checked, only the tasks created by the currently logged-in sub-account will be displayed.
Replicating Tasks
To perform multiple training tasks to compare the training effectiveness of different datasets or different hyperparameter configurations, you can replicate the training tasks. Click Copy Training Task to navigate to the task creation window. You can make simple modifications based on the configuration information of the original task to quickly create a task.
Tensorboard
The platform supports reading summary data from Cloud File Storage (CFS) and Cloud Object Storage (COS) to generate a TensorBoard monitoring dashboard. The specific procedure is shown as follows:
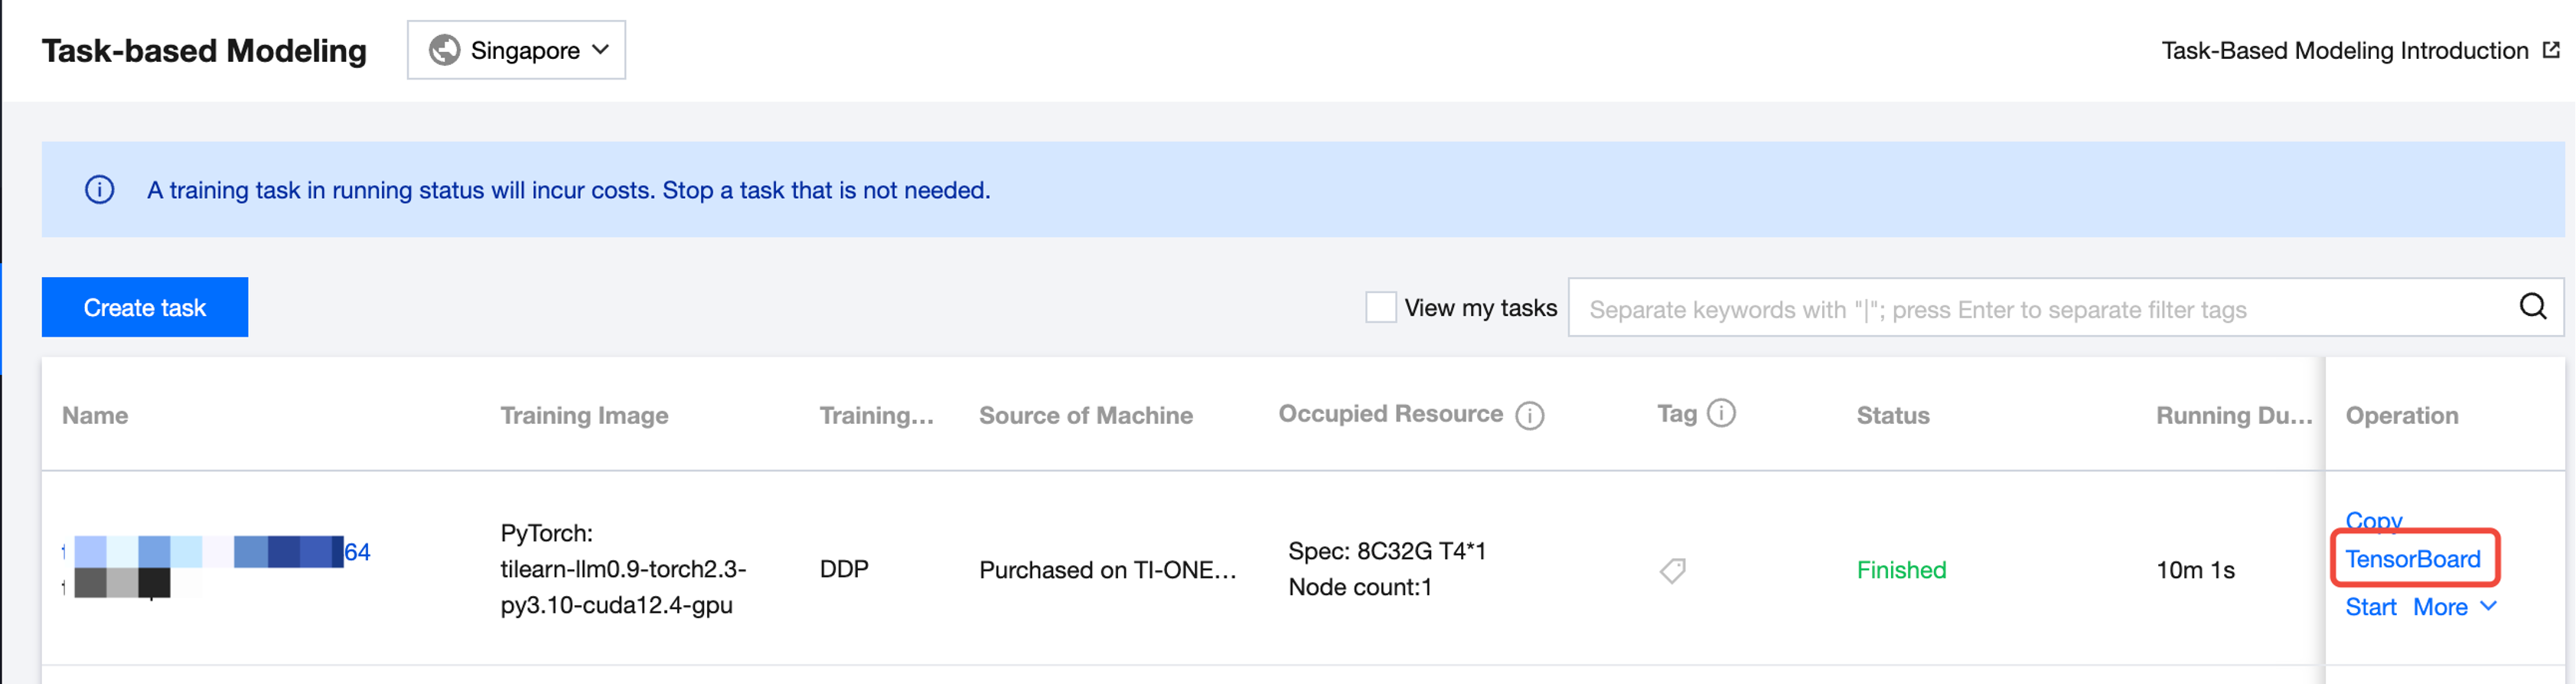
Click Tensorboard in the operation column of the Task List to start the configuration of TensorBoard.
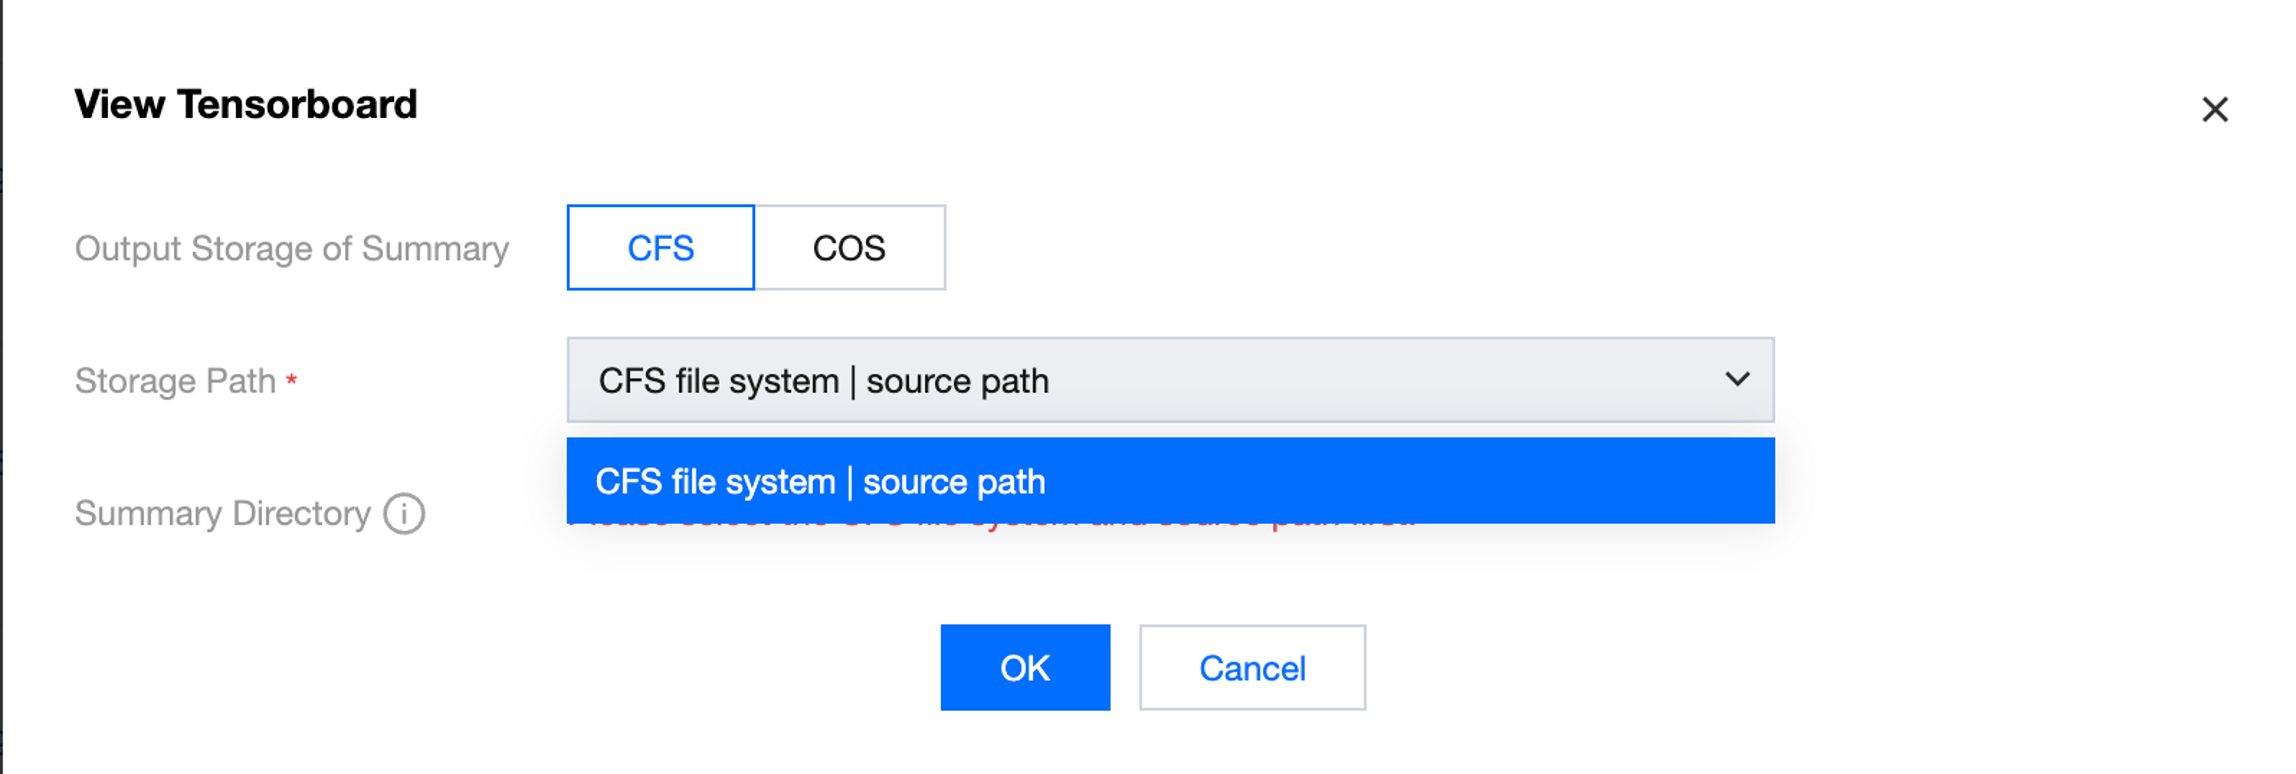
If your training output file is stored in CFS, select CFS to store the output summary, and select the storage path as the CFS file system and source path configured for your current training task (select one path if you have configured multiple paths). Fill in the directory within the container where your summary data resides. The platform will display the local path of the container where your CFS system is mounted by default, and you only need to fill in the specific subdirectory where the summary file is located, as shown below:
If your training output files are stored in COS, select COS to store the output summary. Note that if COS is selected, the storage path defaults to the training output COS path configured for the task, namely, + /< job_id> + /summary. The summary directory defaults to /opt/ml/summary/ (path within the container). You are not required to configure the summary directory. You need to output the summary monitoring data to /opt/ml/summary/ in advance in the training code. Otherwise, the TensorBoard panel cannot be created.
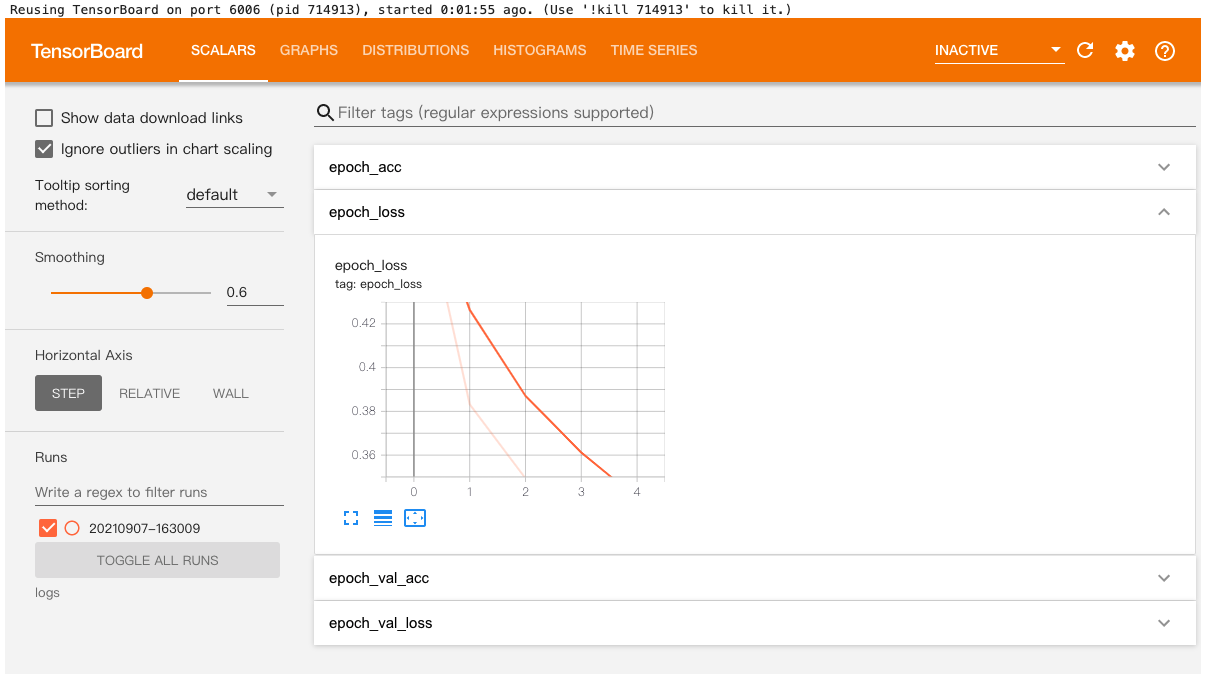
Once the configuration is completed, click Confirm to enter the TensorBoard info page. Click Click to jump on the page to navigate to the TensorBoard panel.
It may take 1-2 minutes to start TensorBoard. During this period, do not close the redirection page. Currently, the TensorBoard service is provided free for users. You may encounter a situation of insufficient platform resources. If you encounter an "unavailable" status in this service, please wait patiently and try again later.
Stopping or Starting a Task
You can stop an ongoing training task manually. A stopped task can be restarted.
Deleting a Task
You can manually delete records for completed/stopped tasks.
Task Details
Click the name of the training task to go to the task details page.
Basic Info
The basic configuration page displays the information about basic configurations, job parameters, and resource configurations of the training task. The task tags can be updated.
Instance List
The instance list page shows the instances of current training tasks. On this page, you can view the instance ID, occupied resources, and status. Additionally, you can directly access the instance container for a training instance. You can click Enter Container on the page to enter the webshell page, and execute command-line operations on the training instance container.
Monitoring
Task monitoring has two dimensions: training metrics monitoring and resource monitoring. The training metrics monitoring page shows the monitoring metrics reported by users in a customized manner. The metrics monitoring information generated during the user's training process needs to be reported by the user in the training script following the platform rules. For details, check the push_training_metrics() command in Tikit - Submitting Training Tasks. Resource monitoring information shows the CPU usage, memory usage, used memory, VRAM usage, used VRAM of the training task. Fine-grained GPU-level monitoring metrics will be displayed for full-GPU tasks. If you have submitted a full-machine training task, you can view the node RDMA usage monitoring information. Code Example for Reporting Training Metrics:
def validate(val_loader, model, criterion, epoch, args):
batch_time = AverageMeter('Time', ':6.3f')
losses = AverageMeter('Loss', ':.4e')
top1 = AverageMeter('Acc@1', ':6.2f')
top5 = AverageMeter('Acc@5', ':6.2f')
progress = ProgressMeter(
len(val_loader),
[batch_time, losses, top1, top5],
prefix='Test: ')
model.eval()
with torch.no_grad():
end = time.time()
for i, (images, target) in enumerate(val_loader):
if args.gpu is not None:
images = images.cuda(args.gpu, non_blocking=True)
target = target.cuda(args.gpu, non_blocking=True)
output = model(images)
loss = criterion(output, target)
acc1, acc5 = accuracy(output, target, topk=(1, 5))
losses.update(loss.item(), images.size(0))
top1.update(acc1[0], images.size(0))
top5.update(acc5[0], images.size(0))
batch_time.update(time.time() - end)
end = time.time()
if i % args.print_freq == 0:
progress.display(i)
client.push_training_metrics(int(time.time()), {"acc1": float(format(top1.avg, '.3f')), "acc5": float(format(top5.avg, '.3f'))}, epoch=epoch)
print('TIACC - * Acc@1 {top1.avg:.3f} Acc@5 {top5.avg:.3f} Epoch={epoch}'
.format(top1=top1, top5=top5, epoch=epoch))
return top1.avg
After task completion, you can view the metrics under "Task-based Modeling/Monitoring" (there may be a slight delay).
Training Logs
The training task page displays the training logs at the instance level. The logs can be refreshed and viewed in real time. It also supports full-text search. You can view the history logs of this training task by selecting the time. The platform stores the logs for a maximum of 15 days by default. If you need persistent storage, please use the Cloud Log Service (CLS) log shipping function. You can enable the CLS log shipping function or disable the CLS on the current page.
Events
The platform supports viewing events that occur during task execution. You can diagnose issues based on these events.