Connecting TMP to Local Grafana
Download
포커스 모드
폰트 크기
If you need to view the relevant data of TMP in the local Grafana system, you can use the HTTP API provided by TMP to do so. This document describes how to connect TMP data to local Grafana.
Directions
Step 1: Obtain the HTTP API provided by TMP
1. Log in to the TMP console.
2. Click the corresponding pay-as-you-go instance to enter the basic information page of TMP.
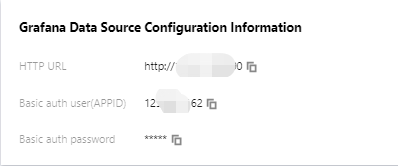
3. Get the HTTP API address in the service address module. If you need to improve the security of Grafana data read, you can obtain the authentication token of the TMP instance and fill it in as instructed in step 2.
Step 2. Add data source to local Grafana
1. Log in to the local Grafana system with admin account.
2. Select Configuration > Data Sources on the left sidebar (non-admins cannot view this menu).
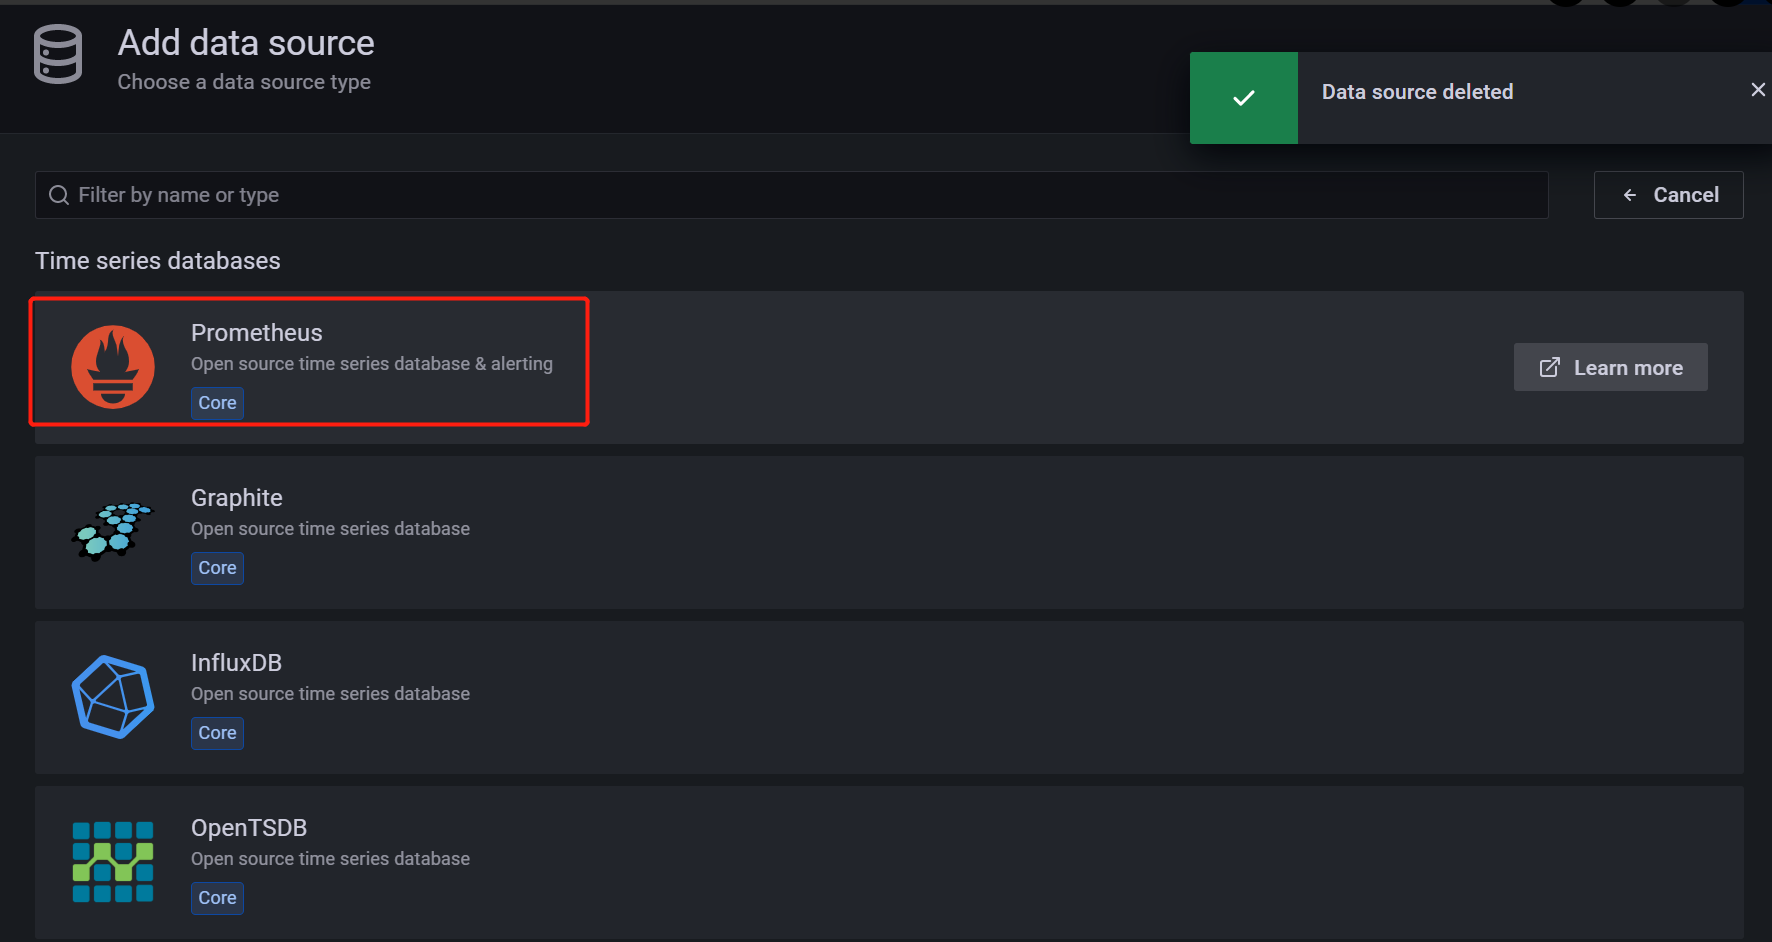
3. On the Data Sources page, click Add data source.
4. On the Add data source page, select Prometheus.
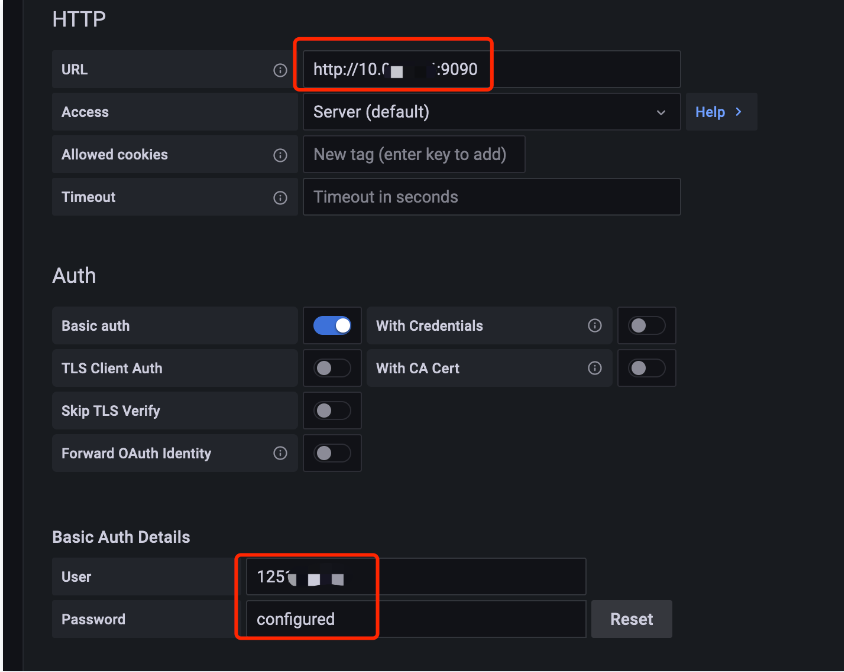
5. On the Settings tab, enter a custom name in the Name field, and paste the HTTP API obtained in step 1 in the URL field.
6. Toggle on Basic Auth in the Auth module. In the Basic Auth Details module, set User same as Basic auth user and Password as Basic auth password obtained in the step 1.
7. Click Save & test to complete the settings.
Step 3. Verify whether the connection is successful
Follow the steps below to verify whether TMP is successfully connected to the local Grafana:
1. Log in to your local Grafana system.
2. On the left sidebar, select + > Create.
3. On the New dashboard page, click Add a new panel.
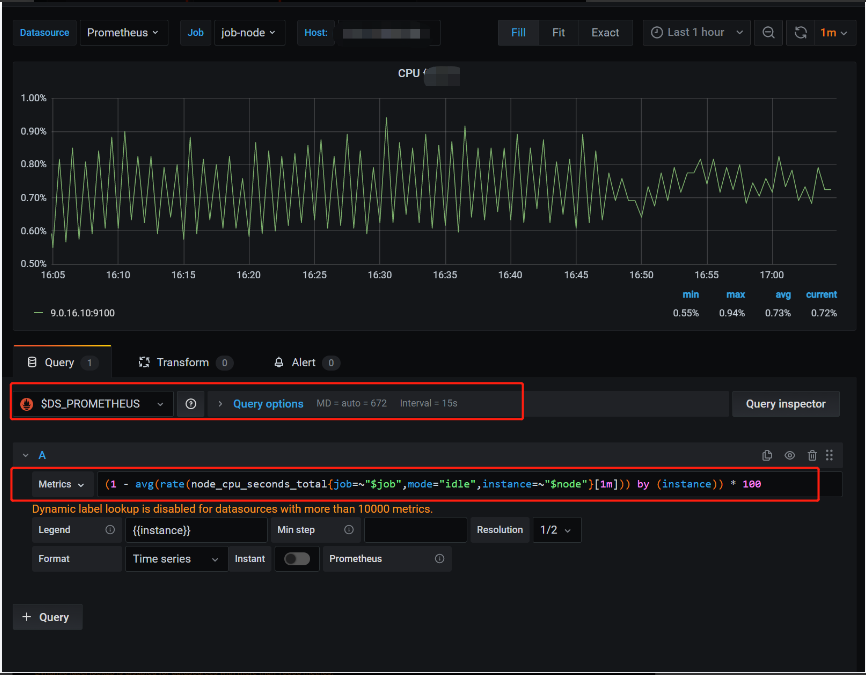
4. On the Edit Panel page, select the data source added in step 2 in the drop-down box on the Query page, enter the metric name in the Metrics field in the A module and press Enter.
5. If the chart of the corresponding metric can be displayed, the operation is successful. Otherwise, check whether the API address or token entered is correct, and whether the data source has TMP data.
피드백