tencent cloud

TencentCloud Managed Service for Prometheus

문서TencentCloud Managed Service for Prometheus

Querying Monitoring Data

Download
포커스 모드
폰트 크기
마지막 업데이트 시간: 2024-01-29 16:01:55

Overview

When you need to query monitoring data, you can request data through query APIs.

APPID/Token Acquisition Method

TMP uses APPID + Token to authenticate the access.
APPID can be obtained here.
Token can be obtained from the basic information of the corresponding TMP instance.

Query APIs

GET /api/v1/query
POST /api/v1/query

Query Parameters

query=<string>: Prometheus: query expression.
time=<rfc3339 | unix_timestamp>: timestamp, which is optional.
timeout=<duration>: detection timeout period, which is optional and specified by the -query.timeout parameter by default.

Sample Simple Query

You can use the following sample to query data through an API. The query service address and authentication information can be viewed in the corresponding instance's information in the console:
curl -u "appid:token" 'http://IP:PORT/api/v1/query?query=up'
If the returned status code is 401, please check whether the authentication information is correct.
< HTTP/1.1 401 Unauthorized
< Content-Length: 0

Range Query

GET /api/v1/query_range
POST /api/v1/query_range
Querying data by time range is the most common query scenario. To do so, you can use the /api/v1/query_range API as shown below:
$ curl -u "appid:token" 'http://IP:PORT/api/v1/query_range?query=up&start=2015-07-01T20:10:30.781Z&end=2015-07-01T20:11:00.781Z&step=15s'
{
"status" : "success",
"data" : {
"resultType" : "matrix",
"result" : [
{
"metric" : {
"__name__" : "up",
"job" : "prometheus",
"instance" : "localhost:9090"
},
"values" : [
[ 1435781430.781, "1" ],
[ 1435781445.781, "1" ],
[ 1435781460.781, "1" ]
]
},
{
"metric" : {
"__name__" : "up",
"job" : "node",
"instance" : "localhost:9091"
},
"values" : [
[ 1435781430.781, "0" ],
[ 1435781445.781, "0" ],
[ 1435781460.781, "1" ]
]
}
]
}
}

Adding Data Source to Self-Built Grafana

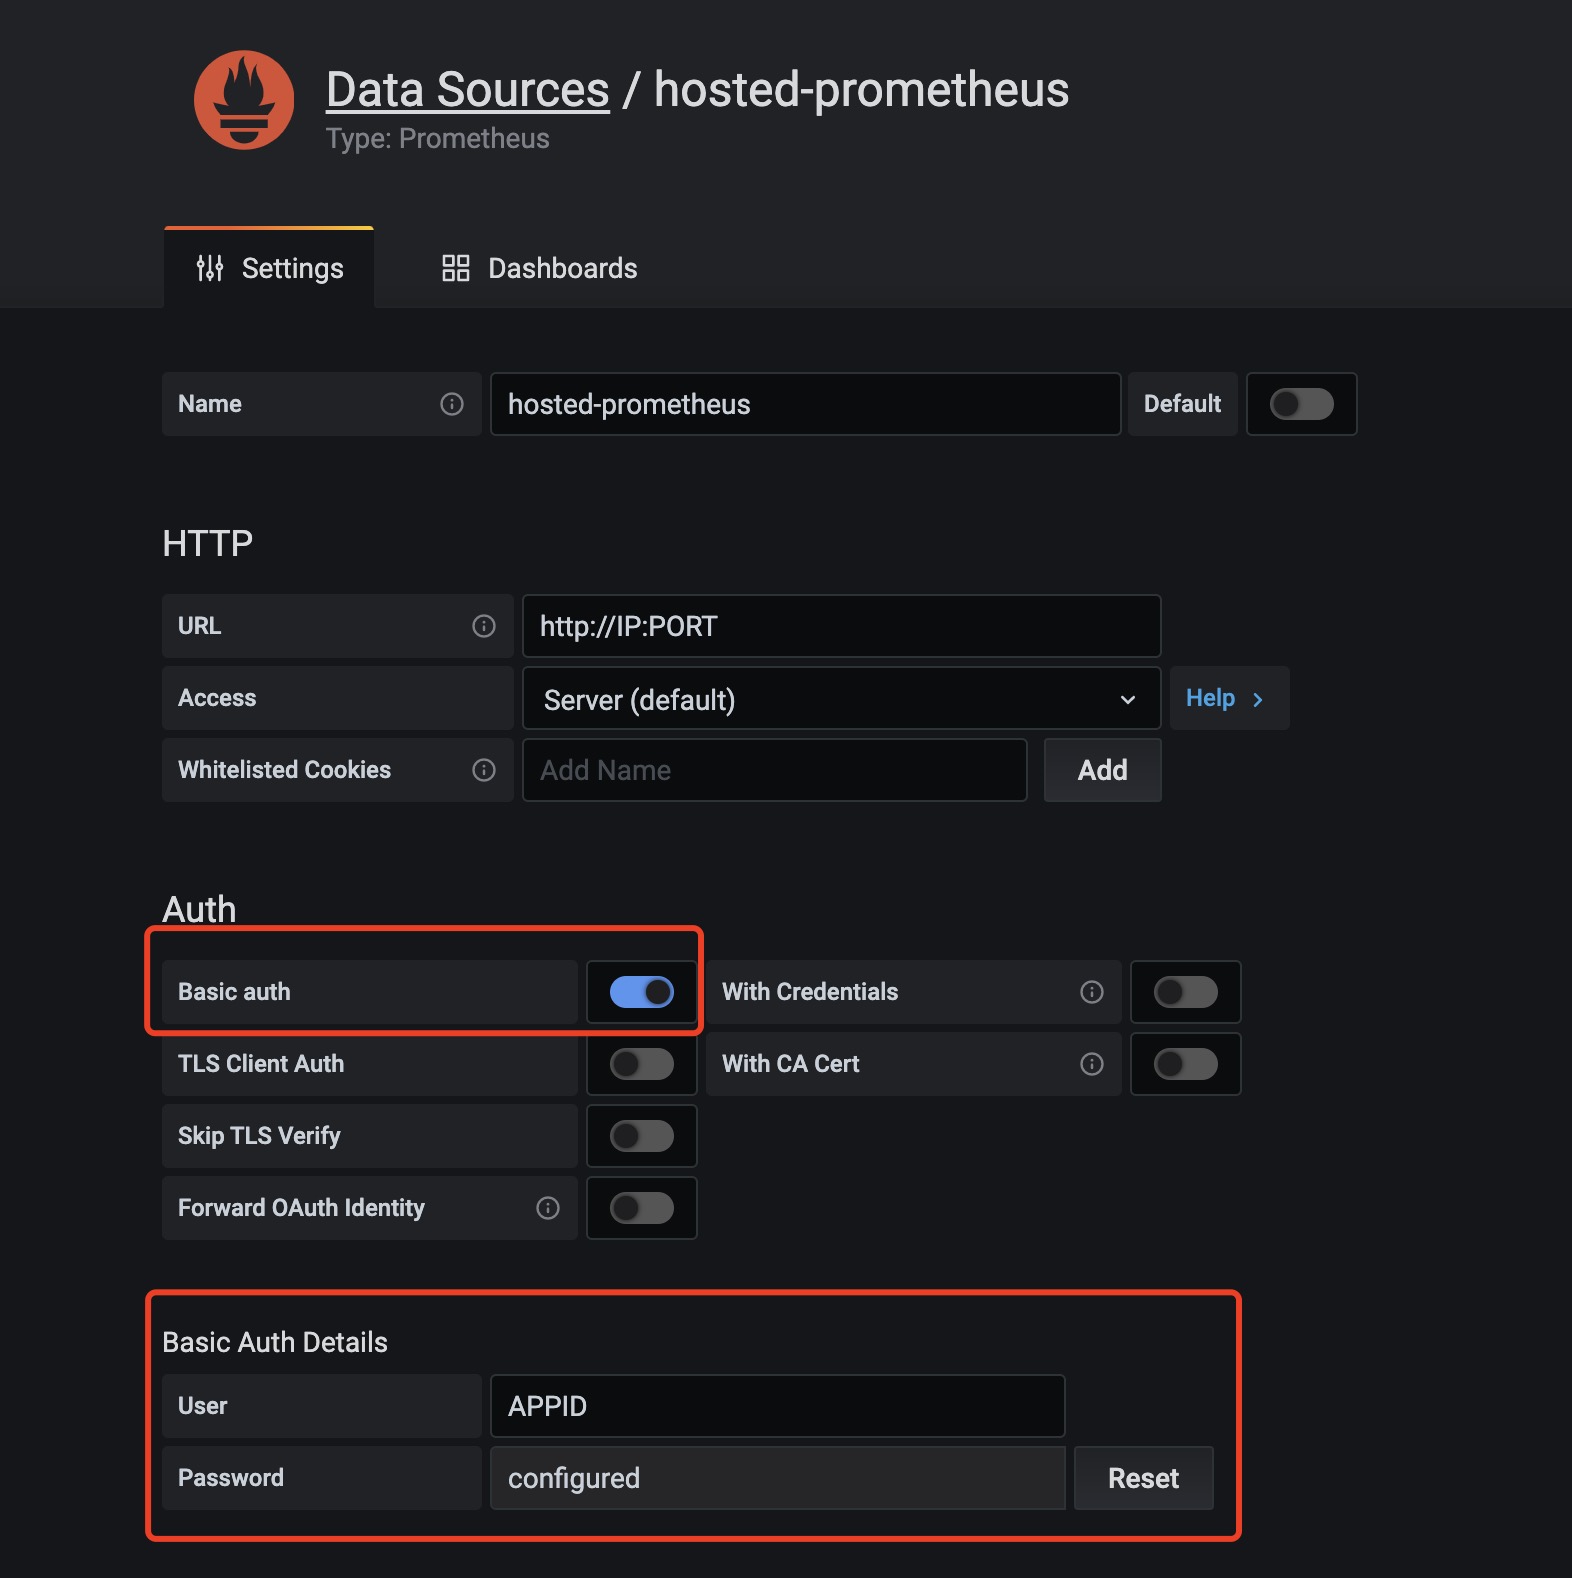
You can add TMP as a data source in your self-built Grafana, and then you can view data in Grafana, provided that they are in the same VPC and can access each other over the network.
Enable the BasicAuth authentication method and enter the corresponding authentication information as shown below:


도움말 및 지원

문제 해결에 도움이 되었나요?

피드백