Connecting to Prometheus
ダウンロード
フォーカスモード
フォントサイズ
Integration Introduction
Integration Based on TCOP
Cloud product monitoring can be configured by using Prometheus and Grafana provided by Tencent Cloud Observability Platform (TCOP). It supports integrating and displaying the metrics collected by Cloud Monitor through Prometheus. For details, see Cloud Monitor.
Integration Based on Open-Source Standard Prometheus Exporter
TDMQ for Apache Pulsar supports integrating the monitoring data of pro clusters into self-built Prometheus of users, allowing users to easily monitor the operation of message queue clusters. Users can also perform Horizontal Pod Autoscaling (HPA) on business workloads in a timely manner based on Prometheus monitoring data, making the overall online Ops more automated.
Advanced Usage:
When the standard Prometheus monitoring format is implemented, users can use their own Prometheus to obtain data through the Exporter provided by TDMQ for Apache Pulsar.
For example, after a Prometheus data source is configured through Grafana, Kubernetes can obtain Prometheus data to perform operations such as HPA on workloads.
Note:
If your pro cluster was created before March 25, 2024, a cluster upgrade is required for enabling this feature. If you have such a requirement, contact us.
User Guide
1. Log in to the TDMQ for Apache Pulsar pro cluster console.
2. In the left sidebar, choose Cluster, and click the ID of the target instance to go to the Basic Information page of the instance.
3. Click to go to the Monitoring Information sheet.
4. In the upper-right corner, click Obtain Monitoring Instances of Prometheus Monitoring Portal, and select the appropriate network type and network configuration.
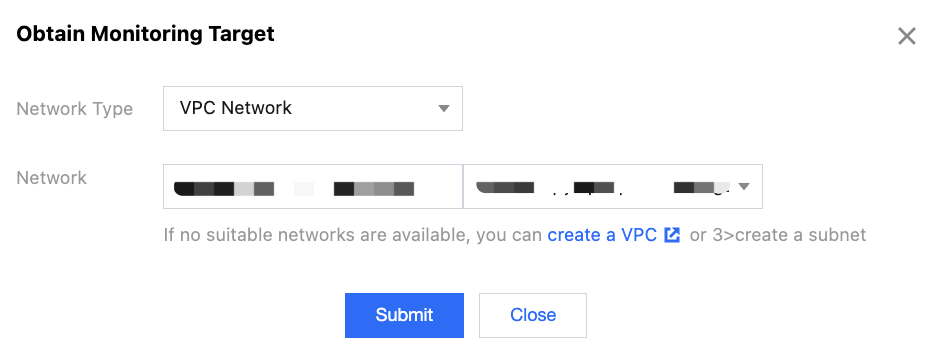
5. Click Submit to obtain a group of monitoring targets.
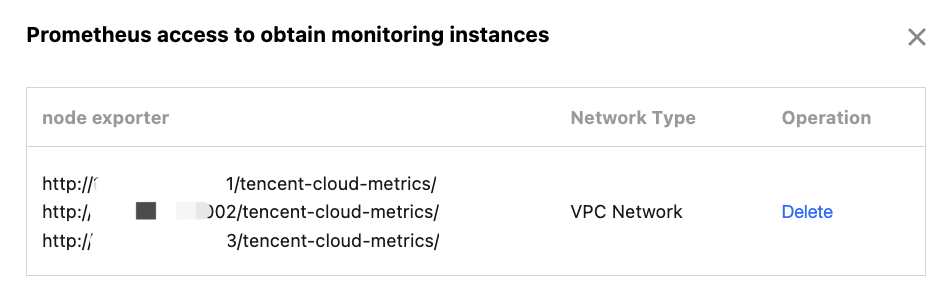
6. Modify the configuration file prometheus.yml to add a node_exporter capturing task.
job_name: prometheus-tdmq-pulsarhonor_timestamps: truescrape_interval: 60smetrics_path: /tencent-cloud-metrics/scheme: httpstatic_configs:- targets:- 10.x.x.x:10001- 10.x.x.x:10002
honor_timestamps: When it is set to true , Prometheus will use the metric timestamps provided by the Exporter instead of the timestamps when the metrics are received by the Prometheus server.scrape_interval: specifies the frequency for capturing monitoring metric data. Currently, metrics are collected at a minute-level granularity.metrics_path: specifies the path to obtain monitoring metrics. Set it to /tencent-cloud-metrics/.scheme: specifies the protocol for accessing resources. Currently, it can only be set to http.7. Access the corresponding visualization page to view the configured monitoring metrics.
Note:
1. This feature provides cluster-level, topic-level, and subscription-level monitoring data for pro clusters, fully aligned with the metrics in the console. The difference is that the monitoring data displayed in the console has been aggregated, while the data obtained from Prometheus is the data before aggregation. You need to perform aggregation for the display on the Grafana dashboard by yourself.
2. Due to differences in the collection paths of the monitoring data and aggregation logic, the data captured by using this feature may differ in specific values from that displayed in the user console.
3. This feature is supported only by pro clusters.
Metric Description
Cluster-Level Metrics
Metric | Metric Name |
Cluster message production rate | pulsar_caculate_rate_in |
Cluster message consumption rate | pulsar_caculate_rate_out |
Cluster message storage size | pulsar_storage_size |
Peak cluster production bandwidth | pulsar_throughput_in |
Peak cluster consumption bandwidth | pulsar_throughput_out |
Topic-Level Metrics
Metric | Metric Name |
Message production rate | pulsar_caculate_rate_in |
Message consumption rate | pulsar_caculate_rate_out |
Message production traffic | pulsar_throughput_in |
Message consumption traffic | pulsar_throughput_out |
Number of producers | pulsar_producers_count |
Number of consumers | pulsar_consumers_count |
Message storage size | pulsar_storage_size |
Number of message backlogs | pulsar_msg_backlog |
Message backlog size | pulsar_storage_backlog_size |
Number of traffic throttling times for the producer quantity | pulsar_publish_rate_limit_times |
Number of messages to be filtered | pulsar_tag_filter_rejected_msg_rate |
Subscription-Level Metrics
Metric | Metric Name |
Number of message backlogs | pulsar_subscription_back_log |
Message consumption rate | pulsar_subscription_msg_rate_out |
Message consumption traffic | pulsar_subscription_msg_throughput_out |
Number of unacknowledged messages | pulsar_subscription_unacked_messages |
Number of consumers | pulsar_subscription_consumers_count |
Number of delayed messages | pulsar_subscription_delayed |
Message deletion rate | pulsar_subscription_msg_rate_expired |
Number of messages to be filtered | pulsar_subscription_tag_filter_rejected_msg_rate |
フィードバック